1225 NE 124th St Unit 46A · North Miami, FL
Flood risk 5/10 · Moderate
- FEMA flood zone
- X (shaded)
- Chance of flooding over 30 yrs
- 0.24%
- Est. flood insurance / yr
- $507 – $1,088
Fire risk 1/10 · Minimal
- Est. fire insurance / yr
- $947 – $1,759
Heat risk 10/10 · Severe
- Hot days now (above 103°F)
- 7 days/yr
- Hot days in 30 yrs
- 27 days/yr
Wind risk 10/10 · Severe
- Chance of severe wind over 30 yrs
- 99.0%
Air-quality risk 2/10 · Minimal
- Unhealthy air days now
- 1 days/yr
- Unhealthy air days in 30 yrs
- 2 days/yr
Risk factors via First Street. Map © Google.
Why this score? — see what drove the B grade
The composite is a weighted blend of 9 inputs, each scored 0–100. Each bar is that input's sub-score; the figure is the points it added to the 100-point composite (weight × sub-score).
- Cash flow +30.0/30.0
- 1% rule +10.0/10.0
- DSCR +10.0/10.0
- ARV discount +7.5/15.0
- Schools +4.2/10.0
- Livability +4.2/5.0
- Condition / age +2.5/5.0
- Rent growth +2.3/5.0
- Appreciation +0.0/10.0
$129,000
🖨 Deal sheet 📄 Offer letter ✓ Due diligence
Listing remarks MLS
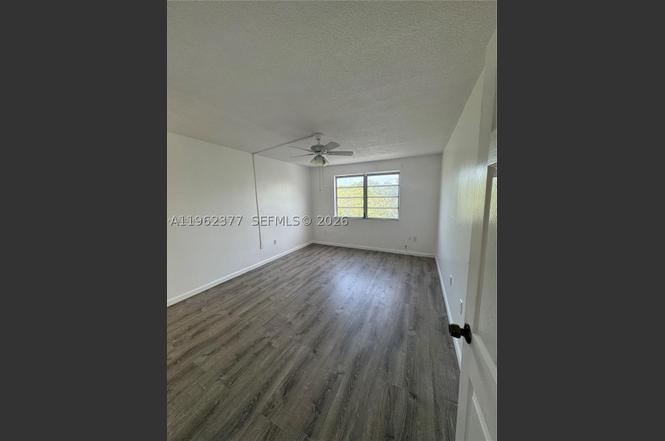
Great investment centrallly located condo close to US1, Johnson & Wales, FIU, Barry Universities. Building in quiet location. . Large living room with balcony. Big bedroom with walk-in closet. Central air/heat. Maintenance Covers, secure covered parking, water, pest control, insurance, roof, common areas, outside structure, community pool, elevator, laundry facilities, security cameras. Low taxes . Ok to lease. $3,000 Towards Buyer's Closing Cost. Don't miss this great opportunity
Key facts
- $629 HOA
- Garage
- Built 1972
Property features AI
Finance
- Financial info: Pets not allowed
- HOA & community: Monthly association fee; Association fee includes management, electricity, hot water, sewer, and trash; Association amenities: laundry and elevator(s)
Exterior
- Parking: One covered garage space; Guest parking available
- Home design: 4-story building; Entry on level 4
- Construction: Effective year built
- Exterior features: Attached property
Interior
- Kitchen: Dishwasher; Electric range; Microwave
- Bathrooms: One full bathroom
- Heating & cooling: Central heating; Central air conditioning
- Interior features: Other interior features
- Laundry & utility: Common area laundry
Neighborhood map
What this means for you Summary
Snapshot
- This is a 1-bed/1.0-bath condo listed at $129k.
Deal economics
- At list price, monthly cash flow is $1k ($13k/yr) — positive.
- The deal already cash-flows at list — no discount required.
- Meets the 1% rule at list price ($3k rent vs $129k).
- Recommended offer: $114k (12.0% below list) — sets the bar for market timing.
- Cap rate 16.3% vs local median 4.1% in North Miami — top-decile yield for the area; either an underpriced asset or a hidden risk that comps aren't pricing in. Stress-test before assuming the spread holds.
Location & tenants
- Location reads 83/100 on livability (#51 in FL, #914 nationally) — a professional / high-income tenant draw. Strengths: amenities A+, commute A+, health & safety A+; Watch: schools D+, employment D.
- Miami-Dade (suburban): math 45% / reading 54% proficiency, ranked #40 of 73 in FL (top 55%) — families likely to look elsewhere, expect single-tenant / working-renter base with shorter leases; 64% free/reduced lunch — lower-income household profile, screen leases tightly.
- Market conditions: Rents soft (-0.7%/yr); 338 active listings in the ZIP; 10,051 units permitted in Miami-Dade County in 2024 (7,758 in 5+ unit buildings).
- At $3,363/mo this rent would consume 69% of the median local household income ($58k/yr) (locally 3226% of renters already pay >50% of income on rent) — very limited rent-growth headroom before tenants either downsize or default.
Forward outlook
- Local home prices are declining (-3.0%/yr); year-one equity from $892 of loan paydown is wiped out by about $4k of value loss. Plan a longer hold.
- Miami-Dade County population projected at +28% by 2050 — long-run rental-demand tailwind backs the buy-and-hold thesis.
- At projected returns (-3.0% appreciation + 0.0% rent growth), your $36k cash investment doubles in ~4 years — after that, you're playing with house money.
Negotiation context
- It's been on market 124 days — a 12% lower offer ($114k) is reasonable based on typical stale-listing flexibility.
- 5 sale attempts since 6y ago; this cycle's ask has dropped $20k (13%) from the opening price — seller is motivated, your offer sets the floor, not the list.
- Current owner paid $105k; 23% above their basis — modest negotiation headroom, anchor on the comps not their cost.
Risks & watch-outs
- Climate carrying-cost: moderate flood risk; severe wind risk, 99% chance of damaging wind over 30y; extreme-heat days projected 7→27/yr by 2055 (HVAC capex compounding) — expect insurance premiums to compound above CPI over the hold.
Questions for the listing agent
- It's been on market 124 days. Have you received any prior offers? Is the seller open to a 12% concession, seller financing, or rate buy-down credit?
- Built in 1972 — when were the roof, HVAC, electrical panel, plumbing, and water heater last replaced?
- What does the HOA fee cover, when was the last increase, and are there any pending special assessments or reserve-fund shortfalls?
- Any open or pending special assessments — roof, HVAC, plumbing, elevator, façade? What's the per-unit balance and payoff schedule, and is the seller paying it off at close or rolling it to the buyer?
- Why hasn't it sold? Are there any deal-killer items the seller is aware of (foundation, flood, title, zoning, code violations)?
- Is there a deadline driving the sale (1031 exchange, divorce, estate, relocation)? That informs how much negotiation room exists.
- Schools are D-rated, which usually means shorter tenancies and higher turnover. Who's the typical renter profile here, and what's been the actual vacancy rate?
- What's the average days-on-market for RENTAL listings here right now (not sales)? A rising rental-DOM trend means longer vacancies and softer asking-rent achievability than the comps imply.
- What's the recent tenant-quality profile in this submarket — average credit score on applications, eviction rate, late-payment / NSF rate, and stable-employment percentage? A property-management company in the area should have these aggregated.
- How much new apartment / multifamily construction is in the pipeline within 1–3 miles? Heavy new supply (>2% of stock underway) typically softens rents 12–24 months out; light construction supports rent growth.
Investment metrics
- 1% rule
- 2.61% ✓
- Cap rate
- 16.27%
- Cash-on-cash
- 35.62%
- DSCR
- 2.58
- GRM
- 3.2
CMA / ARV
No comps found within radius.
Projected returns pro-forma
-3.0% appreciation · 0.0% rent growth · sell at horizon
- IRR
- 26.8%
- Equity multiple
- 2.05×
- Total profit
- $37,997
- Equity at exit
- $19,234
- IRR
- 31.8%
- Equity multiple
- 3.35×
- Total profit
- $84,858
- Equity at exit
- $11,154
Cash invested: $36,120 (down + closing). Projections, not guarantees.
Landlord ↔ Tenant lean methodology
- Overall (STATE)
- 87 Strongly Landlord-Friendly
- State Florida
- 87 Strongly Landlord-Friendly · R+3
- County
- — inherits STATE
- City
- — inherits STATE
ZIP-level market 33161
- Rents YoY
- -0.7%
- Active inventory
- 338
- Price-to-rent
- 3.2×
Monthly cashflow live
- Estimated rent
- $3,363 medium interval (Pro) →
- Mortgage (P&I)
- −$676
- Tax from tax record
- −$225 /mo · $2,705/yr
- Insurance
- −$54
- HOA
- −$629
- Vacancy / Maint / Mgmt
- −$706
- Net cashflow
- $1,072
Break-even live
UW: 25.0% down · 7.5% · 30yr · 1.5% tax · 5.0% vac · 8.0% maint · 8.0% mgmt
Financing live
Cash to close
- Down payment
- $32,250
- Closing costs
- $3,870
- Reserves months
- —
- Total cash needed
- —
Loan-product check · same deal, 3 products live
Conventional
25% down · 7.5% · 30yr
- Down + closing
- —
- Monthly P&I
- —
- Monthly cashflow
- —
- DSCR
- —
- Eligible?
- —
Personal DTI + credit; lowest rate.
DSCR
20% down · 8.5% · 30yr
- Down + closing
- —
- Monthly P&I
- —
- Monthly cashflow
- —
- DSCR
- —
- Eligible?
- —
No personal income docs; deal must DSCR.
Hard money
10% down · 12.0% · 12mo
- Down + closing
- —
- Monthly P&I
- —
- Monthly cashflow
- —
- DSCR
- —
- Eligible?
- —
Short-term bridge; refi at stabilization.
HOA detail condo
- Monthly dues
- $629 · $7,548/yr
- Likely covers
- waterpoolsecurity
- Assessments
- None detected in remarks — confirm with the listing agent.
Listing history 34 events
-
2026-06-18days on market $129,000 Active 124 DOM
-
2026-06-17days on market $129,000 Active 123 DOM
-
2026-06-16days on market $129,000 Active 122 DOM
-
2026-06-15days on market $129,000 Active 121 DOM
-
2026-06-13days on market $129,000 Active 119 DOM
-
2026-06-09days on market $129,000 Active 115 DOM
-
2026-06-08days on market $129,000 Active 114 DOM
-
2026-06-07pricedays on market $129,000 Active 113 DOM
-
2026-06-04days on market $139,000 Active 110 DOM
-
2026-06-03days on market $139,000 Active 109 DOM
-
2026-06-02days on market $139,000 Active 108 DOM
-
2026-06-01days on market $139,000 Active 107 DOM
-
2026-05-31days on market $139,000 Active 106 DOM
-
2026-05-16price $139,000
-
2026-03-25price $144,000
-
2026-02-09$149,000 Active
-
2025-12-31historical
-
2025-11-24price $160,000
-
2025-08-28historical $1,650
-
2025-06-24price $168,000
-
2025-06-23price $180,000
-
2025-06-13$168,000 Active
-
2025-06-11price $1,650
-
2025-05-20$1,700
-
2024-01-12historical $1,600
-
2023-12-23price $1,600
-
2023-11-30$1,700
-
2020-10-01soldstatus $105,000
-
2020-08-24soldstatus $105,000 Closed 491-char remark
Show marketing remark (491 chars)
Great investment centrallly located condo close to US1, Johnson & Wales, FIU, Barry Universities. Building in quiet location. . Large living room with balcony. Big bedroom with walk-in closet. Central air/heat. Maintenance Covers, secure covered parking, water, pest control, insurance, roof, common areas, outside structure, community pool, elevator, laundry facilities, security cameras. Low taxes . Ok to lease. $3,000 Towards Buyer's Closing Cost. Don't miss this great opportunity
-
2020-08-16$115,000 Active 491-char remark
Show marketing remark (491 chars)
Great investment centrallly located condo close to US1, Johnson & Wales, FIU, Barry Universities. Building in quiet location. . Large living room with balcony. Big bedroom with walk-in closet. Central air/heat. Maintenance Covers, secure covered parking, water, pest control, insurance, roof, common areas, outside structure, community pool, elevator, laundry facilities, security cameras. Low taxes . Ok to lease. $3,000 Towards Buyer's Closing Cost. Don't miss this great opportunity
-
2007-02-17soldstatus $96,500
-
2000-11-21soldstatus $26,000
-
1979-06-01soldstatus $26,000
-
1972-11-01soldstatus $23,000
ⓘ Source: listings_history table (triggers on properties + properties_extension) + one-shot
backfill from property_details.listing_events for pre-trigger history.
Tax reassessment forecast FL · Resets to sale price
- Current annual tax
- $2,705 · $225/mo
- Projected year-2 tax
- $2,705 · $225/mo
- Expected delta
- $0/yr ($0/mo · 0.0%)
ⓘ Screening estimate from a state-policy table — verify with the county assessor before closing.
Climate risk First Street
- Flood 5/10 Major FEMA zone X (shaded) · 24% chance over 30 yrs
- Wildfire 1/10 Low
- Heat 10/10 Extreme 7 d/yr ≥103°F today · 27 d/yr by 30 yrs out
- Wind 10/10 Extreme 99% chance of damaging wind over 30 yrs
- Air quality 2/10 Low 1 unhealthy d/yr today · 2 by 30 yrs out
Nearby sold comps map
Loading sold comps map…
Walkable amenities ~0.75 mi
Loading nearby amenities…
Taxation est. · year 1
- Rental income
- $40,355
- − Mortgage interest
- −$7,226
- − Property taxes
- −$2,705
- − Insurance
- −$645
- − Repairs & maintenance
- −$3,228
- − Management
- −$3,228
- − HOA
- −$7,548
- − Depreciation
- −$3,753
- Taxable income
- $12,022
- Est. tax owed @ 24.0%
- −$2,885
- After-tax cash flow
- $9,979/yr
For passive investors: Depreciation is non-cash, so a rental often shows a tax loss while cash-flowing — sheltering income. Rental losses are passive: they offset passive income freely, and up to $25,000/yr can offset ordinary (W-2) income if you actively participate and your MAGI is under $100k (phasing out to $0 by $150k); unused losses carry forward. On sale, claimed depreciation is recaptured at up to 25%, and gains may owe capital-gains tax (a 1031 exchange can defer both). Figures are a year-1 estimate at your 24.0% rate — not tax advice; consult a CPA.
Schools (NCES district)
- District
- Miami-Dade
- NCES district ID
- 1200390
- Math proficiency
- 45% ▼ -16.00%
- Reading proficiency
- 54% ▼ -5.00%
- Median HH income
- $43,928
- Composite
- 41.76/100
- National rank
- #3397
- State rank
- #40 of 73 in FL
Livability — North Miami
- Score
- 83/100
- State rank
- #51
- US rank
- #914
Category grades
Schools grade is shown separately in the Schools card above.
Census & demographics
- Census place
- North Miami, FL
- County
- Miami-Dade County · 2,697,751 people
- City population
- 99,437
- Metro
- Miami-Fort Lauderdale-Pompano Beach, FL
- Population (ZIP)
- 54,814
- Household income
- $58,325
- Rent vs Own
- Severe rent burden
- 3226.0
Population outlook (Miami-Dade County) Hauer SSP2
- Today (2025)
- 3,126,439 people
- By 2030
- 3,325,765 · +6.4%
- By 2040
- 3,697,561 · +18.3%
- By 2050
- 4,012,134 · +28.3%
- By 2075
- 4,605,612 · +47.3%
- By 2100
- 4,866,598 · +55.7%
Race, ethnicity, and origin ACS 2023
- Neighborhood character
- Diverse neighborhood (Simpson 0.58)
- Race & ethnicity
- Black 56% Hispanic / Latino 31% Two or more races 18% White 8% Asian 2%
- Hispanic origin (detail)
- Puerto Rican 4% Cuban 7% Dominican 4% Salvadoran 1%
- Common ancestry
- Hispanic 35% Estonian 1% Lithuanian 1%
- Foreign-born
- 51% · Canada, Jamaica, Dominican Republic
- Languages at home
- 25% English-only · French/Haitian/Cajun 41% Spanish 30% Other Indo-European 2%
Political lean MEDSL · Miami-Dade
- 2024 margin
- R (+11.4) · D 43.9% · R 55.4%
- 2008→2024 swing
- -27.6pp toward R · 2008: 16.1pp · 2024: -11.4pp
- All cycles
- 2024: R+11.4 2020: D+7.3 2016: D+29.6 2012: D+23.7 2008: D+16.1
Not yet ingested
- Civics
- —
Market trends
- HPI YoY
- ▼ -492.86%
- Current HPI
- 630.6932
- Rent YoY
- ▼ -0.73%
- Metro
- Miami-Fort Lauderdale-Pompano Beach, FL
- State GDP YoY
- ▲ 3.28%
- F500 in state
- 36
Industry mix (Fortune 500 HQ in FL)
| Industry | F500 HQs | Revenue |
|---|---|---|
| Industrial Technology | 2 | $29B |
|
||
| Insurance | 2 | $17B |
|
||
| Retail | 1 | $60B |
|
||
| Technology Distribution | 1 | $58B |
|
||
| Homebuilding | 1 | $35B |
|
||
| Technology Manufacturing | 1 | $35B |
|
||
Price history
+504.3% since first listed21 events — show timeline
- 2026-05-16 Price Changed $139,000 MARMLS
- 2026-03-25 Price Changed $144,000 MARMLS
- 2026-02-09 Listed $149,000 MARMLS
- 2025-12-31 Listing Removed — MARMLS
- 2025-11-24 Price Changed $160,000 MARMLS
- 2025-08-28 Rental Removed $1,650 MARMLS
- 2025-06-24 Price Changed $168,000 MARMLS
- 2025-06-23 Price Changed $180,000 MARMLS
- 2025-06-13 Listed $168,000 MARMLS
- 2025-06-11 Price Changed $1,650 MARMLS
- 2025-05-20 Listed for Rent $1,700 MARMLS
- 2024-01-12 Rental Removed $1,600 MARMLS
- 2023-12-23 Price Changed $1,600 MARMLS
- 2023-11-30 Listed for Rent $1,700 MARMLS
- 2020-10-01 Sold (Public Records) $105,000 Public Records
- 2020-08-24 Sold (MLS) $105,000 MARMLS
- 2020-08-16 Listed $115,000 MARMLS
- 2007-02-17 Sold (Public Records) $96,500 Public Records
- 2000-11-21 Sold (Public Records) $26,000 Public Records
- 1979-06-01 Sold (Public Records) $26,000 Public Records
- 1972-11-01 Sold (Public Records) $23,000 Public Records
Property tax history
+9.8%/yrLatest (2025): $2,705 · -4.1% YoY. Source: county tax records.
Cash-flow waterfall
monthlySold comps — $/sqft
last 12 mo · ≤1 miLoading sold comps…