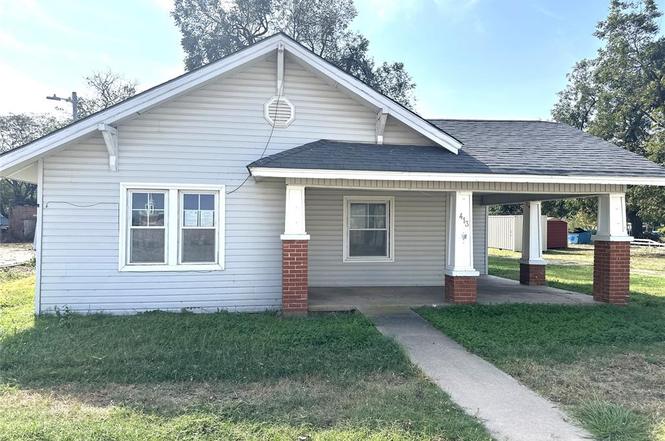
413 Main St · Maysville, OK
Flood risk 1/10 · Minimal
- FEMA flood zone
- X (unshaded)
- Chance of flooding over 30 yrs
- 0.0%
- Est. flood insurance / yr
- $507 – $1,088
Fire risk 5/10 · Moderate
- Est. fire insurance / yr
- $2,463 – $4,575
Heat risk 6/10 · Moderate
- Hot days now (above 109°F)
- 7 days/yr
- Hot days in 30 yrs
- 19 days/yr
Wind risk 3/10 · Minor
- Chance of severe wind over 30 yrs
- 7.0%
Air-quality risk 1/10 · Minimal
- Unhealthy air days now
- 0 days/yr
- Unhealthy air days in 30 yrs
- 0 days/yr
Risk factors via First Street. Map © Google.
Why this score? — see what drove the B+ grade
The composite is a weighted blend of 9 inputs, each scored 0–100. Each bar is that input's sub-score; the figure is the points it added to the 100-point composite (weight × sub-score).
- Cash flow +30.0/30.0
- 1% rule +10.0/10.0
- DSCR +10.0/10.0
- Appreciation +9.8/10.0
- ARV discount +7.5/15.0
- Livability +3.1/5.0
- Rent growth +2.5/5.0
- Condition / age +2.5/5.0
- Schools +1.8/10.0
$54,900
🖨 Deal sheet 📄 Offer letter ✓ Due diligence
Listing remarks
Charming craftsman-style home at 413 Main Street in Maysville, OK, featuring 2 bedrooms and 1 bathroom with a separate tub and shower. This inviting residence offers two living areas and two dining spaces, perfect for gatherings and everyday living. Enjoy the comfort of central heat and air, along with the convenience of two additional outbuildings. A spacious covered front porch provides an ideal spot to relax and enjoy the neighborhood. With thoughtful layout and classic architectural details, this home blends timeless style with functional living spaces.
Key facts
- Covered front porch
- Two dining spaces
- Central heat and air
Tags
Property features AI
Finance
- Other: Located in Maysville City addition; Directions: Main Street in Maysville
- Financial info: Sold as-is; REO / Bank owned; Assumable: No
- HOA & community: No mandatory association dues
Exterior
- Home design: Single family residence; One-level property; Existing property
- Construction: Frame construction; Composition roof; Conventional foundation; Built (year not provided)
- Exterior features: Covered porch; Outdoor storm shelter; Interior lot
Interior
- Bedrooms: 2 bedrooms
- Bathrooms: 1 full bathroom
- Heating & cooling: Electric heating
- Interior features: Two living areas; Two dining areas; No fireplace
Neighborhood map
What this means for you Summary
Snapshot
- This is a 2-bed/1.0-bath single-family listed at $55k.
Deal economics
- At list price, monthly cash flow is $444 ($5k/yr) — positive.
- The deal already cash-flows at list — no discount required.
- Meets the 1% rule at list price ($1k rent vs $55k).
- Recommended offer: $48k (12.0% below list) — sets the bar for market timing.
Location & tenants
- Location reads 61/100 on livability (#302 in OK) — a middle-class / working-renter tenant base. Strengths: cost of living A+, housing A+; Watch: amenities F, commute F, health & safety F.
- Maysville (rural): math 20% / reading 15% proficiency, ranked #442 of 513 in OK (top 86%) — low school quality limits family demand, transient renter base, plan for 1-2y turnover; 61% free/reduced lunch — lower-income household profile, screen leases tightly.
- Zoned schools: Maysville Es (math 8% / reading 17%, grade F, #652 of 845 statewide, top 79%, 254 students, 0% FRL); Maysville Hs (math 30% / reading 50%, grade F, #25 of 447 statewide, top 8%, 70 students, 0% FRL) — zoned schools average 0% FRL vs 61% district-wide (61 pts lower); this property's tenant base skews higher-income than the district average.
- Market conditions: 23 active listings in the ZIP; 1 units permitted in Garvin County in 2024 (0 in 5+ unit buildings).
Forward outlook
- In year one you build about $6k of equity ($380 loan paydown + $5k appreciation (9.6% local appreciation)).
- Garvin County population projected at +8% by 2050 — modest demand growth; plan on rents tracking national, not racing it.
- At projected returns (9.6% appreciation + 3.0% rent growth), your $15k cash investment doubles in ~2 years — after that, you're playing with house money.
- By year 6, paydown + projected appreciation supports a ~$33k cash-out refi (75% LTV) — recoverable capital for the next deal without selling this one.
Negotiation context
- It's been on market 204 days — a 12% lower offer ($48k) is reasonable based on typical stale-listing flexibility.
Risks & watch-outs
- Watch-outs: built in 1955 — expect roof / HVAC / electrical / plumbing capex.
- Climate carrying-cost: moderate wildfire risk; extreme-heat days projected 7→19/yr by 2055 (HVAC capex compounding) — expect insurance premiums to compound above CPI over the hold.
Questions for the listing agent
- It's been on market 204 days. Have you received any prior offers? Is the seller open to a 12% concession, seller financing, or rate buy-down credit?
- Built in 1955 — when were the roof, HVAC, electrical panel, plumbing, and water heater last replaced?
- Why hasn't it sold? Are there any deal-killer items the seller is aware of (foundation, flood, title, zoning, code violations)?
- Is there a deadline driving the sale (1031 exchange, divorce, estate, relocation)? That informs how much negotiation room exists.
- Schools are F-rated, which usually means shorter tenancies and higher turnover. Who's the typical renter profile here, and what's been the actual vacancy rate?
- What's the average days-on-market for RENTAL listings here right now (not sales)? A rising rental-DOM trend means longer vacancies and softer asking-rent achievability than the comps imply.
- What's the recent tenant-quality profile in this submarket — average credit score on applications, eviction rate, late-payment / NSF rate, and stable-employment percentage? A property-management company in the area should have these aggregated.
- How much new for-sale + rental construction is in the pipeline within 1–3 miles? Heavy new supply typically softens prices + rents 12–24 months out; constrained supply supports both.
Investment metrics
- 1% rule
- 1.90% ✓
- Cap rate
- 16.00%
- Cash-on-cash
- 34.69%
- DSCR
- 2.54
- GRM
- 4.4
CMA / ARV
- ARV (on-the-fly)
- $161,552
- Comps found
- 6
Show comp detail 6 sales within ~0.75 mi
| Address | Dist | Beds/Ba | Sqft | Sold | Price | $/sf | Match |
|---|---|---|---|---|---|---|---|
| 413 Main St | 0.00mi | 2/1.0 | 1,756 (0%) | 1mo | $50,000 | $28 | 99 |
| 104 Williams St | 0.27mi | 3/2.0 (+1) | 1,658 (-6%) | 7mo | $152,000 | $92 | 64 |
| 102 S Magers Ave | 0.44mi | 3/2.0 (+1) | 1,796 (+2%) | 7mo | $165,000 | $92 | 60 |
| 817 Park View Dr | 0.44mi | 2/1.0 | 1,550 (-12%) | 8mo | $103,000 | $66 | 54 |
| 105 4th St | 0.27mi | 3/2.0 (+1) | 1,522 (-13%) | 16mo | $90,000 | $59 | 43 |
| 806 North St | 0.49mi | 3/2.0 (+1) | 1,517 (-14%) | 20mo | $165,000 | $109 | 29 |
Match score weights: distance 35% · size 25% · config 20% · recency 20%. Top-matched comps best support the ARV.
Projected returns pro-forma
9.64% appreciation · 3.0% rent growth · sell at horizon
- IRR
- 50.4%
- Equity multiple
- 4.70×
- Total profit
- $56,871
- Equity at exit
- $48,028
- IRR
- 44.3%
- Equity multiple
- 10.43×
- Total profit
- $144,916
- Equity at exit
- $102,090
Cash invested: $15,372 (down + closing). Projections, not guarantees.
Landlord ↔ Tenant lean methodology
- Overall (STATE)
- 83 Strongly Landlord-Friendly
- State Oklahoma
- 83 Strongly Landlord-Friendly · R+20
- County
- — inherits STATE
- City
- — inherits STATE
ZIP-level market 73057
- Home prices YoY
- 4.2%
- Active inventory
- 23
- Price-to-rent
- 4.4×
Monthly cashflow live
- Estimated rent
- $1,043 medium interval (Pro) →
- Mortgage (P&I)
- −$288
- Tax est. 1.5%
- −$69 /mo · $824/yr
- Insurance
- −$23
- HOA
- −$0
- Vacancy / Maint / Mgmt
- −$219
- Net cashflow
- $444
Break-even live
UW: 25.0% down · 7.5% · 30yr · 1.5% tax · 5.0% vac · 8.0% maint · 8.0% mgmt
Financing live
Cash to close
- Down payment
- $13,725
- Closing costs
- $1,647
- Reserves months
- —
- Total cash needed
- —
Loan-product check · same deal, 3 products live
Conventional
25% down · 7.5% · 30yr
- Down + closing
- —
- Monthly P&I
- —
- Monthly cashflow
- —
- DSCR
- —
- Eligible?
- —
Personal DTI + credit; lowest rate.
DSCR
20% down · 8.5% · 30yr
- Down + closing
- —
- Monthly P&I
- —
- Monthly cashflow
- —
- DSCR
- —
- Eligible?
- —
No personal income docs; deal must DSCR.
Hard money
10% down · 12.0% · 12mo
- Down + closing
- —
- Monthly P&I
- —
- Monthly cashflow
- —
- DSCR
- —
- Eligible?
- —
Short-term bridge; refi at stabilization.
Listing history 7 events
-
2026-05-15status Pending
-
2026-04-21price $54,900
-
2026-03-09price $59,900
-
2026-02-02price $64,900
-
2025-12-31price $69,900
-
2025-12-01price $74,900
-
2025-10-23$79,900 Active
ⓘ Source: listings_history table (triggers on properties + properties_extension) + one-shot
backfill from property_details.listing_events for pre-trigger history.
Climate risk First Street
- Flood 1/10 Low FEMA zone X (unshaded) · 0% chance over 30 yrs
- Wildfire 5/10 Major
- Heat 6/10 Major 7 d/yr ≥109°F today · 19 d/yr by 30 yrs out
- Wind 3/10 Moderate 7% chance of damaging wind over 30 yrs
- Air quality 1/10 Low 0 unhealthy d/yr today · 0 by 30 yrs out
Nearby sold comps map
Loading sold comps map…
Walkable amenities ~0.75 mi
Loading nearby amenities…
Taxation est. · year 1
- Rental income
- $12,512
- − Mortgage interest
- −$3,075
- − Property taxes
- −$824
- − Insurance
- −$274
- − Repairs & maintenance
- −$1,001
- − Management
- −$1,001
- − Depreciation
- −$1,597
- Taxable income
- $4,740
- Est. tax owed @ 24.0%
- −$1,138
- After-tax cash flow
- $4,194/yr
For passive investors: Depreciation is non-cash, so a rental often shows a tax loss while cash-flowing — sheltering income. Rental losses are passive: they offset passive income freely, and up to $25,000/yr can offset ordinary (W-2) income if you actively participate and your MAGI is under $100k (phasing out to $0 by $150k); unused losses carry forward. On sale, claimed depreciation is recaptured at up to 25%, and gains may owe capital-gains tax (a 1031 exchange can defer both). Figures are a year-1 estimate at your 24.0% rate — not tax advice; consult a CPA.
Schools (NCES district)
- District
- Maysville
- NCES district ID
- 4019380
- Math proficiency
- 20% ▲ 10.00%
- Reading proficiency
- 15% ▼ -5.00%
- Median HH income
- $38,652
- Composite
- 18.11/100
- National rank
- #14076
- State rank
- #442 of 513 in OK
Livability — Maysville
- Score
- 61/100
- State rank
- #302
- US rank
- #17823
Category grades
Schools grade is shown separately in the Schools card above.
Census & demographics
- Census place
- Maysville, OK
- Population (ZIP)
- 2,210
Population outlook (Garvin County) Hauer SSP2
- Today (2025)
- 28,277 people
- By 2030
- 28,619 · +1.2%
- By 2040
- 29,478 · +4.2%
- By 2050
- 30,384 · +7.5%
- By 2075
- 34,074 · +20.5%
- By 2100
- 36,099 · +27.7%
Race, ethnicity, and origin ACS 2023
- Neighborhood character
- Predominantly White (79%)
- Race & ethnicity
- White 79% Two or more races 12% Native American 7% Hispanic / Latino 2%
- Common ancestry
- Lithuanian 8% European 3% Italian 2%
- Foreign-born
- 0%
- Languages at home
- 99% English-only · Spanish 1%
Political lean MEDSL · Garvin
- 2024 margin
- Solid R (+66.1) · D 16.4% · R 82.5% · Other 1.1%
- 2008→2024 swing
- -22.5pp toward R · 2008: -43.6pp · 2024: -66.1pp
- All cycles
- 2024: R+66.1 2020: R+64.2 2016: R+60.7 2012: R+46.1 2008: R+43.6
Not yet ingested
- Civics
- —
Market trends
- HPI YoY
- ▲ 9.64%
- Current HPI
- 240.7465
- Rent YoY
- —
- Metro
- —
- State GDP YoY
- ▲ 1.55%
- F500 in state
- 6
Industry mix (Fortune 500 HQ in OK)
| Industry | F500 HQs | Revenue |
|---|---|---|
| Energy | 3 | $48B |
|
||
Price history
-31.3% since first listed7 events — show timeline
- 2026-05-15 Pending — MLSOK
- 2026-04-21 Price Changed $54,900 MLSOK
- 2026-03-09 Price Changed $59,900 MLSOK
- 2026-02-02 Price Changed $64,900 MLSOK
- 2025-12-31 Price Changed $69,900 MLSOK
- 2025-12-01 Price Changed $74,900 MLSOK
- 2025-10-23 Listed $79,900 MLSOK
Cash-flow waterfall
monthlySold comps — $/sqft
last 12 mo · ≤1 miLoading sold comps…