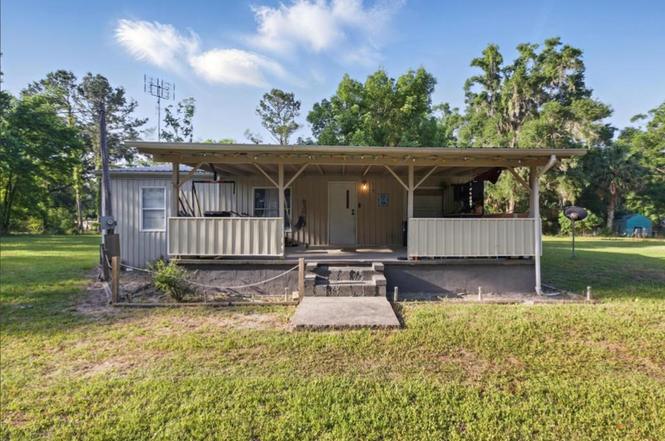
178 SE 154th Ave · Fanning Springs, FL
Flood risk 1/10 · Minimal
- FEMA flood zone
- X (unshaded)
- Chance of flooding over 30 yrs
- 0.0%
- Est. flood insurance / yr
- $507 – $1,088
Fire risk 5/10 · Moderate
- Est. fire insurance / yr
- $947 – $1,759
Heat risk 8/10 · Major
- Hot days now (above 107°F)
- 6 days/yr
- Hot days in 30 yrs
- 18 days/yr
Wind risk 9/10 · Severe
- Chance of severe wind over 30 yrs
- 99.0%
Air-quality risk 2/10 · Minimal
- Unhealthy air days now
- 1 days/yr
- Unhealthy air days in 30 yrs
- 2 days/yr
Risk factors via First Street. Map © Google.
Why this score? — see what drove the B grade
The composite is a weighted blend of 9 inputs, each scored 0–100. Each bar is that input's sub-score; the figure is the points it added to the 100-point composite (weight × sub-score).
- Cash flow +25.8/30.0
- Appreciation +10.0/10.0
- DSCR +8.6/10.0
- ARV discount +7.5/15.0
- 1% rule +6.0/10.0
- Schools +4.2/10.0
- Livability +3.2/5.0
- Rent growth +2.5/5.0
- Condition / age +2.5/5.0
$134,900
🖨 Deal sheet (PDF) 📄 Offer letter ✓ Due diligence
Listing remarks
Charming 3-Bed, 2-Bath Mobile Home on 1 Acre in Old Town, FL – Outdoor Lover's Paradise! Escape to the heart of North Florida with this well-maintained 3-bedroom, 2-bath mobile home nestled on a fully fenced 1-acre lot in Old Town. Just five minutes from the historic Suwannee River and only 20 minutes from the sparkling waters of the Gulf of America , this property offers the perfect blend of peaceful country living and outdoor adventure. Step inside to find an open floor plan with a comfortable living area, a functional kitchen with cabinetry, and a split-bedroom layout offering privacy for the whole family. The master suite features its own private bath, while two additional bedroo
Key facts
- Functional kitchen
- Open floor plan
- Room to park boat
Tags
Property features AI
Exterior
- Home design: Mobile home (residential); Sits on 1 acre
- Construction: Aluminum siding; Metal roof
- Exterior features: Covered porch/patio
Interior
- Kitchen: Refrigerator included
- Flooring: Laminate; Tile; Wood
- Bathrooms: 2 full bathrooms
- Interior features: Eat-in kitchen; 6 total rooms
Neighborhood map
What this means for you Summary
Snapshot
- This is a 3-bed/2.0-bath manufactured listed at $135k.
Deal economics
- At list price, monthly cash flow is $328 ($4k/yr) — positive.
- The deal already cash-flows at list — no discount required.
- Meets the 1% rule at list price ($1k rent vs $135k).
- Recommended offer: $119k (12.0% below list) — sets the bar for market timing.
- Cap rate 9.2% vs local median 3.7% in Fanning Springs — top-decile yield for the area; either an underpriced asset or a hidden risk that comps aren't pricing in. Stress-test before assuming the spread holds.
Location & tenants
- Location reads 63/100 on livability (#739 in FL) — a middle-class / working-renter tenant base. Strengths: crime A+, cost of living A+, housing A+; Watch: health & safety D, schools F, amenities F.
- Dixie (rural): math 52% / reading 50% proficiency, ranked #36 of 73 in FL (top 49%) — acceptable for families but not a draw, mixed tenant base, ~2y average lease; 85% free/reduced lunch — lower-income household profile, screen leases tightly.
- Market conditions: 262 active listings in the ZIP; 49 units permitted in Dixie County in 2024 (0 in 5+ unit buildings).
Forward outlook
- In year one you build about $14k of equity ($933 loan paydown + $13k appreciation (10.0% local appreciation)).
- Dixie County population projected at -16% by 2050 — secular population decline; favor cash flow + early exit over multi-decade hold.
- At projected returns (10.0% appreciation + 3.0% rent growth), your $38k cash investment doubles in ~2 years — after that, you're playing with house money.
- By year 3, paydown + projected appreciation supports a ~$37k cash-out refi (75% LTV) — recoverable capital for the next deal without selling this one.
Negotiation context
- It's been on market 405 days — a 12% lower offer ($119k) is reasonable based on typical stale-listing flexibility.
- 5 sale attempts since 8y ago with the ask held roughly flat each time — persistent listings suggest the price (not the market) is what's stuck; bring a comps-based counter.
- Current owner paid $15k; list at $135k implies a 799% gain — meaningful room to come down on a strong offer.
Risks & watch-outs
- Climate carrying-cost: severe wind risk, 99% chance of damaging wind over 30y; moderate wildfire risk; extreme-heat days projected 6→18/yr by 2055 (HVAC capex compounding) — expect insurance premiums to compound above CPI over the hold.
Questions for the listing agent
- It's been on market 405 days. Have you received any prior offers? Is the seller open to a 12% concession, seller financing, or rate buy-down credit?
- Why hasn't it sold? Are there any deal-killer items the seller is aware of (foundation, flood, title, zoning, code violations)?
- Is there a deadline driving the sale (1031 exchange, divorce, estate, relocation)? That informs how much negotiation room exists.
- Schools are F-rated, which usually means shorter tenancies and higher turnover. Who's the typical renter profile here, and what's been the actual vacancy rate?
- What's the average days-on-market for RENTAL listings here right now (not sales)? A rising rental-DOM trend means longer vacancies and softer asking-rent achievability than the comps imply.
- What's the recent tenant-quality profile in this submarket — average credit score on applications, eviction rate, late-payment / NSF rate, and stable-employment percentage? A property-management company in the area should have these aggregated.
- How much new for-sale + rental construction is in the pipeline within 1–3 miles? Heavy new supply typically softens prices + rents 12–24 months out; constrained supply supports both.
Investment metrics
- 1% rule
- 1.10% ✓
- Cap rate
- 9.21%
- Cash-on-cash
- 10.43%
- DSCR
- 1.46
- GRM
- 7.6
CMA / ARV
No comps found within radius.
Projected returns pro-forma
10.0% appreciation · 3.0% rent growth · sell at horizon
- IRR
- 31.9%
- Equity multiple
- 3.50×
- Total profit
- $94,340
- Equity at exit
- $121,529
- IRR
- 27.6%
- Equity multiple
- 7.92×
- Total profit
- $261,320
- Equity at exit
- $262,081
Cash invested: $37,772 (down + closing). Projections, not guarantees.
Landlord ↔ Tenant lean methodology
- Overall (STATE)
- 87 Strongly Landlord-Friendly
- State Florida
- 87 Strongly Landlord-Friendly · R+3
- County
- — inherits STATE
- City
- — inherits STATE
ZIP-level market 32680
- Home prices YoY
- 2.5%
- Active inventory
- 262
- Price-to-rent
- 7.6×
Monthly cashflow live
- Estimated rent
- $1,487 medium interval (Pro) →
- Mortgage (P&I)
- −$707
- Tax from tax record
- −$83 /mo · $995/yr
- Insurance
- −$56
- HOA
- −$0
- Vacancy / Maint / Mgmt
- −$312
- Net cashflow
- $328
Break-even live
Sensitivity live
| Price | -10% $405 | -5% $366 | +0% $328 | +5% $290 | +10% $252 |
|---|---|---|---|---|---|
| Rent | -10% $211 | -5% $269 | +0% $328 | +5% $387 | +10% $446 |
| Rate | -1.0pp $396 | -0.5pp $362 | base $328 | +0.5pp $293 | +1.0pp $258 |
UW: 25.0% down · 7.5% · 30yr · 1.5% tax · 5.0% vac · 8.0% maint · 8.0% mgmt
Financing live
Cash to close
- Down payment
- $33,725
- Closing costs
- $4,047
- Reserves months
- —
- Total cash needed
- —
Loan-product check · same deal, 3 products live
Conventional
25% down · 7.5% · 30yr
- Down + closing
- —
- Monthly P&I
- —
- Monthly cashflow
- —
- DSCR
- —
- Eligible?
- —
Personal DTI + credit; lowest rate.
DSCR
20% down · 8.5% · 30yr
- Down + closing
- —
- Monthly P&I
- —
- Monthly cashflow
- —
- DSCR
- —
- Eligible?
- —
No personal income docs; deal must DSCR.
Hard money
10% down · 12.0% · 12mo
- Down + closing
- —
- Monthly P&I
- —
- Monthly cashflow
- —
- DSCR
- —
- Eligible?
- —
Short-term bridge; refi at stabilization.
Listing history 26 events
-
2026-06-21days on market $134,900 Active 405 DOM
-
2026-06-18days on market $134,900 Active 403 DOM
-
2026-06-17days on market $134,900 Active 402 DOM
-
2026-06-16days on market $134,900 Active 401 DOM
-
2026-06-15days on market $134,900 Active 400 DOM
-
2026-06-13days on market $134,900 Active 398 DOM
-
2026-06-12days on market $134,900 Active 397 DOM
-
2026-06-09days on market $134,900 Active 394 DOM
-
2026-06-08days on market $134,900 Active 393 DOM
-
2026-06-07days on market $134,900 Active 392 DOM
-
2026-06-07days on market $134,900 Active 391 DOM
-
2026-06-04days on market $134,900 Active 388 DOM
-
2026-06-02days on market $134,900 Active 387 DOM
-
2026-06-01days on market $134,900 Active 386 DOM
-
2026-05-31days on market $134,900 Active 385 DOM
-
2026-05-31days on market $134,900 Active 384 DOM
-
2026-02-14status Active
-
2026-02-10status Pending
-
2025-07-01price $134,900
-
2025-05-08price $139,900
-
2025-05-08$134,900 Active
-
2023-08-05$139,900 Active
-
2023-03-13price $133,999
-
2023-01-17$139,900 Active
-
2018-05-11soldstatus $15,000
-
2018-04-04$21,900
ⓘ Source: listings_history table (triggers on properties + properties_extension) + one-shot
backfill from property_details.listing_events for pre-trigger history.
Tax reassessment forecast FL · Resets to sale price
- Current annual tax
- $995 · $83/mo
- Projected year-2 tax
- $1,120 · $93/mo
- Expected delta
- +$125/yr (+$10/mo · 12.6%)
ⓘ Screening estimate from a state-policy table — verify with the county assessor before closing.
Climate risk First Street
- Flood 1/10 Low FEMA zone X (unshaded) · 0% chance over 30 yrs
- Wildfire 5/10 Major
- Heat 8/10 Severe 6 d/yr ≥107°F today · 18 d/yr by 30 yrs out
- Wind 9/10 Extreme 99% chance of damaging wind over 30 yrs
- Air quality 2/10 Low 1 unhealthy d/yr today · 2 by 30 yrs out
Nearby sold comps map
Loading sold comps map…
Walkable amenities ~0.75 mi
Loading nearby amenities…
Taxation est. · year 1
- Rental income
- $17,843
- − Mortgage interest
- −$7,556
- − Property taxes
- −$995
- − Insurance
- −$674
- − Repairs & maintenance
- −$1,427
- − Management
- −$1,427
- − Depreciation
- −$3,924
- Taxable income
- $1,838
- Est. tax owed @ 24.0%
- −$441
- After-tax cash flow
- $3,497/yr
For passive investors: Depreciation is non-cash, so a rental often shows a tax loss while cash-flowing — sheltering income. Rental losses are passive: they offset passive income freely, and up to $25,000/yr can offset ordinary (W-2) income if you actively participate and your MAGI is under $100k (phasing out to $0 by $150k); unused losses carry forward. On sale, claimed depreciation is recaptured at up to 25%, and gains may owe capital-gains tax (a 1031 exchange can defer both). Figures are a year-1 estimate at your 24.0% rate — not tax advice; consult a CPA.
Schools (NCES district)
- District
- Dixie
- NCES district ID
- 1200450
- Math proficiency
- 52% ▼ -3.00%
- Reading proficiency
- 50% ▼ -4.00%
- Median HH income
- $34,799
- Composite
- 42.18/100
- National rank
- #3290
- State rank
- #36 of 73 in FL
Livability — Fanning Springs
- Score
- 63/100
- State rank
- #739
- US rank
- #15960
Category grades
Schools grade is shown separately in the Schools card above.
Census & demographics
- Population (ZIP)
- 10,445
Population outlook (Dixie County) Hauer SSP2
- Today (2025)
- 15,122 people
- By 2030
- 14,521 · -4.0%
- By 2040
- 13,503 · -10.7%
- By 2050
- 12,671 · -16.2%
- By 2075
- 10,857 · -28.2%
- By 2100
- 8,344 · -44.8%
Race, ethnicity, and origin ACS 2023
- Neighborhood character
- Predominantly White (94%)
- Race & ethnicity
- White 94% Two or more races 4% Hispanic / Latino 3% Black 1%
- Common ancestry
- Romanian 2% Slovak 1% Italian 1%
- Foreign-born
- 3% · Canada
- Languages at home
- 99% English-only · Spanish 1%
Political lean MEDSL · Dixie
- 2024 margin
- Solid R (+70.4) · D 14.5% · R 84.9%
- 2008→2024 swing
- -25.4pp toward R · 2008: -45.0pp · 2024: -70.4pp
- All cycles
- 2024: R+70.4 2020: R+66.0 2016: R+63.2 2012: R+46.9 2008: R+45.0
Not yet ingested
- Civics
- —
Market trends
- HPI YoY
- ▲ 10.22%
- Current HPI
- 424.0037
- Rent YoY
- —
- Metro
- —
- State GDP YoY
- ▲ 3.28%
- F500 in state
- 36
Industry mix (Fortune 500 HQ in FL)
| Industry | F500 HQs | Revenue |
|---|---|---|
| Industrial Technology | 2 | $29B |
|
||
| Insurance | 2 | $17B |
|
||
| Retail | 1 | $60B |
|
||
| Technology Distribution | 1 | $58B |
|
||
| Homebuilding | 1 | $35B |
|
||
| Technology Manufacturing | 1 | $35B |
|
||
Price history
+516.0% since first listed10 events — show timeline
- 2026-02-14 Relisted — DGLMLS
- 2026-02-10 Pending — DGLMLS
- 2025-07-01 Price Changed $134,900 DGLMLS
- 2025-05-08 Price Changed $139,900 DGLMLS
- 2025-05-08 Listed $134,900 DGLMLS
- 2023-08-05 Listed $139,900 DGLMLS
- 2023-03-13 Price Changed $133,999 DGLMLS
- 2023-01-17 Listed $139,900 DGLMLS
- 2018-05-11 Sold (MLS) $15,000 DGLMLS
- 2018-04-04 Listed $21,900 DGLMLS
Property tax history
+47.3%/yrLatest (2025): $995 · +15.3% YoY. Source: county tax records.
Cash-flow waterfall
monthlySold comps — $/sqft
last 12 mo · ≤1 miLoading sold comps…