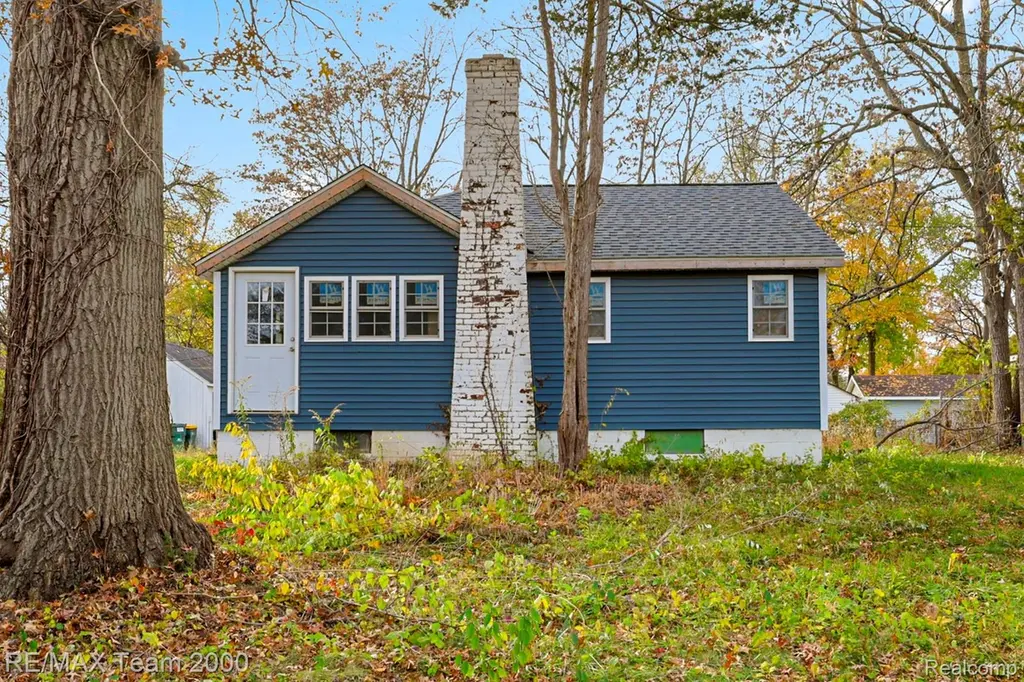
14060 Martinsville Rd · Van Buren, MI
Flood risk 1/10 · Minimal
- FEMA flood zone
- X (unshaded)
- Chance of flooding over 30 yrs
- 0.0%
- Est. flood insurance / yr
- $473 – $860
Fire risk 3/10 · Minor
- Est. fire insurance / yr
- $784 – $1,456
Heat risk 3/10 · Minor
- Hot days now (above 98°F)
- 7 days/yr
- Hot days in 30 yrs
- 15 days/yr
Wind risk 2/10 · Minimal
- Chance of severe wind over 30 yrs
- —
Air-quality risk 2/10 · Minimal
- Unhealthy air days now
- 1 days/yr
- Unhealthy air days in 30 yrs
- 2 days/yr
Risk factors via First Street. Map © Google.
Why this score? — see what drove the B- grade
The composite is a weighted blend of 9 inputs, each scored 0–100. Each bar is that input's sub-score; the figure is the points it added to the 100-point composite (weight × sub-score).
- Cash flow +30.0/30.0
- 1% rule +10.0/10.0
- DSCR +10.0/10.0
- ARV discount +7.5/15.0
- Rent growth +3.4/5.0
- Schools +3.3/10.0
- Livability +2.5/5.0
- Condition / age +2.5/5.0
- Appreciation +0.0/10.0
$64,900
🖨 Deal sheet 📄 Offer letter ✓ Due diligence
Listing remarks
Amazing opportunity on this 2 bedroom ranch. You'll love the privacy of your lot, coupled with unbeatable access—less than a mile to all-sports Belleville Lake and just minutes to the shops and dining of downtown Belleville. Benefit from the 220V garage electrical service. This one is awaiting your finishing touches! Sold as is. Buyer and agent to verify all information.
Key facts
- Privacy of your lot
- 0.4 acre lot
- Garage
Tags
Neighborhood map
What this means for you Summary
Snapshot
- This is a 2-bed/1.0-bath single-family listed at $65k.
Deal economics
- At list price, monthly cash flow is $445 ($5k/yr) — positive.
- The deal already cash-flows at list — no discount required.
- Meets the 1% rule at list price ($1k rent vs $65k).
- Recommended offer: $57k (12.0% below list) — sets the bar for market timing.
Location & tenants
- Location reads: area grade B — affects rentability + tenant quality, not the cash-flow math above.
- Van Buren Public Schools (suburban): math 33% / reading 43% proficiency, ranked #228 of 540 in MI (top 42%) — families likely to look elsewhere, expect single-tenant / working-renter base with shorter leases.
- Market conditions: Rents rising (+3.6%/yr); 216 active listings in the ZIP; 2 comparable units currently listed for rent nearby; solid renter incomes; 2,639 units permitted in Wayne County in 2024 (1,216 in 5+ unit buildings).
- This rent is only 18% of the median local income ($77k/yr) — well below the 30% rent-burden line; pricing power to push rent on renewal without tenant pushback.
Forward outlook
- Local home prices are declining (-3.0%/yr); year-one equity from $449 of loan paydown is wiped out by about $2k of value loss. Plan a longer hold.
- Wayne County population projected at -17% by 2050 — secular population decline; favor cash flow + early exit over multi-decade hold.
- At projected returns (-3.0% appreciation + 3.6% rent growth), your $18k cash investment doubles in ~5 years — after that, you're playing with house money.
Negotiation context
- It's been on market 142 days — a 12% lower offer ($57k) is reasonable based on typical stale-listing flexibility.
- 13 sale attempts since 18y ago; this cycle's ask has dropped $55k (46%) from the opening price — seller is motivated, your offer sets the floor, not the list.
- Current owner paid $48k; 36% above their basis — modest negotiation headroom, anchor on the comps not their cost.
Risks & watch-outs
- Watch-outs: built in 1940 — expect roof / HVAC / electrical / plumbing capex.
Questions for the listing agent
- It's been on market 142 days. Have you received any prior offers? Is the seller open to a 12% concession, seller financing, or rate buy-down credit?
- Built in 1940 — when were the roof, HVAC, electrical panel, plumbing, and water heater last replaced?
- Why hasn't it sold? Are there any deal-killer items the seller is aware of (foundation, flood, title, zoning, code violations)?
- Is there a deadline driving the sale (1031 exchange, divorce, estate, relocation)? That informs how much negotiation room exists.
- What's the average days-on-market for RENTAL listings here right now (not sales)? A rising rental-DOM trend means longer vacancies and softer asking-rent achievability than the comps imply.
- What's the recent tenant-quality profile in this submarket — average credit score on applications, eviction rate, late-payment / NSF rate, and stable-employment percentage? A property-management company in the area should have these aggregated.
- How much new for-sale + rental construction is in the pipeline within 1–3 miles? Heavy new supply typically softens prices + rents 12–24 months out; constrained supply supports both.
Investment metrics
- 1% rule
- 1.74% ✓
- Cap rate
- 14.52%
- Cash-on-cash
- 29.40%
- DSCR
- 2.31
- GRM
- 4.8
CMA / ARV
- ARV (median comp)
- $177,820
- List price
- $64,900
- Delta
- -63.50%
- Verdict
- UNDERPRICED
- Comps
- 3 within 1.0 mi
Projected returns pro-forma
-3.0% appreciation · 3.64% rent growth · sell at horizon
- IRR
- 24.6%
- Equity multiple
- 2.02×
- Total profit
- $18,580
- Equity at exit
- $9,677
- IRR
- 32.8%
- Equity multiple
- 4.07×
- Total profit
- $55,782
- Equity at exit
- $5,611
Cash invested: $18,172 (down + closing). Projections, not guarantees.
Landlord ↔ Tenant lean methodology
- Overall (STATE)
- 62 Landlord-Friendly
- State Michigan
- 62 Landlord-Friendly · EVEN
- County
- — inherits STATE
- City
- — inherits STATE
ZIP-level market 48111
- Rents YoY
- 3.6%
- Active inventory
- 216
- Price-to-rent
- 4.8×
Monthly cashflow live
- Estimated rent
- $1,127 medium interval (Pro) →
- Mortgage (P&I)
- −$340
- Tax from tax record
- −$78 /mo · $932/yr
- Insurance
- −$27
- HOA
- −$0
- Vacancy / Maint / Mgmt
- −$237
- Net cashflow
- $445
Break-even live
UW: 25.0% down · 7.5% · 30yr · 1.5% tax · 5.0% vac · 8.0% maint · 8.0% mgmt
Financing live
Cash to close
- Down payment
- $16,225
- Closing costs
- $1,947
- Reserves months
- —
- Total cash needed
- —
Loan-product check · same deal, 3 products live
Conventional
25% down · 7.5% · 30yr
- Down + closing
- —
- Monthly P&I
- —
- Monthly cashflow
- —
- DSCR
- —
- Eligible?
- —
Personal DTI + credit; lowest rate.
DSCR
20% down · 8.5% · 30yr
- Down + closing
- —
- Monthly P&I
- —
- Monthly cashflow
- —
- DSCR
- —
- Eligible?
- —
No personal income docs; deal must DSCR.
Hard money
10% down · 12.0% · 12mo
- Down + closing
- —
- Monthly P&I
- —
- Monthly cashflow
- —
- DSCR
- —
- Eligible?
- —
Short-term bridge; refi at stabilization.
Rent comps 2 comps
| Address | Beds | Baths | Sqft | Rent | $/sqft | DOM | Units | Dist |
|---|---|---|---|---|---|---|---|---|
| 500 N Liberty St Apt 19 Belleville, MI | 1.0 | 1.0 | 680 | $900 | $1.32 | 44d | 1 | 1.39mi |
| 500 N Liberty St Unit 11 Belleville, MI | 1.0 | 1.0 | 680 | $900 | $1.32 | 24d | 1 | 1.39mi |
Listing history 50 events
-
2026-06-18days on market $64,900 Active 142 DOM
-
2026-06-17days on market $64,900 Active 141 DOM
-
2026-06-16days on market $64,900 Active 140 DOM
-
2026-06-15days on market $64,900 Active 139 DOM
-
2026-06-13days on market $64,900 Active 137 DOM
-
2026-06-09days on market $64,900 Active 133 DOM
-
2026-06-08days on market $64,900 Active 132 DOM
-
2026-06-07days on market $64,900 Active 131 DOM
-
2026-06-04days on market $64,900 Active 128 DOM
-
2026-06-03days on market $64,900 Active 127 DOM
-
2026-06-02days on market $64,900 Active 126 DOM
-
2026-06-01days on market $64,900 Active 125 DOM
-
2026-05-31days on market $64,900 Active 124 DOM
-
2026-05-18historical
-
2026-04-25price $74,900
-
2026-04-24price $74,900
-
2026-04-08status Active
-
2026-04-08status Active
-
2026-03-03historical
-
2026-02-25price $99,900
-
2026-02-24price $99,900
-
2026-01-15price $109,900
-
2026-01-14price $109,900
-
2025-12-11price $114,900
-
2025-12-11price $114,900
-
2025-11-10$119,900 Active
-
2025-11-09$119,900 Active
-
2014-10-30soldstatus $47,700
-
2014-09-20soldstatus $47,700
-
2014-09-20soldstatus $47,700
-
2014-06-25historical
-
2014-06-20$45,000
-
2014-06-20$45,000
-
2014-04-22historical
-
2014-04-22historical
-
2013-11-09$46,500
-
2013-11-09$46,500
-
2009-04-09soldstatus $37,100
-
2009-03-10soldstatus $37,100
-
2009-03-10soldstatus $37,100
-
2009-03-10soldstatus $37,100
-
2009-03-10soldstatus $37,100
-
2009-03-10soldstatus $37,100
-
2008-12-09historical
-
2008-12-09historical
-
2008-09-23$38,000
-
2008-09-23$38,000
-
2008-09-23$38,000
-
2008-09-23$38,000
-
2008-09-23$38,000
ⓘ Source: listings_history table (triggers on properties + properties_extension) + one-shot
backfill from property_details.listing_events for pre-trigger history.
Tax reassessment forecast MI · Partial reset (capped growth)
- Current annual tax
- $932 · $78/mo
- Projected year-2 tax
- $966 · $80/mo
- Expected delta
- +$34/yr (+$3/mo · 3.6%)
ⓘ Screening estimate from a state-policy table — verify with the county assessor before closing.
Climate risk First Street
- Flood 1/10 Low FEMA zone X (unshaded) · 0% chance over 30 yrs
- Wildfire 3/10 Moderate
- Heat 3/10 Moderate 7 d/yr ≥98°F today · 15 d/yr by 30 yrs out
- Wind 2/10 Low
- Air quality 2/10 Low 1 unhealthy d/yr today · 2 by 30 yrs out
Nearby sold comps map
Loading sold comps map…
Walkable amenities ~0.75 mi
Loading nearby amenities…
Taxation est. · year 1
- Rental income
- $13,522
- − Mortgage interest
- −$3,635
- − Property taxes
- −$932
- − Insurance
- −$324
- − Repairs & maintenance
- −$1,082
- − Management
- −$1,082
- − Depreciation
- −$1,888
- Taxable income
- $4,578
- Est. tax owed @ 24.0%
- −$1,099
- After-tax cash flow
- $4,243/yr
For passive investors: Depreciation is non-cash, so a rental often shows a tax loss while cash-flowing — sheltering income. Rental losses are passive: they offset passive income freely, and up to $25,000/yr can offset ordinary (W-2) income if you actively participate and your MAGI is under $100k (phasing out to $0 by $150k); unused losses carry forward. On sale, claimed depreciation is recaptured at up to 25%, and gains may owe capital-gains tax (a 1031 exchange can defer both). Figures are a year-1 estimate at your 24.0% rate — not tax advice; consult a CPA.
Schools (NCES district)
- District
- Van Buren Public Schools
- NCES district ID
- 2634560
- Math proficiency
- 33% ▲ 6.00%
- Reading proficiency
- 43% ▲ 6.00%
- Median HH income
- $54,166
- Composite
- 33.2/100
- National rank
- #5533
- State rank
- #228 of 540 in MI
Livability — Van Buren
No livability data for this city. (Only ~50 U.S. cities are tracked.)
Census & demographics
- County
- Wayne County · 1,562,939 people
- Metro
- Detroit-Warren-Dearborn, MI
- Population (ZIP)
- 44,709
- Household income
- $76,595
- Rent vs Own
- Severe rent burden
- 1200.0
Population outlook (Wayne County) Hauer SSP2
- Today (2025)
- 1,675,273 people
- By 2030
- 1,620,300 · -3.3%
- By 2040
- 1,502,341 · -10.3%
- By 2050
- 1,384,039 · -17.4%
- By 2075
- 1,124,592 · -32.9%
- By 2100
- 881,193 · -47.4%
Race, ethnicity, and origin ACS 2023
- Neighborhood character
- Predominantly White (66%)
- Race & ethnicity
- White 66% Black 22% Two or more races 7% Hispanic / Latino 4% Asian 2%
- Common ancestry
- Romanian 8% Lithuanian 3% Slovak 3%
- Foreign-born
- 4% · Canada
- Languages at home
- 95% English-only · Spanish 1% Other Indo-European 1% Arabic 1%
Political lean MEDSL · Wayne
- 2024 margin
- Strong D (+29.0) · D 62.7% · R 33.7% · Other 3.6%
- 2008→2024 swing
- -20.5pp toward R · 2008: 49.5pp · 2024: 29.0pp
- All cycles
- 2024: D+29.0 2020: D+38.1 2016: D+37.3 2012: D+46.9 2008: D+49.5
Not yet ingested
- Civics
- —
Market trends
- HPI YoY
- ▼ -238.11%
- Current HPI
- 236.4458
- Rent YoY
- ▲ 3.64%
- Metro
- Detroit-Warren-Dearborn, MI
- State GDP YoY
- ▲ 1.37%
- F500 in state
- 28
Industry mix (Fortune 500 HQ in MI)
| Industry | F500 HQs | Revenue |
|---|---|---|
| Automotive Parts | 3 | $48B |
|
||
| Automotive | 2 | $372B |
|
||
| Chemicals | 1 | $45B |
|
||
| Automotive Retail | 1 | $29B |
|
||
| Healthcare / Medical Devices | 1 | $23B |
|
||
| Automotive Technology | 1 | $20B |
|
||
Price history
+97.1% since first listed37 events — show timeline
- 2026-05-18 Listing Removed — MiRealSource-MiMLS
- 2026-04-25 Price Changed $74,900 MiRealSource-MiMLS
- 2026-04-24 Price Changed $74,900 REALCOMP
- 2026-04-08 Relisted — REALCOMP
- 2026-04-08 Relisted — MiRealSource-MiMLS
- 2026-03-03 Listing Removed — MiRealSource-MiMLS
- 2026-02-25 Price Changed $99,900 MiRealSource-MiMLS
- 2026-02-24 Price Changed $99,900 REALCOMP
- 2026-01-15 Price Changed $109,900 MiRealSource-MiMLS
- 2026-01-14 Price Changed $109,900 REALCOMP
- 2025-12-11 Price Changed $114,900 MiRealSource-MiMLS
- 2025-12-11 Price Changed $114,900 REALCOMP
- 2025-11-10 Listed $119,900 REALCOMP
- 2025-11-09 Listed $119,900 MiRealSource-MiMLS
- 2014-10-30 Sold (Public Records) $47,700 Public Records
- 2014-09-20 Sold (MLS) $47,700 REALCOMP
- 2014-09-20 Sold (MLS) $47,700 MiRealSource-MiMLS
- 2014-06-25 Listing Removed — MiRealSource-MiMLS
- 2014-06-20 Listed $45,000 REALCOMP
- 2014-06-20 Listed $45,000 MiRealSource-MiMLS
- 2014-04-22 Listing Removed — REALCOMP
- 2014-04-22 Listing Removed — MiRealSource-MiMLS
- 2013-11-09 Listed $46,500 REALCOMP
- 2013-11-09 Listed $46,500 MiRealSource-MiMLS
- 2009-04-09 Sold (Public Records) $37,100 Public Records
- 2009-03-10 Sold (MLS) $37,100 SW Michigan MLS
- 2009-03-10 Sold (MLS) $37,100 REALCOMP
- 2009-03-10 Sold (MLS) $37,100 MiRealSource-MiMLS
- 2009-03-10 Sold (MLS) $37,100 AAMLS
- 2009-03-10 Sold (MLS) $37,100 MiRealSource-MiMLS
- 2008-12-09 Listing Removed — MiRealSource-MiMLS
- 2008-12-09 Delisted — AAMLS
- 2008-09-23 Listed $38,000 SW Michigan MLS
- 2008-09-23 Listed $38,000 REALCOMP
- 2008-09-23 Listed $38,000 MiRealSource-MiMLS
- 2008-09-23 Listed $38,000 AAMLS
- 2008-09-23 Listed $38,000 MiRealSource-MiMLS
Property tax history
-3.2%/yrLatest (2025): $932 · +3.0% YoY. Source: county tax records.
Cash-flow waterfall
monthlySold comps — $/sqft
last 12 mo · ≤1 miLoading sold comps…