 Triplex
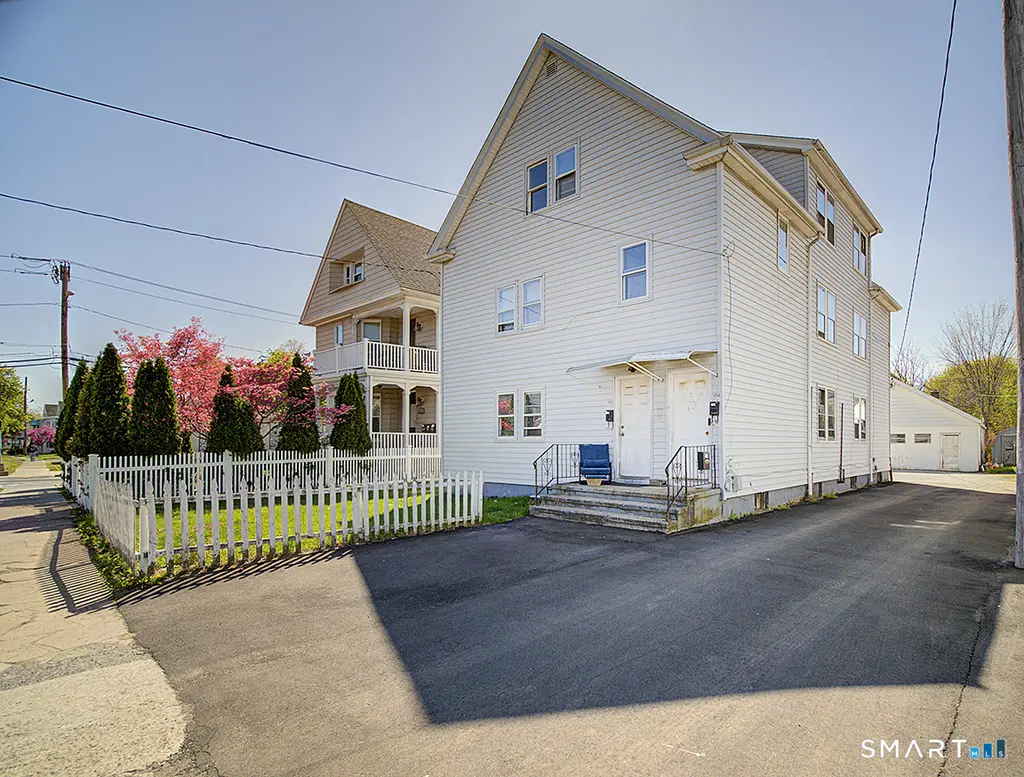
1052 Dixwell Ave · New Haven, CT
Flood risk No data
- FEMA flood zone
- —
- Chance of flooding over 30 yrs
- —
- Est. flood insurance / yr
- —
Fire risk No data
- Est. fire insurance / yr
- —
Heat risk No data
- Hot days now (above threshold)
- —
- Hot days in 30 yrs
- —
Wind risk No data
- Chance of severe wind over 30 yrs
- —
Air-quality risk No data
- Unhealthy air days now
- —
- Unhealthy air days in 30 yrs
- —
Risk factors via First Street. Map © Google.
Why this score? — see what drove the D grade
The composite is a weighted blend of 9 inputs, each scored 0–100. Each bar is that input's sub-score; the figure is the points it added to the 100-point composite (weight × sub-score).
- Cash flow +19.4/30.0
- DSCR +6.1/10.0
- 1% rule +5.2/10.0
- Livability +4.0/5.0
- Rent growth +3.7/5.0
- Schools +3.3/10.0
- Condition / age +2.2/5.0
- ARV discount +0.0/15.0
- Appreciation +0.0/10.0
$650,000
🖨 Deal sheet (PDF) 📄 Offer letter ✓ Due diligence
Multi-family units
County records classify this as Multi-Family (2-4 Unit). Listing-text estimate: 3 units. confirmed
Listing remarks
3 Family & Commercial building with approximately 2000 square feet on the first floor. (Former Hamden Press). Attention Investors, Flippers, Contractor's, Landscaper's etc. Incredible opportunity to own a mixed use parcel within the T-4 zone which has several Commercial opportunities. In the 3 Family house each floor contains 5 rooms, 3 Bedrooms and one bath. Separate utilities with 3 electric meters, 3 gas meters. Needs some updating but well worth the effort as rents are well below market value!! The rear building is approximately 42' x 48' on the main level and has opportunity for additional space in the walk-up loft/attic area. High traffic count on Dixwell Avenue.
Key facts
- Separate utilities
- T-4 zone
- Mixed use parcel
Tags
Property features AI
Exterior
- Parking: Driveway and off-street parking; 6 parking spaces
- Utilities: Public water connected; Public sewer connected; Natural gas hot water
- Home design: Multi-family property (3-family)
- Construction: Frame construction; Vinyl siding; Asphalt shingle roof; Concrete and stone foundation; Built for multi-family use
- Exterior features: Level lot; Paved, asphalt and gravel driveway
Interior
- Bedrooms: 9 bedrooms total
- Bathrooms: 3 full bathrooms
- Heating & cooling: Hot water heat; Oil-fired hot water; Hot water tank/heat equipment located in basement
- Interior features: 15 total rooms; Full, unfinished basement; Has attic with access via hatch; 3 units (multi-family)
Neighborhood map
What this means for you Summary
Snapshot
- This is a 3 × 3-bed/1-bath units multifamily listed at $650k. Condition is rated fair.
Deal economics
- At list price, monthly cash flow is $721 ($9k/yr) — positive. Per door: $240/mo.
- The deal already cash-flows at list — no discount required.
- Meets the 1% rule at list price ($7k rent vs $650k).
- Recommended offer: $630k (3.0% below list) — sets the bar for market timing.
- Cap rate 7.6% vs local median 4.9% in New Haven — top-decile yield for the area; either an underpriced asset or a hidden risk that comps aren't pricing in. Stress-test before assuming the spread holds.
Location & tenants
- Location reads 79/100 on livability (#31 in CT, #2,190 nationally) — a middle-class / working-renter tenant base. Strengths: amenities A+, commute A+, health & safety A+; Watch: employment D, crime F.
- Hamden School District (suburban): math 30% / reading 43% proficiency, ranked #106 of 153 in CT (top 69%) — families likely to look elsewhere, expect single-tenant / working-renter base with shorter leases.
- Zoned schools: Hamden Middle School (math 27% / reading 43%, grade F, #123 of 175 statewide, top 70%, 811 students, 40% FRL); Hamden High School (math 21% / reading 44%, grade F, #125 of 194 statewide, top 66%, 1,672 students, 39% FRL).
- Market conditions: Rents rising fast (+4.6%/yr); 104 active listings in the ZIP; solid renter incomes; 1,059 units permitted in South Central Connecticut Planning Region in 2024 (779 in 5+ unit buildings).
- At $6,599/mo this rent would consume 89% of the median local household income ($89k/yr) (locally 1228% of renters already pay >50% of income on rent) — very limited rent-growth headroom before tenants either downsize or default.
Forward outlook
- Local home prices are declining (-3.0%/yr); year-one equity from $4k of loan paydown is wiped out by about $20k of value loss. Plan a longer hold.
Negotiation context
- It's been on market 54 days — a 3% lower offer ($630k) is reasonable based on typical stale-listing flexibility.
Risks & watch-outs
- Watch-outs: built in 1925 — expect roof / HVAC / electrical / plumbing capex.
Questions for the listing agent
- It's been on market 54 days. Have you received any prior offers? Is the seller open to a 3% concession, seller financing, or rate buy-down credit?
- Can we see the unit-by-unit rent roll, current vacancy, and any below-market leases? What's the average tenancy length?
- What capital expenditures (roof, boiler, parking lot, exteriors) have been made in the last 5 years, and what's planned in the next 2?
- Have any recent inspections been done? Can we get a copy of the seller's disclosures and any deferred-maintenance estimates?
- Built in 1925 — when were the roof, HVAC, electrical panel, plumbing, and water heater last replaced?
- Is there a deadline driving the sale (1031 exchange, divorce, estate, relocation)? That informs how much negotiation room exists.
- Schools are D-rated, which usually means shorter tenancies and higher turnover. Who's the typical renter profile here, and what's been the actual vacancy rate?
- Crime grade is F in this area — have there been break-ins, vandalism, or insurance claims at this property in the last 3 years? What carrier currently insures it and at what premium?
- The area grade is low — what's the realistic commute time and amenity access for the typical tenant pool here? Any planned neighborhood developments (good or bad) we should know about?
- What's the average days-on-market for RENTAL listings here right now (not sales)? A rising rental-DOM trend means longer vacancies and softer asking-rent achievability than the comps imply.
- What's the recent tenant-quality profile in this submarket — average credit score on applications, eviction rate, late-payment / NSF rate, and stable-employment percentage? A property-management company in the area should have these aggregated.
- How much new apartment / multifamily construction is in the pipeline within 1–3 miles? Heavy new supply (>2% of stock underway) typically softens rents 12–24 months out; light construction supports rent growth.
Investment metrics
- 1% rule
- 1.02% ✓
- Cap rate
- 7.62%
- Cash-on-cash
- 4.76%
- DSCR
- 1.21
- GRM
- 8.2
CMA / ARV
- ARV (median comp)
- $516,862
- List price
- $650,000
- Delta
- 25.76%
- Verdict
- OVERPRICED
- Comps
- 20 within 1.0 mi
Show comp detail 4 sales within ~0.75 mi
| Address | Dist | Beds/Ba | Sqft | Sold | Price | $/sf | Match |
|---|---|---|---|---|---|---|---|
| 91 1st St | 0.17mi | 8/3.0 (-1) | 3,220 (0%) | 5mo | $510,000 | $158 | 83 |
| 188 Butler St | 0.57mi | 9/4.0 | 3,178 (-1%) | 12mo | $630,000 | $198 | 57 |
| 393 Newhall St | 0.68mi | 8/3.0 (-1) | 2,831 (-12%) | 9mo | $493,000 | $174 | 36 |
| 74 Read St | 0.74mi | 9/3.0 | 3,654 (+14%) | 19mo | $452,500 | $124 | 27 |
Match score weights: distance 35% · size 25% · config 20% · recency 20%. Top-matched comps best support the ARV.
Projected returns pro-forma
-3.0% appreciation · 4.61% rent growth · sell at horizon
- IRR
- -7.1%
- Equity multiple
- 0.73×
- Total profit
- $-48,434
- Equity at exit
- $96,917
- IRR
- 4.4%
- Equity multiple
- 1.35×
- Total profit
- $63,434
- Equity at exit
- $56,200
Cash invested: $182,000 (down + closing). Projections, not guarantees.
Landlord ↔ Tenant lean methodology
- Overall (STATE)
- 27 Tenant-Leaning
- State Connecticut
- 27 Tenant-Leaning · D+7
- County
- — inherits STATE
- City
- — inherits STATE
ZIP-level market 06514
- Rents YoY
- 4.6%
- Active inventory
- 104
- Price-to-rent
- 24.6×
Monthly cashflow live
- Estimated rent
- $6,599 high interval (Pro) →
- Mortgage (P&I)
- −$3,409
- Tax est. 1.5%
- −$812 /mo · $9,750/yr
- Insurance
- −$271
- HOA
- −$0
- Vacancy / Maint / Mgmt
- −$1,386
- Net cashflow
- $721
Break-even live
Sensitivity live
| Price | -10% $1,170 | -5% $946 | +0% $721 | +5% $497 | +10% $272 |
|---|---|---|---|---|---|
| Rent | -10% $200 | -5% $461 | +0% $721 | +5% $982 | +10% $1,243 |
| Rate | -1.0pp $1,049 | -0.5pp $887 | base $721 | +0.5pp $553 | +1.0pp $381 |
3-unit breakdown (identical units grouped — click to expand)
| Units | Beds | Baths | Est. rent |
|---|---|---|---|
| 3× units | 3 | 1 | $6,600 |
| #1 | 3 | 1 | $2,200 |
| #2 | 3 | 1 | $2,200 |
| #3 | 3 | 1 | $2,200 |
| Total (3 units) | $6,599 | ||
UW: 25.0% down · 7.5% · 30yr · 1.5% tax · 5.0% vac · 8.0% maint · 8.0% mgmt
Financing live
Cash to close
- Down payment
- $162,500
- Closing costs
- $19,500
- Reserves months
- —
- Total cash needed
- —
Loan-product check · same deal, 3 products live
Conventional
25% down · 7.5% · 30yr
- Down + closing
- —
- Monthly P&I
- —
- Monthly cashflow
- —
- DSCR
- —
- Eligible?
- —
Personal DTI + credit; lowest rate.
DSCR
20% down · 8.5% · 30yr
- Down + closing
- —
- Monthly P&I
- —
- Monthly cashflow
- —
- DSCR
- —
- Eligible?
- —
No personal income docs; deal must DSCR.
Hard money
10% down · 12.0% · 12mo
- Down + closing
- —
- Monthly P&I
- —
- Monthly cashflow
- —
- DSCR
- —
- Eligible?
- —
Short-term bridge; refi at stabilization.
Listing history 17 events
-
2026-06-21days on market $650,000 Active 54 DOM
-
2026-06-18days on market $650,000 Active 51 DOM
-
2026-06-17days on market $650,000 Active 50 DOM
-
2026-06-16days on market $650,000 Active 49 DOM
-
2026-06-15days on market $650,000 Active 48 DOM
-
2026-06-14days on market $650,000 Active 46 DOM
-
2026-06-13days on market $650,000 Active 45 DOM
-
2026-06-10days on market $650,000 Active 43 DOM
-
2026-06-09days on market $650,000 Active 42 DOM
-
2026-06-08days on market $650,000 Active 41 DOM
-
2026-06-07days on market $650,000 Active 40 DOM
-
2026-06-05days on market $650,000 Active 37 DOM
-
2026-06-03days on market $650,000 Active 36 DOM
-
2026-06-03days on market $650,000 Active 35 DOM
-
2026-06-01days on market $650,000 Active 34 DOM
-
2026-05-31days on market $650,000 Active 33 DOM
-
2026-04-28$650,000 Active 681-char remark
ⓘ Source: listings_history table (triggers on properties + properties_extension) + one-shot
backfill from property_details.listing_events for pre-trigger history.
Nearby sold comps map
Loading sold comps map…
Walkable amenities ~0.75 mi
Loading nearby amenities…
Taxation est. · year 1
- Rental income
- $79,188
- − Mortgage interest
- −$36,410
- − Property taxes
- −$9,750
- − Insurance
- −$3,250
- − Repairs & maintenance
- −$6,335
- − Management
- −$6,335
- − Depreciation
- −$18,909
- Taxable loss
- −$1,801
- Est. tax savings @ 24.0%
- +$432
- After-tax cash flow
- $9,087/yr
For passive investors: Depreciation is non-cash, so a rental often shows a tax loss while cash-flowing — sheltering income. Rental losses are passive: they offset passive income freely, and up to $25,000/yr can offset ordinary (W-2) income if you actively participate and your MAGI is under $100k (phasing out to $0 by $150k); unused losses carry forward. On sale, claimed depreciation is recaptured at up to 25%, and gains may owe capital-gains tax (a 1031 exchange can defer both). Figures are a year-1 estimate at your 24.0% rate — not tax advice; consult a CPA.
Condition & rehab AI · 14 photos
The property is in fair condition with some repairs and maintenance needed. The roof is in poor condition and requires replacement. Painting the exterior siding and interior walls can improve the home's curb appeal and increase its resale value.
Repairs flagged
- Major roof — The roof appears to be in poor condition, with visible wear and tear.
- Minor exterior siding — The exterior siding appears to be in fair condition, with some discoloration and wear.
- Minor interior walls/paint — The interior walls and paint appear to be in fair condition, with some wear and tear visible.
- Minor HVAC and mechanical systems — The HVAC and mechanical systems appear to be in fair condition, with some wear and tear visible.
Value-add opportunities
- Resale Paint the exterior siding — Painting the exterior siding can improve the curb appeal and increase the home's resale value.
- Resale Paint the interior walls and trim — Painting the interior walls and trim can improve the home's appearance and increase its resale value.
- Resale Replace the roof — Replacing the roof can improve the home's overall condition and increase its resale value.
- Rental Service the HVAC and mechanical systems — Servicing the HVAC and mechanical systems can improve the home's comfort and energy efficiency, making it more attractive to potential renters.
Renovation cost estimate screening
| Repair item | Severity | Est. cost |
|---|---|---|
| roof · The roof appears to be in poor condition, with visible wear and tear. | Major | $15,000–50,000 |
| exterior siding · The exterior siding appears to be in fair condition, with some discoloration and wear. | Minor | $500–3,000 |
| interior walls/paint · The interior walls and paint appear to be in fair condition, with some wear and tear visible. | Minor | $500–3,000 |
| HVAC and mechanical systems · The HVAC and mechanical systems appear to be in fair condition, with some wear and tear visible. | Minor | $500–3,000 |
| Total estimated repair cost · 4 items | $16,500–59,000 |
Value-add ROI direction
- Resale Paint the exterior siding — Painting the exterior siding can improve the curb appeal and increase the home's resale value. ↑
- Resale Paint the interior walls and trim — Painting the interior walls and trim can improve the home's appearance and increase its resale value. ↑
- Resale Replace the roof — Replacing the roof can improve the home's overall condition and increase its resale value. ↑
- Rental Service the HVAC and mechanical systems — Servicing the HVAC and mechanical systems can improve the home's comfort and energy efficiency, making it more attractive to potential renters. ↑
ⓘ Cost ranges are severity-bucket heuristics (US national rule-of-thumb). Get contractor quotes + a written scope before underwriting a rehab budget.
Schools (NCES district)
- District
- Hamden School District
- NCES district ID
- 0901860
- Math proficiency
- 30% ▼ -13.00%
- Reading proficiency
- 43% ▼ -7.00%
- Median HH income
- $68,821
- Composite
- 33.34/100
- National rank
- #5490
- State rank
- #106 of 153 in CT
Livability — New Haven
- Score
- 79/100
- State rank
- #31
- US rank
- #2190
Category grades
Schools grade is shown separately in the Schools card above.
Census & demographics
- County
- New Haven County · 688,236 people
- City population
- 132,813
- Metro
- New Haven-Milford, CT
- Population (ZIP)
- 26,803
- Household income
- $88,900
- Rent vs Own
- Severe rent burden
- 1228.0
Population outlook (South Central Connecticut County) Hauer SSP2
- By 2040
- 608,362
Race, ethnicity, and origin ACS 2023
- Neighborhood character
- Diverse neighborhood (Simpson 0.68)
- Race & ethnicity
- White 43% Black 33% Hispanic / Latino 16% Two or more races 10% Asian 3%
- Hispanic origin (detail)
- Mexican 2% Puerto Rican 7% Dominican 2%
- Common ancestry
- Romanian 5% German 2% Lithuanian 2%
- Foreign-born
- 15% · Canada, Jamaica, China
- Languages at home
- 80% English-only · Spanish 10% Arabic 2% Other Indo-European 1%
Political lean MEDSL · South Central Connecticut
- 2024 margin
- Strong D (+20.1) · D 59.0% · R 38.9% · Other 2.1%
- All cycles
- 2024: D+20.1
Not yet ingested
- Civics
- —
Market trends
- HPI YoY
- ▼ -222.59%
- Current HPI
- 251.556
- Rent YoY
- ▲ 4.61%
- Metro
- New Haven-Milford, CT
- State GDP YoY
- ▲ 1.06%
- F500 in state
- 38
Industry mix (Fortune 500 HQ in CT)
| Industry | F500 HQs | Revenue |
|---|---|---|
| Industrial Machinery | 4 | $38B |
|
||
| Insurance | 3 | $71B |
|
||
| Financial Services | 2 | $25B |
|
||
| Transportation / Logistics | 2 | $18B |
|
||
| Healthcare | 1 | $247B |
|
||
| Telecommunications | 1 | $55B |
|
||
Price history
1 event — show timeline
- 2026-04-28 Listed $650,000 Smart MLS
Cash-flow waterfall
monthlySold comps — $/sqft
last 12 mo · ≤1 miLoading sold comps…