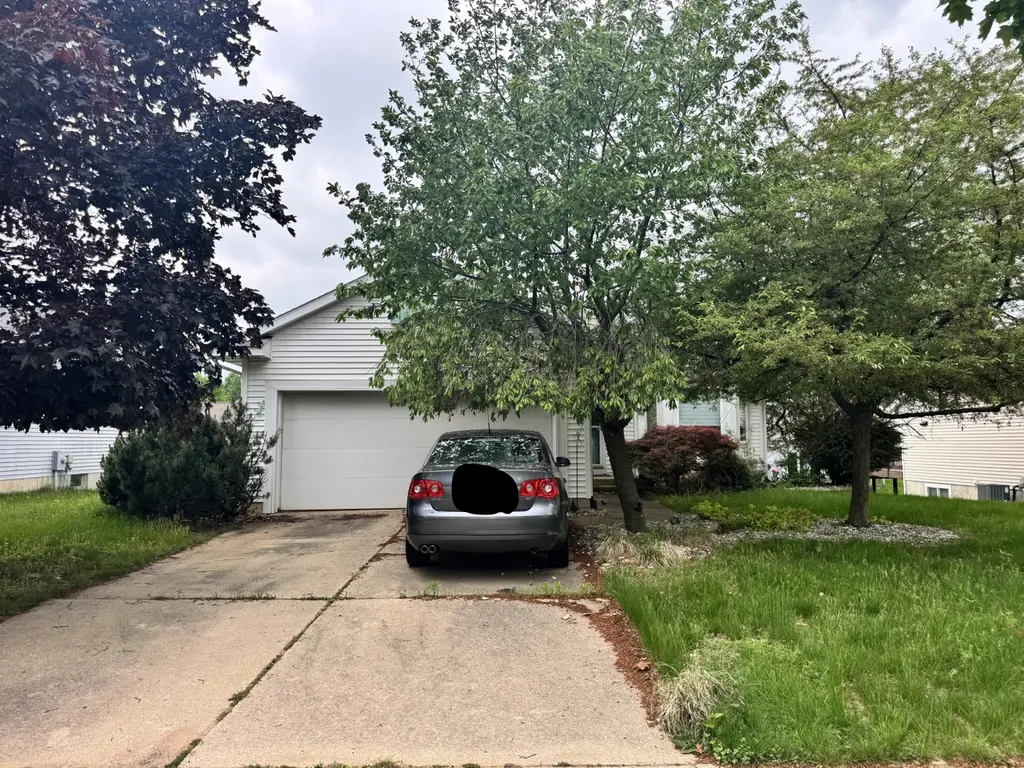
1709 Waldorn Ave NE · Grand Rapids, MI
Flood risk 1/10 · Minimal
- FEMA flood zone
- X (unshaded)
- Chance of flooding over 30 yrs
- 0.0%
- Est. flood insurance / yr
- $473 – $860
Fire risk 1/10 · Minimal
- Est. fire insurance / yr
- $784 – $1,456
Heat risk 2/10 · Minimal
- Hot days now (above 96°F)
- 7 days/yr
- Hot days in 30 yrs
- 16 days/yr
Wind risk 2/10 · Minimal
- Chance of severe wind over 30 yrs
- —
Air-quality risk 3/10 · Minor
- Unhealthy air days now
- 2 days/yr
- Unhealthy air days in 30 yrs
- 3 days/yr
Risk factors via First Street. Map © Google.
Why this score? — see what drove the D grade
The composite is a weighted blend of 9 inputs, each scored 0–100. Each bar is that input's sub-score; the figure is the points it added to the 100-point composite (weight × sub-score).
- Cash flow +13.8/30.0
- ARV discount +7.5/15.0
- DSCR +4.2/10.0
- Livability +4.2/5.0
- 1% rule +3.6/10.0
- Rent growth +3.6/5.0
- Condition / age +2.5/5.0
- Schools +1.9/10.0
- Appreciation +0.0/10.0
$200,000
🖨 Deal sheet (PDF) 📄 Offer letter ✓ Due diligence
Listing remarks MLS
Property sold off market. Uploaded for comps only.
Key facts
- 7,667 sq ft lot
- 2 garage spots
- Built 1996
Property features AI
Exterior
- Parking: Attached 2-car garage
- Utilities: Public water; Public sewer
- Home design: Ranch-style single-family residence; Built in 1996; Living area about 1,452
- Construction: Vinyl siding; Shingle roof; Full foundation
- Exterior features: Paved road access; Lot is approximately 0.18 acres
Interior
- Bathrooms: Two full bathrooms
- Heating & cooling: Forced air heating; Has cooling
- Interior features: Five total rooms; Full basement
- Laundry & utility: Natural gas water heater
Neighborhood map
What this means for you Summary
Snapshot
- This is a 2-bed/1.0-bath single-family listed at $200k.
Deal economics
- At list price, monthly cash flow is $18 ($210/yr) — positive.
- The deal already cash-flows at list — no discount required.
- To meet the 1% rule (rent ≥ 1% of price), the offer needs to be $171k (14.5% below list).
- Recommended offer: $171k (14.5% below list) — sets the bar for 1% rule.
- Cap rate 6.4% vs local median 4.5% in Grand Rapids — top-decile yield for the area; either an underpriced asset or a hidden risk that comps aren't pricing in. Stress-test before assuming the spread holds.
Location & tenants
- Location reads 83/100 on livability (#44 in MI, #939 nationally) — a professional / high-income tenant draw. Strengths: amenities A+, commute A+, cost of living A+; Watch: employment C-, crime F.
- Grand Rapids Public Schools (urban): math 15% / reading 29% proficiency, ranked #451 of 540 in MI (top 84%) — low school quality limits family demand, transient renter base, plan for 1-2y turnover; 80% free/reduced lunch — lower-income household profile, screen leases tightly.
- Zoned schools: Aberdeen Academy (math 12% / reading 22%, grade F, #1,149 of 1,397 statewide, top 84%, 234 students, 77% FRL); Riverside Middle School (math 8% / reading 17%, grade F, #466 of 493 statewide, top 95%, 248 students, 89% FRL); Union High School (math 2% / reading 12%, grade F, #699 of 713 statewide, top 99%, 922 students, 88% FRL).
- Market conditions: Rents rising fast (+4.5%/yr); 149 active listings in the ZIP; 7 comparable units currently listed for rent nearby; rentals at typical pace (median 25d on market — plan ~3-4 weeks tenant-placement turnaround); 43% of comp listings sitting > 30 days — soft ceiling on asking rent; 2,253 units permitted in Kent County in 2024 (969 in 5+ unit buildings).
Forward outlook
- Local home prices are declining (-3.0%/yr); year-one equity from $1k of loan paydown is wiped out by about $6k of value loss. Plan a longer hold.
- Kent County population projected at +22% by 2050 — long-run rental-demand tailwind backs the buy-and-hold thesis.
Negotiation context
- Only 1 days on market — expect competitive offers; lowballing is unlikely to land.
- 3 sale attempts with the ask held roughly flat each time — persistent listings suggest the price (not the market) is what's stuck; bring a comps-based counter.
Questions for the listing agent
- Is there a deadline driving the sale (1031 exchange, divorce, estate, relocation)? That informs how much negotiation room exists.
- Crime grade is F in this area — have there been break-ins, vandalism, or insurance claims at this property in the last 3 years? What carrier currently insures it and at what premium?
- The area grade is low — what's the realistic commute time and amenity access for the typical tenant pool here? Any planned neighborhood developments (good or bad) we should know about?
- What's the average days-on-market for RENTAL listings here right now (not sales)? A rising rental-DOM trend means longer vacancies and softer asking-rent achievability than the comps imply.
- What's the recent tenant-quality profile in this submarket — average credit score on applications, eviction rate, late-payment / NSF rate, and stable-employment percentage? A property-management company in the area should have these aggregated.
- How much new for-sale + rental construction is in the pipeline within 1–3 miles? Heavy new supply typically softens prices + rents 12–24 months out; constrained supply supports both.
Investment metrics
- 1% rule
- 0.86% ✗
- Cap rate
- 6.40%
- Cash-on-cash
- 0.38%
- DSCR
- 1.02
- GRM
- 9.7
CMA / ARV
No comps found within radius.
Projected returns pro-forma
-3.0% appreciation · 4.55% rent growth · sell at horizon
- IRR
- -14.0%
- Equity multiple
- 0.49×
- Total profit
- $-28,587
- Equity at exit
- $29,821
- IRR
- -3.0%
- Equity multiple
- 0.79×
- Total profit
- $-11,996
- Equity at exit
- $17,292
Cash invested: $56,000 (down + closing). Projections, not guarantees.
Landlord ↔ Tenant lean methodology
- Overall (STATE)
- 62 Landlord-Friendly
- State Michigan
- 62 Landlord-Friendly · EVEN
- County
- — inherits STATE
- City
- — inherits STATE
ZIP-level market 49505
- Rents YoY
- 4.5%
- Active inventory
- 149
- Price-to-rent
- 9.7×
Monthly cashflow live
- Estimated rent
- $1,711 high interval (Pro) →
- Mortgage (P&I)
- −$1,049
- Tax from tax record
- −$202 /mo · $2,423/yr
- Insurance
- −$83
- HOA
- −$0
- Vacancy / Maint / Mgmt
- −$359
- Net cashflow
- $18
Break-even live
Sensitivity live
| Price | -10% $131 | -5% $74 | +0% $18 | +5% $-39 | +10% $-96 |
|---|---|---|---|---|---|
| Rent | -10% $-118 | -5% $-50 | +0% $18 | +5% $85 | +10% $153 |
| Rate | -1.0pp $118 | -0.5pp $68 | base $18 | +0.5pp $-34 | +1.0pp $-87 |
UW: 25.0% down · 7.5% · 30yr · 1.5% tax · 5.0% vac · 8.0% maint · 8.0% mgmt
Financing live
Cash to close
- Down payment
- $50,000
- Closing costs
- $6,000
- Reserves months
- —
- Total cash needed
- —
Loan-product check · same deal, 3 products live
Conventional
25% down · 7.5% · 30yr
- Down + closing
- —
- Monthly P&I
- —
- Monthly cashflow
- —
- DSCR
- —
- Eligible?
- —
Personal DTI + credit; lowest rate.
DSCR
20% down · 8.5% · 30yr
- Down + closing
- —
- Monthly P&I
- —
- Monthly cashflow
- —
- DSCR
- —
- Eligible?
- —
No personal income docs; deal must DSCR.
Hard money
10% down · 12.0% · 12mo
- Down + closing
- —
- Monthly P&I
- —
- Monthly cashflow
- —
- DSCR
- —
- Eligible?
- —
Short-term bridge; refi at stabilization.
Rent comps 7 comps
| Address | Beds | Baths | Sqft | Rent | $/sqft | DOM | Units | Dist |
|---|---|---|---|---|---|---|---|---|
| 1314 Portland Ave NE Grand Rapids, MI | 2.0 | 1.0 | 908 | $1,425 | $1.57 | 45d | 1 | 0.97mi |
| 1880 Stonebrook Dr NE Grand Rapids, MI | 2.0 | 1.5 | 1075 | $1,700 | $1.58 | 13d | 1 | 1.00mi |
| 1300 3 Mile Rd NE Grand Rapids, MI | 1.0–3.0 | 1.5–2.5 | 1270 | $2,368 | $1.86 | 4d | 1 | 1.30mi |
| 841 Houseman Ave NE Grand Rapids, MI | 2.0 | 1.5 | 1128 | $1,700 | $1.51 | 45d | 1 | 1.30mi |
| 1370 Beckwith View Ave NE Unit 1406 Grand Rapids, MI | 2.0 | 1.0 | 900 | $1,450 | $1.61 | 25d | 1 | 1.43mi |
| 1359 Dewberry Pl NE Grand Rapids, MI | 2.0 | 1.5–2.5 | 1050 | $1,813 | $1.73 | 4d | 9 | 1.44mi |
| 239 Ann St NE Unit 1 Grand Rapids, MI | 2.0 | 1.0 | 928 | $1,300 | $1.40 | 45d | 1 | 1.48mi |
Listing history 6 events
-
2026-05-19status Pending
-
2026-05-18historical 50-char remark
Show marketing remark (50 chars)
Property sold off market. Uploaded for comps only.
-
2026-05-18historical 50-char remark
Show marketing remark (50 chars)
Property sold off market. Uploaded for comps only.
-
2026-05-13$200,000 Active
Show marketing remark (50 chars)
Property sold off market. Uploaded for comps only.
-
2026-05-13$200,000 50-char remark
Show marketing remark (50 chars)
Property sold off market. Uploaded for comps only.
-
2026-05-13$200,000 50-char remark
Show marketing remark (50 chars)
Property sold off market. Uploaded for comps only.
ⓘ Source: listings_history table (triggers on properties + properties_extension) + one-shot
backfill from property_details.listing_events for pre-trigger history.
Tax reassessment forecast MI · Partial reset (capped growth)
- Current annual tax
- $2,423 · $202/mo
- Projected year-2 tax
- $2,751 · $229/mo
- Expected delta
- +$329/yr (+$27/mo · 13.6%)
ⓘ Screening estimate from a state-policy table — verify with the county assessor before closing.
Climate risk First Street
- Flood 1/10 Low FEMA zone X (unshaded) · 0% chance over 30 yrs
- Wildfire 1/10 Low
- Heat 2/10 Low 7 d/yr ≥96°F today · 16 d/yr by 30 yrs out
- Wind 2/10 Low
- Air quality 3/10 Moderate 2 unhealthy d/yr today · 3 by 30 yrs out
Nearby sold comps map
Loading sold comps map…
Walkable amenities ~0.75 mi
Loading nearby amenities…
Taxation est. · year 1
- Rental income
- $20,530
- − Mortgage interest
- −$11,203
- − Property taxes
- −$2,423
- − Insurance
- −$1,000
- − Repairs & maintenance
- −$1,642
- − Management
- −$1,642
- − Depreciation
- −$5,818
- Taxable loss
- −$3,199
- Est. tax savings @ 24.0%
- +$768
- After-tax cash flow
- $978/yr
For passive investors: Depreciation is non-cash, so a rental often shows a tax loss while cash-flowing — sheltering income. Rental losses are passive: they offset passive income freely, and up to $25,000/yr can offset ordinary (W-2) income if you actively participate and your MAGI is under $100k (phasing out to $0 by $150k); unused losses carry forward. On sale, claimed depreciation is recaptured at up to 25%, and gains may owe capital-gains tax (a 1031 exchange can defer both). Figures are a year-1 estimate at your 24.0% rate — not tax advice; consult a CPA.
Schools (NCES district)
- District
- Grand Rapids Public Schools
- NCES district ID
- 2616440
- Math proficiency
- 15% ▼ -5.00%
- Reading proficiency
- 29% ▼ -1.00%
- Median HH income
- $40,612
- Composite
- 18.62/100
- National rank
- #8899
- State rank
- #451 of 540 in MI
Livability — Grand Rapids
- Score
- 83/100
- State rank
- #44
- US rank
- #939
Category grades
Schools grade is shown separately in the Schools card above.
Census & demographics
- Census place
- Grand Rapids, MI
- County
- Kent County · 533,805 people
- City population
- 181,325
- Metro
- Grand Rapids-Kentwood, MI
- Population (ZIP)
- 32,426
- Household income
- $74,906
- Rent vs Own
- Severe rent burden
- 1330.0
Population outlook (Kent County) Hauer SSP2
- Today (2025)
- 712,484 people
- By 2030
- 748,618 · +5.1%
- By 2040
- 814,777 · +14.4%
- By 2050
- 868,556 · +21.9%
- By 2075
- 966,487 · +35.7%
- By 2100
- 967,975 · +35.9%
Race, ethnicity, and origin ACS 2023
- Neighborhood character
- Predominantly White (68%)
- Race & ethnicity
- White 68% Black 14% Two or more races 11% Hispanic / Latino 8% Asian 3%
- Hispanic origin (detail)
- Mexican 5% Puerto Rican 1%
- Common ancestry
- Iranian 12% Romanian 8% Italian 3%
- Foreign-born
- 6% · Canada, China, Vietnam
- Languages at home
- 92% English-only · Spanish 3% Chinese 1% Other Indo-European 1%
Political lean MEDSL · Kent
- 2024 margin
- Lean D (+5.4) · D 51.8% · R 46.5% · Other 1.7%
- 2008→2024 swing
- +4.8pp toward D · 2008: 0.5pp · 2024: 5.4pp
- All cycles
- 2024: D+5.4 2020: D+6.1 2016: R+3.1 2012: R+7.9 2008: D+0.5
Not yet ingested
- Civics
- —
Market trends
- HPI YoY
- ▼ -324.57%
- Current HPI
- 306.797
- Rent YoY
- ▲ 4.55%
- Metro
- Grand Rapids-Kentwood, MI
- State GDP YoY
- ▲ 1.37%
- F500 in state
- 28
Industry mix (Fortune 500 HQ in MI)
| Industry | F500 HQs | Revenue |
|---|---|---|
| Automotive Parts | 3 | $48B |
|
||
| Automotive | 2 | $372B |
|
||
| Chemicals | 1 | $45B |
|
||
| Automotive Retail | 1 | $29B |
|
||
| Healthcare / Medical Devices | 1 | $23B |
|
||
| Automotive Technology | 1 | $20B |
|
||
Price history
+0.0% since first listed6 events — show timeline
- 2026-05-19 Pending — SW Michigan MLS
- 2026-05-18 Listing Removed — MiRealSource-MiMLS
- 2026-05-18 Listing Removed — REALCOMP
- 2026-05-13 Listed $200,000 MiRealSource-MiMLS
- 2026-05-13 Listed $200,000 REALCOMP
- 2026-05-13 Listed $200,000 SW Michigan MLS
Property tax history
+2.4%/yrLatest (2025): $2,423 · -3.6% YoY. Source: county tax records.
Cash-flow waterfall
monthlySold comps — $/sqft
last 12 mo · ≤1 miLoading sold comps…