63 Ridgeview Dr · The Hideout, PA
Flood risk 1/10 · Minimal
- FEMA flood zone
- X (unshaded)
- Chance of flooding over 30 yrs
- 0.0%
- Est. flood insurance / yr
- $507 – $1,088
Fire risk 1/10 · Minimal
- Est. fire insurance / yr
- $511 – $949
Heat risk 2/10 · Minimal
- Hot days now (above 91°F)
- 7 days/yr
- Hot days in 30 yrs
- 16 days/yr
Wind risk 2/10 · Minimal
- Chance of severe wind over 30 yrs
- 3.0%
Air-quality risk 2/10 · Minimal
- Unhealthy air days now
- 1 days/yr
- Unhealthy air days in 30 yrs
- 2 days/yr
Risk factors via First Street. Map © Google.
Why this score? — see what drove the B grade
The composite is a weighted blend of 9 inputs, each scored 0–100. Each bar is that input's sub-score; the figure is the points it added to the 100-point composite (weight × sub-score).
- Cash flow +25.8/30.0
- Appreciation +10.0/10.0
- DSCR +8.6/10.0
- ARV discount +7.4/15.0
- 1% rule +7.1/10.0
- Schools +4.4/10.0
- Livability +3.6/5.0
- Rent growth +2.5/5.0
- Condition / age +2.5/5.0
$239,000
🖨 Deal sheet (PDF) 📄 Offer letter ✓ Due diligence
Listing remarks
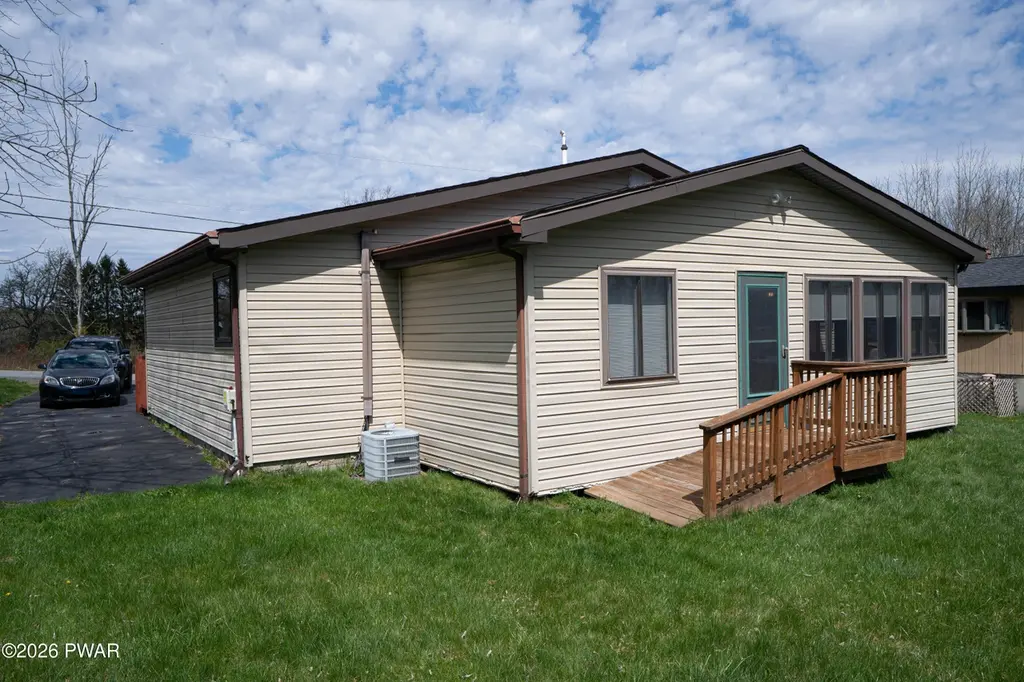
Spacious and bright ranch home in the Poconos featuring a beautiful open floor plan and soaring vaulted ceilings! Enjoy easy one-level living with an airy layout that's perfect for both everyday comfort and entertaining. Located in the amenity-filled, gated recreational community of The Hideout, you'll have access to lakes, pools, beaches, golf course, ski hill, restaurant, bar, fitness center, and tiki bar. Whether you're looking for a full-time residence or a weekend retreat, this home offers the perfect blend of comfort and lifestyle.
Key facts
- Access to lakes
- Open floor plan
- Access to pools
Tags
Property features AI
Finance
- Financial info: Association fee listed with annual and one-time amounts
- HOA & community: Homeowners association with annual fee (annually); Association amenities include: beach access, trails, trash service, RV/boat storage, tennis courts, seasonal streams/ponds, sport courts, ski access, security, powered boats allowed, recreation facilities, pool, party room, playground, picnic area, marina, park, golf course access, jogging path, game courts (interior & exterior), gated community, game room, fitness center, dog park, clubhouse, billiard room, beach rights
Exterior
- Parking: Driveway (paved)
- Security: Gated community
- Utilities: Public sewer
- Home design: Single-family residential home; One story
- Construction: Asphalt roof
- Exterior features: Asphalt roof; Shed(s); Private maintained paved road access; Cleared lot; View of Roamingwood Lake
Interior
- Kitchen: Electric range and electric oven; Dishwasher; Refrigerator
- Bedrooms: Total of 6 rooms (includes bedrooms and living spaces)
- Flooring: Carpet; Tile; Laminate
- Bathrooms: 2 full bathrooms
- Heating & cooling: Electric baseboard heating; Central air conditioning; Ceiling fan(s)
- Interior features: Dishwasher, Refrigerator, Electric Range, Electric Oven; Living room fireplace with propane; Crawl space basement; Has ceiling fans
- Laundry & utility: Main-level laundry room
Neighborhood map
What this means for you Summary
Snapshot
- This is a 2-bed/1.0-bath single-family listed at $239k.
Deal economics
- At list price, monthly cash flow is $581 ($7k/yr) — positive.
- The deal already cash-flows at list — no discount required.
- Meets the 1% rule at list price ($3k rent vs $239k).
- Recommended offer: $232k (3.0% below list) — sets the bar for market timing.
- Cap rate 9.2% vs local median 5.0% in The Hideout — top-decile yield for the area; either an underpriced asset or a hidden risk that comps aren't pricing in. Stress-test before assuming the spread holds.
Location & tenants
- Location reads 72/100 on livability (#668 in PA) — a middle-class / working-renter tenant base. Strengths: crime A+, employment A+, cost of living A+; Watch: amenities F, commute F, health & safety F.
- Western Wayne SD (rural): math 39% / reading 63% proficiency, ranked #165 of 539 in PA (top 31%) — acceptable for families but not a draw, mixed tenant base, ~2y average lease.
- Zoned schools: Evergreen El Sch (math 42% / reading 68%, grade C, #498 of 1,518 statewide, top 33%, 506 students, 64% FRL); Western Wayne Ms (math 21% / reading 61%, grade F, #243 of 512 statewide, top 48%, 411 students, 57% FRL); Western Wayne Hs (math 77% / reading 24%, grade D+, #125 of 437 statewide, top 30%, 545 students, 49% FRL) — zoned schools average 56% FRL vs 41% district-wide (16 pts higher); higher-poverty schools than district average — tighter screening recommended.
- Market conditions: 340 active listings in the ZIP; 1 comparable units currently listed for rent nearby; 177 units permitted in Wayne County in 2024 (0 in 5+ unit buildings).
Forward outlook
- In year one you build about $26k of equity ($2k loan paydown + $24k appreciation (10.0% local appreciation)).
- Wayne County population projected at -17% by 2050 — secular population decline; favor cash flow + early exit over multi-decade hold.
- At projected returns (10.0% appreciation + 3.0% rent growth), your $67k cash investment doubles in ~2 years — after that, you're playing with house money.
- By year 2, paydown + projected appreciation supports a ~$41k cash-out refi (75% LTV) — recoverable capital for the next deal without selling this one.
Negotiation context
- It's been on market 54 days — a 3% lower offer ($232k) is reasonable based on typical stale-listing flexibility.
- Current owner paid $15k; list at $239k implies a 1472% gain — meaningful room to come down on a strong offer.
Questions for the listing agent
- It's been on market 54 days. Have you received any prior offers? Is the seller open to a 3% concession, seller financing, or rate buy-down credit?
- What does the HOA fee cover, when was the last increase, and are there any pending special assessments or reserve-fund shortfalls?
- Is there a deadline driving the sale (1031 exchange, divorce, estate, relocation)? That informs how much negotiation room exists.
- Schools are D-rated, which usually means shorter tenancies and higher turnover. Who's the typical renter profile here, and what's been the actual vacancy rate?
- What's the average days-on-market for RENTAL listings here right now (not sales)? A rising rental-DOM trend means longer vacancies and softer asking-rent achievability than the comps imply.
- What's the recent tenant-quality profile in this submarket — average credit score on applications, eviction rate, late-payment / NSF rate, and stable-employment percentage? A property-management company in the area should have these aggregated.
- How much new for-sale + rental construction is in the pipeline within 1–3 miles? Heavy new supply typically softens prices + rents 12–24 months out; constrained supply supports both.
Investment metrics
- 1% rule
- 1.21% ✓
- Cap rate
- 9.21%
- Cash-on-cash
- 10.41%
- DSCR
- 1.46
- GRM
- 6.9
CMA / ARV
- ARV (median comp)
- $238,473
- List price
- $239,000
- Delta
- 0.22%
- Verdict
- FAIR
- Comps
- 20 within 1.0 mi
Show comp detail 9 sales within ~0.75 mi
| Address | Dist | Beds/Ba | Sqft | Sold | Price | $/sf | Match |
|---|---|---|---|---|---|---|---|
| 114 Woodview Ter | 0.40mi | 2/1.0 | 1,122 (+3%) | 10mo | $190,000 | $169 | 69 |
| 8 Boulder Ct | 0.71mi | 2/1.0 | 1,093 (+0%) | 0mo | $205,000 | $188 | 66 |
| 16 N Gate Ct S | 0.55mi | 2/1.0 | 1,112 (+2%) | 8mo | $235,000 | $211 | 65 |
| 1267 Brookfield Rd | 0.53mi | 2/2.0 | 1,134 (+4%) | 6mo | $232,160 | $205 | 60 |
| 11 Meadowview Dr | 0.58mi | 3/2.0 (+1) | 948 (-13%) | 1mo | $190,000 | $200 | 41 |
| 45 Brentwood Dr | 0.72mi | 3/1.0 (+1) | 1,152 (+6%) | 13mo | $229,000 | $199 | 41 |
| 57 Woodview Ter | 0.40mi | 3/2.0 (+1) | 1,200 (+10%) | 19mo | $265,000 | $221 | 40 |
| 19 Boulder Ct | 0.74mi | 2/2.0 | 1,028 (-6%) | 18mo | $220,000 | $214 | 37 |
| 18 Boulder Ct | 0.69mi | 3/2.0 (+1) | 944 (-14%) | 20mo | $225,000 | $238 | 20 |
Match score weights: distance 35% · size 25% · config 20% · recency 20%. Top-matched comps best support the ARV.
Projected returns pro-forma
10.0% appreciation · 3.0% rent growth · sell at horizon
- IRR
- 31.9%
- Equity multiple
- 3.50×
- Total profit
- $167,236
- Equity at exit
- $215,310
- IRR
- 27.6%
- Equity multiple
- 7.93×
- Total profit
- $463,553
- Equity at exit
- $464,324
Cash invested: $66,920 (down + closing). Projections, not guarantees.
Landlord ↔ Tenant lean methodology
- Overall (STATE)
- 62 Landlord-Friendly
- State Pennsylvania
- 62 Landlord-Friendly · EVEN
- County
- — inherits STATE
- City
- — inherits STATE
ZIP-level market 18436
- Home prices YoY
- 16.9%
- Active inventory
- 340
- Price-to-rent
- 6.9×
Monthly cashflow live
- Estimated rent
- $2,900 medium interval (Pro) →
- Mortgage (P&I)
- −$1,253
- Tax from tax record
- −$168 /mo · $2,019/yr
- Insurance
- −$100
- HOA
- −$189
- Vacancy / Maint / Mgmt
- −$609
- Net cashflow
- $581
Break-even live
Sensitivity live
| Price | -10% $716 | -5% $648 | +0% $581 | +5% $513 | +10% $446 |
|---|---|---|---|---|---|
| Rent | -10% $352 | -5% $466 | +0% $581 | +5% $695 | +10% $810 |
| Rate | -1.0pp $701 | -0.5pp $642 | base $581 | +0.5pp $519 | +1.0pp $456 |
UW: 25.0% down · 7.5% · 30yr · 1.5% tax · 5.0% vac · 8.0% maint · 8.0% mgmt
Financing live
Cash to close
- Down payment
- $59,750
- Closing costs
- $7,170
- Reserves months
- —
- Total cash needed
- —
Loan-product check · same deal, 3 products live
Conventional
25% down · 7.5% · 30yr
- Down + closing
- —
- Monthly P&I
- —
- Monthly cashflow
- —
- DSCR
- —
- Eligible?
- —
Personal DTI + credit; lowest rate.
DSCR
20% down · 8.5% · 30yr
- Down + closing
- —
- Monthly P&I
- —
- Monthly cashflow
- —
- DSCR
- —
- Eligible?
- —
No personal income docs; deal must DSCR.
Hard money
10% down · 12.0% · 12mo
- Down + closing
- —
- Monthly P&I
- —
- Monthly cashflow
- —
- DSCR
- —
- Eligible?
- —
Short-term bridge; refi at stabilization.
Rent comps 1 comps
| Address | Beds | Baths | Sqft | Rent | $/sqft | DOM | Units | Dist |
|---|---|---|---|---|---|---|---|---|
| 1148 Golf Park Dr Lake Ariel, PA | 3.0 | 1.0 | 1210 | $2,900 | $2.40 | 26d | 1 | 0.62mi |
HOA detail
- Monthly dues
- $189 · $2,268/yr
- Likely covers
- poolgymsecurity
Listing history 15 events
-
2026-06-15statusdays on market $239,000 Pending 54 DOM
-
2026-06-14days on market $239,000 Active 53 DOM
-
2026-06-13days on market $239,000 Active 52 DOM
-
2026-06-10days on market $239,000 Active 50 DOM
-
2026-06-09days on market $239,000 Active 49 DOM
-
2026-06-08days on market $239,000 Active 48 DOM
-
2026-06-07days on market $239,000 Active 47 DOM
-
2026-06-03days on market $239,000 Active 43 DOM
-
2026-06-02days on market $239,000 Active 42 DOM
-
2026-06-01days on market $239,000 Active 41 DOM
-
2026-05-31days on market $239,000 Active 40 DOM
-
2026-05-30days on market $239,000 Active 39 DOM
-
2026-05-17price $239,000 543-char remark
-
2026-04-21$249,000 Active 543-char remark
-
1986-04-18soldstatus $15,200
ⓘ Source: listings_history table (triggers on properties + properties_extension) + one-shot
backfill from property_details.listing_events for pre-trigger history.
Tax reassessment forecast PA · Partial reset (capped growth)
- Current annual tax
- $2,019 · $168/mo
- Projected year-2 tax
- $2,898 · $241/mo
- Expected delta
- +$878/yr (+$73/mo · 43.5%)
ⓘ Screening estimate from a state-policy table — verify with the county assessor before closing.
Climate risk First Street
- Flood 1/10 Low FEMA zone X (unshaded) · 0% chance over 30 yrs
- Wildfire 1/10 Low
- Heat 2/10 Low 7 d/yr ≥91°F today · 16 d/yr by 30 yrs out
- Wind 2/10 Low 3% chance of damaging wind over 30 yrs
- Air quality 2/10 Low 1 unhealthy d/yr today · 2 by 30 yrs out
Nearby sold comps map
Loading sold comps map…
Walkable amenities ~0.75 mi
Loading nearby amenities…
Taxation est. · year 1
- Rental income
- $34,800
- − Mortgage interest
- −$13,388
- − Property taxes
- −$2,019
- − Insurance
- −$1,195
- − Repairs & maintenance
- −$2,784
- − Management
- −$2,784
- − HOA
- −$2,268
- − Depreciation
- −$6,953
- Taxable income
- $3,409
- Est. tax owed @ 24.0%
- −$818
- After-tax cash flow
- $6,151/yr
For passive investors: Depreciation is non-cash, so a rental often shows a tax loss while cash-flowing — sheltering income. Rental losses are passive: they offset passive income freely, and up to $25,000/yr can offset ordinary (W-2) income if you actively participate and your MAGI is under $100k (phasing out to $0 by $150k); unused losses carry forward. On sale, claimed depreciation is recaptured at up to 25%, and gains may owe capital-gains tax (a 1031 exchange can defer both). Figures are a year-1 estimate at your 24.0% rate — not tax advice; consult a CPA.
Schools (NCES district)
- District
- Western Wayne SD
- NCES district ID
- 4226070
- Math proficiency
- 39% ▼ -12.00%
- Reading proficiency
- 63% ▼ -6.00%
- Median HH income
- $51,358
- Composite
- 43.65/100
- National rank
- #2964
- State rank
- #165 of 539 in PA
Livability — The Hideout
- Score
- 72/100
- State rank
- #668
- US rank
- #6516
Category grades
Schools grade is shown separately in the Schools card above.
Census & demographics
- Census place
- The Hideout, PA
- Population (ZIP)
- 13,225
Population outlook (Wayne County) Hauer SSP2
- Today (2025)
- 47,924 people
- By 2030
- 46,191 · -3.6%
- By 2040
- 42,815 · -10.7%
- By 2050
- 39,873 · -16.8%
- By 2075
- 34,556 · -27.9%
- By 2100
- 28,358 · -40.8%
Race, ethnicity, and origin ACS 2023
- Neighborhood character
- Predominantly White (95%)
- Race & ethnicity
- White 95% Two or more races 3% Hispanic / Latino 2%
- Common ancestry
- Romanian 9% Scotch-Irish 2% Iranian 2%
- Foreign-born
- 4%
- Languages at home
- 95% English-only · French/Haitian/Cajun 2% Russian/Polish/Slavic 1% Spanish 1%
Political lean MEDSL · Wayne
- 2024 margin
- Solid R (+37.1) · D 31.1% · R 68.2%
- 2008→2024 swing
- -24.8pp toward R · 2008: -12.3pp · 2024: -37.1pp
- All cycles
- 2024: R+37.1 2020: R+33.6 2016: R+39.7 2012: R+20.9 2008: R+12.3
Not yet ingested
- Civics
- —
Market trends
- HPI YoY
- ▲ 47.95%
- Current HPI
- 331.9645
- Rent YoY
- —
- Metro
- —
- State GDP YoY
- ▲ 1.68%
- F500 in state
- 34
Industry mix (Fortune 500 HQ in PA)
| Industry | F500 HQs | Revenue |
|---|---|---|
| Healthcare | 2 | $309B |
|
||
| Insurance | 2 | $27B |
|
||
| Telecommunications / Media | 1 | $124B |
|
||
| Industrial Distribution | 1 | $22B |
|
||
| Financial Services | 1 | $20B |
|
||
| Chemicals / Materials | 1 | $18B |
|
||
Price history
+1472.4% since first listed4 events — show timeline
- 2026-06-14 Pending — PWMLS
- 2026-05-17 Price Changed $239,000 PWMLS
- 2026-04-21 Listed $249,000 PWMLS
- 1986-04-18 Sold (Public Records) $15,200 Public Records
Property tax history
+2.6%/yrLatest (2026): $2,019 · +3.0% YoY. Source: county tax records.
Cash-flow waterfall
monthlySold comps — $/sqft
last 12 mo · ≤1 miLoading sold comps…