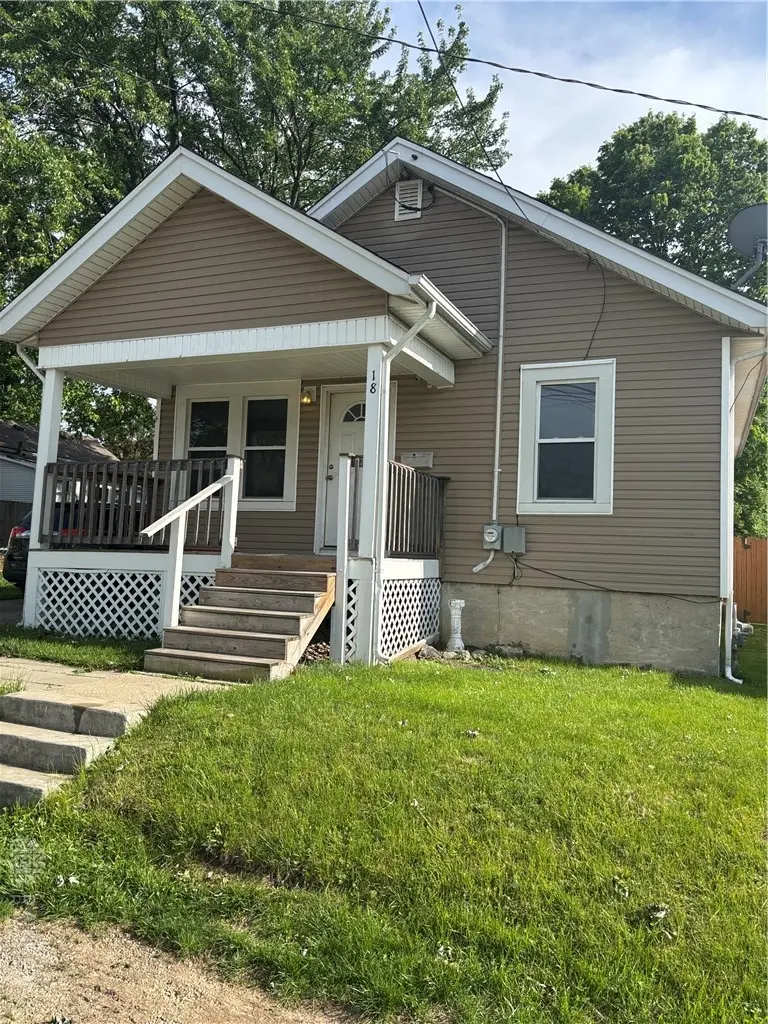
18 Velma · Dayton, OH
Flood risk 1/10 · Minimal
- FEMA flood zone
- X (unshaded)
- Chance of flooding over 30 yrs
- 0.0%
- Est. flood insurance / yr
- $473 – $860
Fire risk 1/10 · Minimal
- Est. fire insurance / yr
- $713 – $1,323
Heat risk 3/10 · Minor
- Hot days now (above 101°F)
- 7 days/yr
- Hot days in 30 yrs
- 18 days/yr
Wind risk 2/10 · Minimal
- Chance of severe wind over 30 yrs
- 0.0%
Air-quality risk 3/10 · Minor
- Unhealthy air days now
- 3 days/yr
- Unhealthy air days in 30 yrs
- 5 days/yr
Risk factors via First Street. Map © Google.
Why this score? — see what drove the D grade
The composite is a weighted blend of 9 inputs, each scored 0–100. Each bar is that input's sub-score; the figure is the points it added to the 100-point composite (weight × sub-score).
- Cash flow +13.9/30.0
- ARV discount +12.1/15.0
- DSCR +4.2/10.0
- 1% rule +3.7/10.0
- Rent growth +3.7/5.0
- Livability +3.2/5.0
- Condition / age +2.5/5.0
- Schools +1.3/10.0
- Appreciation +0.0/10.0
$119,900
🖨 Deal sheet (PDF) 📄 Offer letter ✓ Due diligence
Listing remarks
Check out this home in the desirable Belmont neighborhood. This home has many possibilities. Two bedrooms on the first floor, new flooring throughout, and a full remodeled bathroom. The basement is unfinished offering additional storage. The exterior has a welcoming porch and a convenient large storage shed. This property offers a balance of privacy and community.
Key facts
- 4,500 sq ft lot
- Built 1925
- Listed 31 days
Property features AI
Finance
- Other: Lot about 0.10 acre (assessor)
- Financial info: Offered for sale
Exterior
- Parking: Storage available
- Home design: Single-story frame home with vinyl siding
- Construction: Frame construction; Vinyl siding
- Exterior features: Residential zoning
Interior
- Bedrooms: Main-level bedroom, approximately 10 x 10
- Bathrooms: 1 full bathroom (main level)
- Heating & cooling: Forced air heating
- Interior features: Wood window frames; Unfinished basement
- Laundry & utility: Gas water heater
Neighborhood map
What this means for you Summary
Snapshot
- This is a 2-bed/1.0-bath single-family listed at $120k.
Deal economics
- At list price, monthly cash flow is $13 ($161/yr) — positive.
- The deal already cash-flows at list — no discount required.
- To meet the 1% rule (rent ≥ 1% of price), the offer needs to be $104k (13.3% below list).
- Recommended offer: $104k (13.3% below list) — sets the bar for 1% rule.
Location & tenants
- Location reads 65/100 on livability (#716 in OH) — a middle-class / working-renter tenant base. Strengths: cost of living A+, housing A+, health & safety A; Watch: amenities C-, crime F, commute F.
- Dayton City (urban): math 12% / reading 21% proficiency, ranked #641 of 656 in OH (top 98%) — low school quality limits family demand, transient renter base, plan for 1-2y turnover; 74% free/reduced lunch — lower-income household profile, screen leases tightly.
- Zoned schools: River'S Edge Montessori Elementary School (math 22% / reading 32%, grade F, #1,193 of 1,584 statewide, top 76%, 494 students, 0% FRL); Belmont High School (math 5% / reading 20%, grade F, #720 of 781 statewide, top 93%, 1,100 students, 0% FRL) — zoned schools average 0% FRL vs 74% district-wide (74 pts lower); this property's tenant base skews higher-income than the district average.
- Market conditions: Rents rising fast (+4.8%/yr); 106 active listings in the ZIP; 40 comparable units currently listed for rent nearby; rentals at typical pace (median 26d on market — plan ~3-4 weeks tenant-placement turnaround); 907 units permitted in Montgomery County in 2024 (416 in 5+ unit buildings).
Forward outlook
- Local home prices are declining (-3.0%/yr); year-one equity from $829 of loan paydown is wiped out by about $4k of value loss. Plan a longer hold.
- Montgomery County population projected at -10% by 2050 — secular population decline; favor cash flow + early exit over multi-decade hold.
Negotiation context
- It's been on market 31 days — a 3% lower offer ($116k) is reasonable based on typical stale-listing flexibility.
- Current owner paid $46k; list at $120k implies a 161% gain — meaningful room to come down on a strong offer.
Risks & watch-outs
- Watch-outs: built in 1925 — expect roof / HVAC / electrical / plumbing capex.
Questions for the listing agent
- It's been on market 31 days. Have you received any prior offers? Is the seller open to a 13% concession, seller financing, or rate buy-down credit?
- Built in 1925 — when were the roof, HVAC, electrical panel, plumbing, and water heater last replaced?
- Is there a deadline driving the sale (1031 exchange, divorce, estate, relocation)? That informs how much negotiation room exists.
- Crime grade is F in this area — have there been break-ins, vandalism, or insurance claims at this property in the last 3 years? What carrier currently insures it and at what premium?
- The area grade is low — what's the realistic commute time and amenity access for the typical tenant pool here? Any planned neighborhood developments (good or bad) we should know about?
- What's the average days-on-market for RENTAL listings here right now (not sales)? A rising rental-DOM trend means longer vacancies and softer asking-rent achievability than the comps imply.
- What's the recent tenant-quality profile in this submarket — average credit score on applications, eviction rate, late-payment / NSF rate, and stable-employment percentage? A property-management company in the area should have these aggregated.
- How much new for-sale + rental construction is in the pipeline within 1–3 miles? Heavy new supply typically softens prices + rents 12–24 months out; constrained supply supports both.
Investment metrics
- 1% rule
- 0.87% ✗
- Cap rate
- 6.43%
- Cash-on-cash
- 0.48%
- DSCR
- 1.02
- GRM
- 9.6
CMA / ARV
- ARV (median comp)
- $133,653
- List price
- $119,900
- Delta
- -10.29%
- Verdict
- UNDERPRICED
- Comps
- 20 within 1.0 mi
Show comp detail 12 sales within ~0.75 mi
| Address | Dist | Beds/Ba | Sqft | Sold | Price | $/sf | Match |
|---|---|---|---|---|---|---|---|
| 2105 King Ave | 0.20mi | 2/1.0 | 836 (+9%) | 1mo | $125,000 | $150 | 75 |
| 134 Marlboro Pl | 0.39mi | 2/1.0 | 720 (-6%) | 2mo | $60,000 | $83 | 70 |
| 434 Bellaire Ave | 0.48mi | 2/1.0 | 792 (+3%) | 6mo | $152,500 | $193 | 68 |
| 2920 Lansing Dr | 0.62mi | 2/1.0 | 792 (+3%) | 1mo | $144,000 | $182 | 65 |
| 2436 Mundale Ave | 0.45mi | 2/1.0 | 827 (+8%) | 3mo | $95,000 | $115 | 64 |
| 4032 Woodcliffe Ave | 0.66mi | 2/1.0 | 756 (-2%) | 4mo | $61,160 | $81 | 63 |
| 2901 Lansing Dr | 0.58mi | 2/1.0 | 720 (-6%) | 1mo | $183,000 | $254 | 62 |
| 2419 Fauver Ave | 0.50mi | 2/1.0 | 832 (+8%) | 4mo | $138,000 | $166 | 60 |
| 714 Nordale Ave | 0.47mi | 2/1.0 | 686 (-11%) | 3mo | $115,000 | $168 | 58 |
| 127 Bellaire Ave | 0.45mi | 2/2.0 | 858 (+12%) | 1mo | $142,000 | $166 | 55 |
| 2921 Lansing Dr | 0.62mi | 2/1.0 | 860 (+12%) | 2mo | $174,000 | $202 | 50 |
| 1105 Pritz Ave | 0.74mi | 3/1.5 (+1) | 872 (+14%) | 2mo | $181,900 | $209 | 34 |
Match score weights: distance 35% · size 25% · config 20% · recency 20%. Top-matched comps best support the ARV.
Projected returns pro-forma
-3.0% appreciation · 4.82% rent growth · sell at horizon
- IRR
- -13.6%
- Equity multiple
- 0.50×
- Total profit
- $-16,633
- Equity at exit
- $17,877
- IRR
- -2.1%
- Equity multiple
- 0.85×
- Total profit
- $-5,117
- Equity at exit
- $10,367
Cash invested: $33,572 (down + closing). Projections, not guarantees.
Landlord ↔ Tenant lean methodology
- Overall (STATE)
- 73 Landlord-Friendly
- State Ohio
- 73 Landlord-Friendly · R+6
- County
- — inherits STATE
- City
- — inherits STATE
ZIP-level market 45420
- Rents YoY
- 4.8%
- Active inventory
- 106
- Price-to-rent
- 9.6×
Monthly cashflow live
- Estimated rent
- $1,039 high interval (Pro) →
- Mortgage (P&I)
- −$629
- Tax from tax record
- −$129 /mo · $1,548/yr
- Insurance
- −$50
- HOA
- −$0
- Vacancy / Maint / Mgmt
- −$218
- Net cashflow
- $13
Break-even live
Sensitivity live
| Price | -10% $81 | -5% $47 | +0% $13 | +5% $-21 | +10% $-54 |
|---|---|---|---|---|---|
| Rent | -10% $-69 | -5% $-28 | +0% $13 | +5% $54 | +10% $96 |
| Rate | -1.0pp $74 | -0.5pp $44 | base $13 | +0.5pp $-18 | +1.0pp $-49 |
UW: 25.0% down · 7.5% · 30yr · 1.5% tax · 5.0% vac · 8.0% maint · 8.0% mgmt
Financing live
Cash to close
- Down payment
- $29,975
- Closing costs
- $3,597
- Reserves months
- —
- Total cash needed
- —
Loan-product check · same deal, 3 products live
Conventional
25% down · 7.5% · 30yr
- Down + closing
- —
- Monthly P&I
- —
- Monthly cashflow
- —
- DSCR
- —
- Eligible?
- —
Personal DTI + credit; lowest rate.
DSCR
20% down · 8.5% · 30yr
- Down + closing
- —
- Monthly P&I
- —
- Monthly cashflow
- —
- DSCR
- —
- Eligible?
- —
No personal income docs; deal must DSCR.
Hard money
10% down · 12.0% · 12mo
- Down + closing
- —
- Monthly P&I
- —
- Monthly cashflow
- —
- DSCR
- —
- Eligible?
- —
Short-term bridge; refi at stabilization.
Rent comps 40 comps
| Address | Beds | Baths | Sqft | Rent | $/sqft | DOM | Units | Dist |
|---|---|---|---|---|---|---|---|---|
| 2416 Brookline Ave Dayton, OH | 2.0 | 1.0 | 806 | $895 | $1.11 | 4d | 1 | 0.16mi |
| 2029 Brookline Ave Dayton, OH | 2.0 | 1.0 | 990 | $1,270 | $1.28 | 16d | 1 | 0.18mi |
| 511 Haskins Ave Dayton, OH | 1.0 | 1.0 | 600 | $775 | $1.29 | 45d | 1 | 0.22mi |
| 1410 Phillips Ave Unit 1 Dayton, OH | 2.0 | 1.0 | 1000 | $950 | $0.95 | 45d | 1 | 0.38mi |
| 1905 Coventry Rd Dayton, OH | 2.0 | 1.0 | 1000 | $1,250 | $1.25 | 25d | 1 | 0.44mi |
| 2306 Alice St Dayton, OH | 3.0 | 1.0 | 918 | $1,200 | $1.31 | 5d | 1 | 0.52mi |
| 737 Wilmington Ave Dayton, OH | 2.0 | 1.0 | 1000 | $950 | $0.95 | 25d | 1 | 0.53mi |
| 922 Wilmington Ave Dayton, OH | 2.0 | 1.0 | 720 | $1,200 | $1.67 | 25d | 1 | 0.53mi |
| 933 Wilmington Ave Dayton, OH | 1.0–2.0 | 1.0–1.5 | 802 | $980 | $1.22 | 5d | 8 | 0.57mi |
| 1274 Highland Ave Unit A Dayton, OH | 1.0 | 1.0 | 900 | $795 | $0.88 | 25d | 1 | 0.58mi |
| 1053 Wilmington Ave Dayton, OH | 2.0–3.0 | 1.0–1.5 | 1025 | $1,295 | $1.26 | 4d | 5 | 0.69mi |
| 2308 Wayne Ave Dayton, OH | 2.0 | 1.0 | 800 | $895 | $1.12 | 45d | 1 | 0.69mi |
| 1059 Wilmington Ave Unit 1059 1 Dayton, OH | 3.0 | 1.5 | 1100 | $1,495 | $1.36 | 45d | 1 | 0.70mi |
| 426 Kling Dr Unit B Dayton, OH | 1.0 | 1.0 | 600 | $1,500 | $2.50 | 5d | 1 | 0.71mi |
| 344 Firwood Dr Dayton, OH | 1.0–3.0 | 1.0–1.5 | 739 | $1,122 | $1.52 | 4d | 15 | 0.73mi |
| 854 Santa Cruz Ave Dayton, OH | 3.0 | 1.0 | 1060 | $1,300 | $1.23 | 45d | 1 | 0.77mi |
| 2200 Wayne Ave Dayton, OH | 2.0 | 1.0 | 748 | $975 | $1.30 | 4d | 1 | 0.78mi |
| 809 Patterson Rd Dayton, OH | 2.0 | 1.0–1.5 | 895 | $1,075 | $1.20 | 4d | 7 | 0.83mi |
| 1238 Colwick Dr Dayton, OH | 2.0 | 1.0 | 786 | $1,250 | $1.59 | 13d | 1 | 0.85mi |
| 13 Anderson St Dayton, OH | 1.0 | 1.0 | 605 | $775 | $1.28 | 16d | 1 | 0.88mi |
| 9 Anderson St Dayton, OH | 1.0 | 1.0 | 605 | $775 | $1.28 | 45d | 1 | 0.88mi |
| 9 Anderson St Dayton, OH | 1.0 | 1.0 | 850 | $750 | $0.88 | 25d | 1 | 0.88mi |
| 2012 Saint Charles Ave Dayton, OH | 2.0 | 1.0 | 945 | $1,250 | $1.32 | 45d | 1 | 0.88mi |
| 41 Patterson Village Dr Dayton, OH | 1.0–2.0 | 1.0 | 553 | $920 | $1.66 | 5d | 14 | 0.88mi |
| 16 Mello Ave Unit A Dayton, OH | 1.0 | 1.0 | 1000 | $800 | $0.80 | 16d | 1 | 0.89mi |
| 1430 Coventry Rd Dayton, OH | 2.0 | 1.0 | 1106 | $1,125 | $1.02 | 16d | 1 | 0.89mi |
| 823 Fourman Ct Dayton, OH | 1.0 | 1.0 | 577 | $839 | $1.45 | 5d | 2 | 0.91mi |
| 156 Gunckel Ave Apt 2 Dayton, OH | 2.0 | 1.0 | 800 | $700 | $0.88 | 25d | 1 | 1.02mi |
| 1132 Wyoming St Unit 2 Dayton, OH | 1.0 | 1.0 | 550 | $700 | $1.27 | 5d | 1 | 1.03mi |
| 1132 Wyoming St Unit 3 Dayton, OH | 1.0 | 1.0 | 550 | $700 | $1.27 | 25d | 1 | 1.03mi |
| 1354 Ohmer St Unit 1354C Dayton, OH | 2.0 | 1.0 | 900 | $700 | $0.78 | 45d | 1 | 1.04mi |
| 1354 Ohmer St Unit 1354A Dayton, OH | 2.0 | 1.0 | 900 | $675 | $0.75 | 25d | 1 | 1.04mi |
| 3100 Linden Ave Unit 3102 Dayton, OH | 2.0 | 1.0 | 1035 | $995 | $0.96 | 45d | 1 | 1.06mi |
| 3311 S Smithville Rd Dayton, OH | 3.0 | 1.0 | 1019 | $1,295 | $1.27 | 45d | 1 | 1.06mi |
| 1355 Ohmer St Unit 15 Dayton, OH | 1.0 | 1.0 | 600 | $725 | $1.21 | 16d | 1 | 1.08mi |
| 1659 Hearthstone Dr Dayton, OH | 3.0 | 1.0 | 1102 | $1,195 | $1.08 | 4d | 1 | 1.08mi |
| 1351 Ohmer St Dayton, OH | 1.0 | 1.0 | 600 | $725 | $1.21 | 5d | 1 | 1.08mi |
| 2850 Hazel Ave Unit 1496064P Dayton, OH | 3.0 | 2.0 | 850 | $6,259 | $7.36 | 21d | 1 | 1.09mi |
| 57 Gunckel Ave Unit 57 Dayton, OH | 1.0 | 1.0 | 700 | $675 | $0.96 | 25d | 1 | 1.15mi |
| 27 Gunckel Ave Dayton, OH | 1.0 | 1.0 | 550 | $675 | $1.23 | 45d | 1 | 1.20mi |
Listing history 9 events
-
2026-06-07statusdays on market $119,900 Pending 31 DOM
-
2026-06-05days on market $119,900 Active 28 DOM
-
2026-06-03days on market $119,900 Active 27 DOM
-
2026-06-02days on market $119,900 Active 26 DOM
-
2026-06-01days on market $119,900 Active 25 DOM
-
2026-05-31days on market $119,900 Active 24 DOM
-
2026-05-07$125,000 Active 367-char remark
-
1999-04-15soldstatus $46,000
-
1985-02-20soldstatus $18,750
ⓘ Source: listings_history table (triggers on properties + properties_extension) + one-shot
backfill from property_details.listing_events for pre-trigger history.
Tax reassessment forecast OH · Partial reset (capped growth)
- Current annual tax
- $1,548 · $129/mo
- Projected year-2 tax
- $1,709 · $142/mo
- Expected delta
- +$161/yr (+$13/mo · 10.4%)
ⓘ Screening estimate from a state-policy table — verify with the county assessor before closing.
Climate risk First Street
- Flood 1/10 Low FEMA zone X (unshaded) · 0% chance over 30 yrs
- Wildfire 1/10 Low
- Heat 3/10 Moderate 7 d/yr ≥101°F today · 18 d/yr by 30 yrs out
- Wind 2/10 Low 0% chance of damaging wind over 30 yrs
- Air quality 3/10 Moderate 3 unhealthy d/yr today · 5 by 30 yrs out
Nearby sold comps map
Loading sold comps map…
Walkable amenities ~0.75 mi
Loading nearby amenities…
Taxation est. · year 1
- Rental income
- $12,473
- − Mortgage interest
- −$6,716
- − Property taxes
- −$1,548
- − Insurance
- −$600
- − Repairs & maintenance
- −$998
- − Management
- −$998
- − Depreciation
- −$3,488
- Taxable loss
- −$1,874
- Est. tax savings @ 24.0%
- +$450
- After-tax cash flow
- $611/yr
For passive investors: Depreciation is non-cash, so a rental often shows a tax loss while cash-flowing — sheltering income. Rental losses are passive: they offset passive income freely, and up to $25,000/yr can offset ordinary (W-2) income if you actively participate and your MAGI is under $100k (phasing out to $0 by $150k); unused losses carry forward. On sale, claimed depreciation is recaptured at up to 25%, and gains may owe capital-gains tax (a 1031 exchange can defer both). Figures are a year-1 estimate at your 24.0% rate — not tax advice; consult a CPA.
Schools (NCES district)
- District
- Dayton City
- NCES district ID
- 3904384
- Math proficiency
- 12% ▼ -12.00%
- Reading proficiency
- 21% ▼ -11.00%
- Median HH income
- $28,688
- Composite
- 12.94/100
- National rank
- #9579
- State rank
- #641 of 656 in OH
Livability — Dayton
- Score
- 65/100
- State rank
- #716
- US rank
- #12895
Category grades
Schools grade is shown separately in the Schools card above.
Census & demographics
- Census place
- Dayton, OH
- County
- Montgomery County · 459,541 people
- City population
- 164,387
- Metro
- Dayton-Kettering, OH
- Population (ZIP)
- 24,411
- Household income
- $60,588
- Rent vs Own
- Severe rent burden
- 856.0
Population outlook (Montgomery County) Hauer SSP2
- Today (2025)
- 523,241 people
- By 2030
- 514,948 · -1.6%
- By 2040
- 493,378 · -5.7%
- By 2050
- 469,639 · -10.2%
- By 2075
- 418,360 · -20.0%
- By 2100
- 353,315 · -32.5%
Race, ethnicity, and origin ACS 2023
- Neighborhood character
- Predominantly White (83%)
- Race & ethnicity
- White 83% Black 7% Two or more races 6% Hispanic / Latino 3% Asian 3%
- Common ancestry
- Lithuanian 3% Slovak 2% Italian 2%
- Foreign-born
- 7% · Canada, China
- Languages at home
- 93% English-only · Other Indo-European 2% Spanish 2% Chinese 0%
Political lean MEDSL · Montgomery
- 2024 margin
- Toss-up / Even · D 49.8% · R 49.3%
- 2008→2024 swing
- -5.8pp toward R · 2008: 6.2pp · 2024: 0.5pp
- All cycles
- 2024: D+0.5 2020: D+2.2 2016: R+1.2 2012: D+3.1 2008: D+6.2
Not yet ingested
- Civics
- —
Market trends
- HPI YoY
- ▼ -192.56%
- Current HPI
- 241.6543
- Rent YoY
- ▲ 4.82%
- Metro
- Dayton-Kettering, OH
- State GDP YoY
- ▲ 1.98%
- F500 in state
- 48
Industry mix (Fortune 500 HQ in OH)
| Industry | F500 HQs | Revenue |
|---|---|---|
| Insurance | 3 | $145B |
|
||
| Industrial Machinery | 3 | $49B |
|
||
| Financial Services | 3 | $24B |
|
||
| Consumer Goods | 2 | $93B |
|
||
| Aerospace / Defense | 2 | $47B |
|
||
| Utilities | 2 | $33B |
|
||
Price history
+539.5% since first listed5 events — show timeline
- 2026-06-07 Pending — Dayton MLS
- 2026-05-19 Price Changed $119,900 Dayton MLS
- 2026-05-07 Listed $125,000 Dayton MLS
- 1999-04-15 Sold (Public Records) $46,000 Public Records
- 1985-02-20 Sold (Public Records) $18,750 Public Records
Property tax history
+1.5%/yrLatest (2025): $1,548 · -0.2% YoY. Source: county tax records.
Cash-flow waterfall
monthlySold comps — $/sqft
last 12 mo · ≤1 miLoading sold comps…