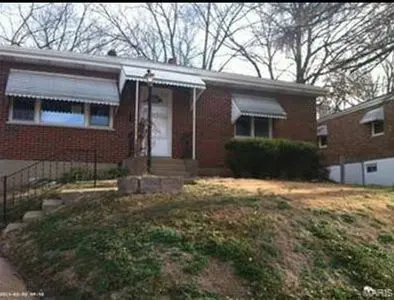
30 Jendale Ct · Jennings, MO
Flood risk 1/10 · Minimal
- FEMA flood zone
- X (unshaded)
- Chance of flooding over 30 yrs
- 0.0%
- Est. flood insurance / yr
- $473 – $860
Fire risk 1/10 · Minimal
- Est. fire insurance / yr
- $1,054 – $1,958
Heat risk 5/10 · Moderate
- Hot days now (above 107°F)
- 7 days/yr
- Hot days in 30 yrs
- 21 days/yr
Wind risk 2/10 · Minimal
- Chance of severe wind over 30 yrs
- 1.0%
Air-quality risk 4/10 · Minor
- Unhealthy air days now
- 4 days/yr
- Unhealthy air days in 30 yrs
- 5 days/yr
Risk factors via First Street. Map © Google.
Why this score? — see what drove the B- grade
The composite is a weighted blend of 9 inputs, each scored 0–100. Each bar is that input's sub-score; the figure is the points it added to the 100-point composite (weight × sub-score).
- Cash flow +28.1/30.0
- DSCR +10.0/10.0
- 1% rule +7.7/10.0
- Appreciation +6.9/10.0
- ARV discount +6.4/15.0
- Rent growth +3.7/5.0
- Livability +3.4/5.0
- Condition / age +2.5/5.0
- Schools +1.1/10.0
$99,000
🖨 Deal sheet 📄 Offer letter ✓ Due diligence
Listing remarks MLS
Cute 3 bedroom home with covered parking and a fenced yard. HUD acquired property. Bid Preference extended to Owner Occupants for first 30 days. First 10 days are sealed bids for Owner Occupants. Award may take place at conclusion of 10 day sealed bid period. Daily bids if not accepted at end of sealed bid period. All bidders welcome day 31 if not sold before. Bid deadline for Owner Occupants is March 23 , 2013 at 11:59 P.M. C.S.T. Property being sold AS IS. All utilities are turned OFF. Please use discretion when showing and bring a flashlight. Case #292-531390. FOR UTILITY TURN ONS, APPROVAL MUST BE GRANTED IN ADVANCE FROM HUD’S FIELD SERVICE MANAGER. IN CASES WHERE PLUMBING DEFICIENCIES EXIST, APPROVAL FOR WATER TURN-ON MAY BE DENIED
Key facts
- Full size bar
- Fireplace
- Built 1955
Tags
Neighborhood map
What this means for you Summary
Snapshot
- This is a 3-bed/1.5-bath single-family listed at $99k.
Deal economics
- At list price, monthly cash flow is $311 ($4k/yr) — positive.
- The deal already cash-flows at list — no discount required.
- Meets the 1% rule at list price ($1k rent vs $99k).
Location & tenants
- Location reads 67/100 on livability (#208 in MO) — a middle-class / working-renter tenant base. Strengths: cost of living A+, commute A-, housing A-; Watch: schools D-, crime F, amenities F.
- Jennings (suburban): math 8% / reading 20% proficiency, ranked #315 of 324 in MO (top 97%) — low school quality limits family demand, transient renter base, plan for 1-2y turnover; 86% free/reduced lunch — lower-income household profile, screen leases tightly.
- Market conditions: Rents rising fast (+5.0%/yr); 372 active listings in the ZIP; 40 comparable units currently listed for rent nearby; rentals at typical pace (median 24d on market — plan ~3-4 weeks tenant-placement turnaround); 40% of comp listings sitting > 30 days — soft ceiling on asking rent; lower-income renter base — watch delinquency; 920 units permitted in St. Louis County in 2024 (250 in 5+ unit buildings).
- This rent runs 37% of the median local income ($41k/yr) — at the standard rent-burdened threshold; future hikes will face affordability resistance.
Forward outlook
- In year one you build about $4k of equity ($684 loan paydown + $4k appreciation (3.8% local appreciation)).
- At projected returns (3.8% appreciation + 5.0% rent growth), your $28k cash investment doubles in ~4 years — after that, you're playing with house money.
- By year 8, paydown + projected appreciation supports a ~$33k cash-out refi (75% LTV) — recoverable capital for the next deal without selling this one.
Negotiation context
- Only 5 days on market — expect competitive offers; lowballing is unlikely to land.
- 2 sale attempts since 13y ago with the ask held roughly flat each time — persistent listings suggest the price (not the market) is what's stuck; bring a comps-based counter.
- Current owner paid $75k; 32% above their basis — modest negotiation headroom, anchor on the comps not their cost.
Risks & watch-outs
- Watch-outs: built in 1955 — expect roof / HVAC / electrical / plumbing capex.
- Climate carrying-cost: extreme-heat days projected 7→21/yr by 2055 (HVAC capex compounding) — expect insurance premiums to compound above CPI over the hold.
Questions for the listing agent
- Built in 1955 — when were the roof, HVAC, electrical panel, plumbing, and water heater last replaced?
- Is there a deadline driving the sale (1031 exchange, divorce, estate, relocation)? That informs how much negotiation room exists.
- Schools are D-rated, which usually means shorter tenancies and higher turnover. Who's the typical renter profile here, and what's been the actual vacancy rate?
- Crime grade is F in this area — have there been break-ins, vandalism, or insurance claims at this property in the last 3 years? What carrier currently insures it and at what premium?
- What's the average days-on-market for RENTAL listings here right now (not sales)? A rising rental-DOM trend means longer vacancies and softer asking-rent achievability than the comps imply.
- What's the recent tenant-quality profile in this submarket — average credit score on applications, eviction rate, late-payment / NSF rate, and stable-employment percentage? A property-management company in the area should have these aggregated.
- How much new for-sale + rental construction is in the pipeline within 1–3 miles? Heavy new supply typically softens prices + rents 12–24 months out; constrained supply supports both.
Investment metrics
- 1% rule
- 1.27% ✓
- Cap rate
- 10.06%
- Cash-on-cash
- 13.47%
- DSCR
- 1.60
- GRM
- 6.6
CMA / ARV
- ARV (on-the-fly)
- $96,538
- Comps found
- 12
Show comp detail 12 sales within ~0.75 mi
| Address | Dist | Beds/Ba | Sqft | Sold | Price | $/sf | Match |
|---|---|---|---|---|---|---|---|
| 8871 Boyce Pl | 0.24mi | 3/2.0 | 1,250 (+2%) | 4mo | $149,900 | $120 | 80 |
| 8870 Saint Cyr Dr | 0.15mi | 3/1.0 | 1,131 (-7%) | 2mo | $39,900 | $35 | 77 |
| 5 Jendale Ct | 0.16mi | 4/1.0 (+1) | 1,267 (+4%) | 6mo | $69,995 | $55 | 74 |
| 8 Jendale Ct | 0.14mi | 2/2.0 (-1) | 1,127 (-8%) | 4mo | $125,000 | $111 | 70 |
| 2035 Sun Valley Dr | 0.51mi | 3/2.0 | 1,170 (-4%) | 4mo | $68,900 | $59 | 64 |
| 2538 Oepts Ave | 0.43mi | 3/1.5 | 1,144 (-6%) | 7mo | $40,000 | $35 | 63 |
| 2327 Switzer Ave | 0.58mi | 4/1.0 (+1) | 1,201 (-2%) | 7mo | $45,000 | $37 | 57 |
| 9305 Scottdale Ave | 0.71mi | 3/2.0 | 1,280 (+5%) | 3mo | $60,000 | $47 | 55 |
| 2568 Dorwood Dr | 0.48mi | 2/1.0 (-1) | 1,336 (+9%) | 4mo | $105,000 | $79 | 52 |
| 8819 May Ave | 0.46mi | 2/1.0 (-1) | 1,074 (-12%) | 0mo | $100,000 | $93 | 51 |
| 2044 Hildred Ave | 0.58mi | 4/1.0 (+1) | 1,136 (-7%) | 6mo | $115,000 | $101 | 49 |
| 9157 Victory Ave | 0.55mi | 4/2.5 (+1) | 1,127 (-8%) | 5mo | $129,900 | $115 | 48 |
Match score weights: distance 35% · size 25% · config 20% · recency 20%. Top-matched comps best support the ARV.
Projected returns pro-forma
3.79% appreciation · 4.97% rent growth · sell at horizon
- IRR
- 23.2%
- Equity multiple
- 2.39×
- Total profit
- $38,508
- Equity at exit
- $48,984
- IRR
- 24.4%
- Equity multiple
- 4.91×
- Total profit
- $108,358
- Equity at exit
- $79,167
Cash invested: $27,720 (down + closing). Projections, not guarantees.
Landlord ↔ Tenant lean methodology
- Overall (STATE)
- 81 Strongly Landlord-Friendly
- State Missouri
- 81 Strongly Landlord-Friendly · R+10
- County
- — inherits STATE
- City
- — inherits STATE
ZIP-level market 63136
- Home prices YoY
- 0.9%
- Rents YoY
- 5.0%
- Active inventory
- 372
- Price-to-rent
- 6.6×
Monthly cashflow live
- Estimated rent
- $1,259 high interval (Pro) →
- Mortgage (P&I)
- −$519
- Tax from tax record
- −$123 /mo · $1,480/yr
- Insurance
- −$41
- HOA
- −$0
- Vacancy / Maint / Mgmt
- −$264
- Net cashflow
- $311
Break-even live
UW: 25.0% down · 7.5% · 30yr · 1.5% tax · 5.0% vac · 8.0% maint · 8.0% mgmt
Financing live
Cash to close
- Down payment
- $24,750
- Closing costs
- $2,970
- Reserves months
- —
- Total cash needed
- —
Loan-product check · same deal, 3 products live
Conventional
25% down · 7.5% · 30yr
- Down + closing
- —
- Monthly P&I
- —
- Monthly cashflow
- —
- DSCR
- —
- Eligible?
- —
Personal DTI + credit; lowest rate.
DSCR
20% down · 8.5% · 30yr
- Down + closing
- —
- Monthly P&I
- —
- Monthly cashflow
- —
- DSCR
- —
- Eligible?
- —
No personal income docs; deal must DSCR.
Hard money
10% down · 12.0% · 12mo
- Down + closing
- —
- Monthly P&I
- —
- Monthly cashflow
- —
- DSCR
- —
- Eligible?
- —
Short-term bridge; refi at stabilization.
Rent comps 40 comps
| Address | Beds | Baths | Sqft | Rent | $/sqft | DOM | Units | Dist |
|---|---|---|---|---|---|---|---|---|
| 7 Lamar Dr Saint Louis, MO | 3.0 | 1.0 | 894 | $1,200 | $1.34 | 17d | 1 | 0.13mi |
| 3 Pohlman Ln Saint Louis, MO | 2.0 | 1.0 | 704 | $1,000 | $1.42 | 16d | 1 | 0.25mi |
| 8720 Akins Dr Saint Louis, MO | 2.0 | 1.0 | 1012 | $1,150 | $1.14 | 23d | 1 | 0.42mi |
| 8817 Shady Grove Ave Saint Louis, MO | 2.0 | 1.0 | 1085 | $1,075 | $0.99 | 23d | 1 | 0.42mi |
| 2617 Hord Ave Saint Louis, MO | 2.0 | 1.0 | 800 | $775 | $0.97 | 3d | 1 | 0.49mi |
| 2415 Shirley Ave Saint Louis, MO | 3.0 | 1.0 | 990 | $1,450 | $1.46 | 23d | 1 | 0.51mi |
| 2427 Switzer Ave Saint Louis, MO | 3.0 | 1.0 | 1008 | $1,300 | $1.29 | 43d | 1 | 0.56mi |
| 8908 Scottdale Ave Jennings, MO | 2.0 | 1.0 | 790 | $1,000 | $1.27 | 43d | 1 | 0.56mi |
| 2527 Switzer Ave Saint Louis, MO | 3.0 | 1.0 | 888 | $1,135 | $1.28 | 16d | 1 | 0.59mi |
| 2546 Main St Saint Louis, MO | 4.0 | 1.0 | 984 | $1,269 | $1.29 | 43d | 1 | 0.64mi |
| 2623 Avie Dr Saint Louis, MO | 3.0 | 2.0 | 921 | $1,350 | $1.47 | 43d | 1 | 0.72mi |
| 2056 Coleridge Dr Saint Louis, MO | 3.0 | 1.0 | 949 | $1,195 | $1.26 | 23d | 1 | 0.74mi |
| 2022 McLaran Ave Saint Louis, MO | 3.0 | 2.0 | 1181 | $1,593 | $1.35 | 14d | 1 | 0.76mi |
| 8347 Eton Pl Saint Louis, MO | 2.0 | 1.0 | 750 | $1,075 | $1.43 | 43d | 1 | 0.76mi |
| 8344 Eton Pl Saint Louis, MO | 2.0 | 1.0 | 750 | $895 | $1.19 | 3d | 1 | 0.77mi |
| 2152 Nemnich Rd Saint Louis, MO | 2.0 | 1.5 | 1030 | $1,100 | $1.07 | 43d | 1 | 0.80mi |
| 9418 Pattonwood Dr Saint Louis, MO | 2.0 | 2.0 | 982 | $1,500 | $1.53 | 23d | 1 | 0.82mi |
| 8527 Dianthus Ln Saint Louis, MO | 3.0 | 1.0 | 976 | $1,295 | $1.33 | 43d | 1 | 0.84mi |
| 9547 Glen Owen Dr Saint Louis, MO | 2.0 | 1.0 | 923 | $985 | $1.07 | 23d | 1 | 0.85mi |
| 1942 Damato Ct Saint Louis, MO | 2.0 | 1.0 | 905 | $1,100 | $1.22 | 43d | 1 | 0.86mi |
| 8502 Dianthus Ln Saint Louis, MO | 2.0 | 1.0 | 1072 | $1,175 | $1.10 | 23d | 1 | 0.91mi |
| 7205 Calvin Ave Saint Louis, MO | 3.0 | 1.0 | 832 | $750 | $0.90 | 43d | 1 | 0.94mi |
| 2008 Kappel Dr Saint Louis, MO | 3.0 | 1.0 | 858 | $1,175 | $1.37 | 23d | 1 | 0.99mi |
| 9709 Balboa Dr Saint Louis, MO | 3.0 | 1.0 | 1000 | $1,600 | $1.60 | 43d | 1 | 0.99mi |
| 1225 Newark Dr Saint Louis, MO | 3.0 | 2.0 | 944 | $1,400 | $1.48 | 3d | 1 | 1.00mi |
| 7142 Lamont Dr Saint Louis, MO | 2.0 | 1.0 | 750 | $1,100 | $1.47 | 17d | 1 | 1.02mi |
| 7441 Calvin Ave Saint Louis, MO | 3.0 | 1.0 | 1068 | $1,350 | $1.26 | 12d | 1 | 1.02mi |
| 7426 Calvin Ave Saint Louis, MO | 2.0 | 1.0 | 1100 | $1,125 | $1.02 | 17d | 1 | 1.04mi |
| 9812 Balboa Dr Saint Louis, MO | 4.0 | 2.0 | 1500 | $1,495 | $1.00 | 21d | 1 | 1.10mi |
| 5640 Sapphire Ave Saint Louis, MO | 2.0 | 1.0 | 900 | $1,100 | $1.22 | 43d | 1 | 1.10mi |
| 5615 Beldon Dr Saint Louis, MO | 2.0 | 1.0 | 850 | $950 | $1.12 | 43d | 1 | 1.12mi |
| 9823 Winkler Dr Saint Louis, MO | 2.0 | 1.0 | 788 | $900 | $1.14 | 43d | 1 | 1.12mi |
| 9827 Winkler Dr Saint Louis, MO | 3.0 | 1.0 | 864 | $1,450 | $1.68 | 7d | 1 | 1.13mi |
| 7120 Greenhaven Dr Saint Louis, MO | 3.0 | 2.0 | 1131 | $1,050 | $0.93 | 23d | 1 | 1.16mi |
| 5955 Floy Ave Saint Louis, MO | 2.0 | 1.0 | 1032 | $1,050 | $1.02 | 2d | 1 | 1.16mi |
| 1550 Northwinds Estates Dr St. Louis, MO | 1.0–2.0 | 1.0–1.5 | 877 | $1,050 | $1.20 | 43d | 1 | 1.17mi |
| 9744 Lanier Dr Saint Louis, MO | 3.0 | 1.0 | 1014 | $1,345 | $1.33 | 43d | 1 | 1.17mi |
| 5613 Statler Ave Saint Louis, MO | 2.0 | 1.0 | 864 | $1,300 | $1.50 | 4d | 1 | 1.17mi |
| 9723 Portage Dr Saint Louis, MO | 3.0 | 1.0 | 1014 | $1,450 | $1.43 | 7d | 1 | 1.18mi |
| 5637 Jennings Station Rd Saint Louis, MO | 3.0 | 1.0 | 1116 | $895 | $0.80 | 43d | 1 | 1.20mi |
Listing history 9 events
-
2026-06-18days on market $99,000 Active 5 DOM
-
2026-06-17days on market $99,000 Active 4 DOM
-
2026-06-16days on market $99,000 Active 3 DOM
-
2026-06-15days on market $99,000 Active 2 DOM
-
2026-06-13days on market $99,000 Active 1 DOM
-
2026-06-09days on market $99,000 Active 4 DOM
-
2026-06-08days on market $99,000 Active 3 DOM
-
2026-06-07remarks 116-char remark
-
2026-06-07$99,000 Active 2 DOM
ⓘ Source: listings_history table (triggers on properties + properties_extension) + one-shot
backfill from property_details.listing_events for pre-trigger history.
Tax reassessment forecast MO · Resets to sale price
- Current annual tax
- $1,480 · $123/mo
- Projected year-2 tax
- $1,480 · $123/mo
- Expected delta
- $0/yr ($0/mo · 0.0%)
ⓘ Screening estimate from a state-policy table — verify with the county assessor before closing.
Climate risk First Street
- Flood 1/10 Low FEMA zone X (unshaded) · 0% chance over 30 yrs
- Wildfire 1/10 Low
- Heat 5/10 Major 7 d/yr ≥107°F today · 21 d/yr by 30 yrs out
- Wind 2/10 Low 100% chance of damaging wind over 30 yrs
- Air quality 4/10 Moderate 4 unhealthy d/yr today · 5 by 30 yrs out
Nearby sold comps map
Loading sold comps map…
Walkable amenities ~0.75 mi
Loading nearby amenities…
Taxation est. · year 1
- Rental income
- $15,112
- − Mortgage interest
- −$5,546
- − Property taxes
- −$1,480
- − Insurance
- −$495
- − Repairs & maintenance
- −$1,209
- − Management
- −$1,209
- − Depreciation
- −$2,880
- Taxable income
- $2,294
- Est. tax owed @ 24.0%
- −$551
- After-tax cash flow
- $3,183/yr
For passive investors: Depreciation is non-cash, so a rental often shows a tax loss while cash-flowing — sheltering income. Rental losses are passive: they offset passive income freely, and up to $25,000/yr can offset ordinary (W-2) income if you actively participate and your MAGI is under $100k (phasing out to $0 by $150k); unused losses carry forward. On sale, claimed depreciation is recaptured at up to 25%, and gains may owe capital-gains tax (a 1031 exchange can defer both). Figures are a year-1 estimate at your 24.0% rate — not tax advice; consult a CPA.
Schools (NCES district)
- District
- Jennings
- NCES district ID
- 2916290
- Math proficiency
- 8% ▼ -16.00%
- Reading proficiency
- 20% ▼ -4.00%
- Median HH income
- $30,595
- Composite
- 11.04/100
- National rank
- #9739
- State rank
- #315 of 324 in MO
Livability — Jennings
- Score
- 67/100
- State rank
- #208
- US rank
- #10499
Category grades
Schools grade is shown separately in the Schools card above.
Census & demographics
- Census place
- Jennings, MO
- County
- Saint Louis County · 888,823 people
- Metro
- St. Louis, MO-IL
- Population (ZIP)
- 40,929
- Household income
- $41,154
- Rent vs Own
- Severe rent burden
- 3085.0
Population outlook (St. Louis County) Hauer SSP2
- Today (2025)
- 1,025,227 people
- By 2030
- 1,028,023 · +0.3%
- By 2040
- 1,020,940 · -0.4%
- By 2050
- 1,007,280 · -1.8%
- By 2075
- 987,277 · -3.7%
- By 2100
- 921,984 · -10.1%
Race, ethnicity, and origin ACS 2023
- Neighborhood character
- Predominantly Black (90%)
- Race & ethnicity
- Black 90% White 5% Two or more races 3%
- Foreign-born
- 1% · Canada
Political lean MEDSL · St. Louis
- 2024 margin
- Strong D (+23.4) · D 60.8% · R 37.4% · Other 1.7%
- 2008→2024 swing
- +3.5pp toward D · 2008: 19.9pp · 2024: 23.4pp
- All cycles
- 2024: D+23.4 2020: D+24.0 2016: D+16.2 2012: D+13.7 2008: D+19.9
Not yet ingested
- Civics
- —
Market trends
- HPI YoY
- ▲ 3.79%
- Current HPI
- 420.28
- Rent YoY
- ▲ 4.97%
- Metro
- St. Louis, MO-IL
- State GDP YoY
- ▲ 1.84%
- F500 in state
- 20
Industry mix (Fortune 500 HQ in MO)
| Industry | F500 HQs | Revenue |
|---|---|---|
| Healthcare | 1 | $163B |
|
||
| Insurance | 1 | $21B |
|
||
| Industrial Technology | 1 | $17B |
|
||
| Retail | 1 | $16B |
|
||
| Industrial Distribution | 1 | $10B |
|
||
| Utilities | 1 | $9B |
|
||
Price history
+32.0% since first listed4 events — show timeline
- 2026-06-06 Listed $99,000 FSBO.com
- 2013-04-05 Sold (MLS) — MARIS as Distributed by MLS Grid
- 2013-02-23 Listed $24,500 MARIS as Distributed by MLS Grid
- 2004-10-29 Sold (Public Records) $75,000 Public Records
Property tax history
+1.5%/yrLatest (2022): $1,480 · +1.5% YoY. Source: county tax records.
Cash-flow waterfall
monthlySold comps — $/sqft
last 12 mo · ≤1 miLoading sold comps…