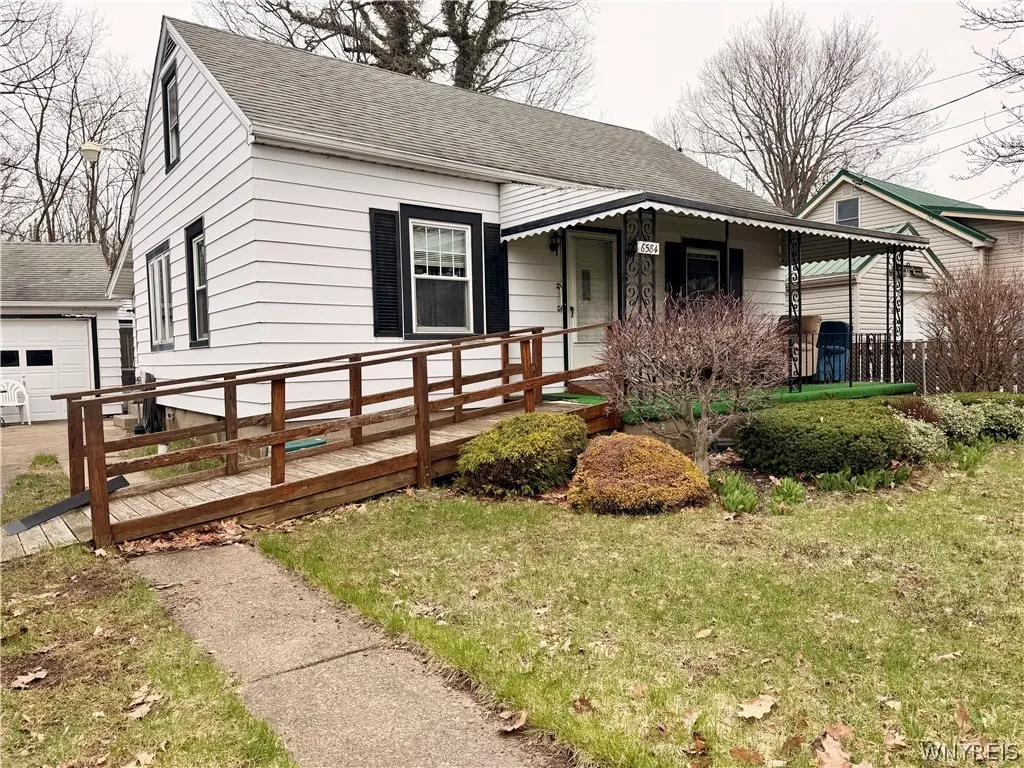
6584 Hamilton Dr · Highland-on-the-Lake, NY
Flood risk 1/10 · Minimal
- FEMA flood zone
- X (unshaded)
- Chance of flooding over 30 yrs
- 0.0%
- Est. flood insurance / yr
- $473 – $860
Fire risk 1/10 · Minimal
- Est. fire insurance / yr
- $691 – $1,283
Heat risk 2/10 · Minimal
- Hot days now (above 93°F)
- 7 days/yr
- Hot days in 30 yrs
- 16 days/yr
Wind risk 1/10 · Minimal
- Chance of severe wind over 30 yrs
- —
Air-quality risk 3/10 · Minor
- Unhealthy air days now
- 2 days/yr
- Unhealthy air days in 30 yrs
- 5 days/yr
Risk factors via First Street. Map © Google.
Why this score? — see what drove the B- grade
The composite is a weighted blend of 9 inputs, each scored 0–100. Each bar is that input's sub-score; the figure is the points it added to the 100-point composite (weight × sub-score).
- Cash flow +30.0/30.0
- 1% rule +10.0/10.0
- DSCR +10.0/10.0
- ARV discount +7.5/15.0
- Schools +4.1/10.0
- Rent growth +2.5/5.0
- Livability +2.5/5.0
- Condition / age +2.5/5.0
- Appreciation +0.0/10.0
$99,900
🖨 Deal sheet (PDF) 📄 Offer letter ✓ Due diligence
Listing remarks
Derby Cape Cod offers 4 bedrooms, 2 car garage with sunroom on a fenced lot within minutes from the beach! Full basement. Kitchen offers a pass through to dining area which leads to fenced yard, 2 car garage & 3 season room. Living room offers hardwood flooring. Two bedrooms on the first floor (one has washer & dryer hook ups). Two bedrooms upstairs with built in cabinets. Some replacement windows. So much potential. Water damage occurred on the wall in the kitchen, and the floor has been removed as shown in the pictures. Mold remediation has been completed by Serv Pro. Sellers are requesting cash only. No negotiations until Tuesday, 4/14/26 at 5:00 PM.
Key facts
- 6,708 sq ft lot
- 2 garage spots
- Built 1947
Property features AI
Exterior
- Parking: Detached garage with garage door opener and electricity; 2-car garage
- Utilities: Electricity connected (circuit breakers); Public water connected; Sewer connected; Cable available; High-speed internet available
- Home design: Single-story appearance (listed as 1 story total); Resale property; Rectangular residential lot with 58 x 115 dimensions; City street frontage
- Construction: Vinyl siding exterior; Architectural shingle roof; Block foundation; Existing (previously built) structure
- Exterior features: Concrete driveway; Enclosed porch and open porch; Fully fenced yard; Porch
Interior
- Kitchen: Dishwasher; Microwave; Appliances negotiable
- Bedrooms: Two main-level bedrooms; Four additional bedrooms on upper levels (total 6 bedrooms)
- Flooring: Hardwood flooring; Varies by room
- Bathrooms: One full bathroom (main level)
- Heating & cooling: Gas heating with baseboard and hot water systems
- Interior features: Ceiling fans; Eat-in kitchen; Separate/formal living room; Bedroom on main level; Full basement with sump pump
- Laundry & utility: Laundry located on main level and in basement; Gas water heater
Neighborhood map
What this means for you Summary
Snapshot
- This is a 2-bed/1.0-bath single-family listed at $100k.
Deal economics
- At list price, monthly cash flow is $401 ($5k/yr) — positive.
- The deal already cash-flows at list — no discount required.
- Meets the 1% rule at list price ($2k rent vs $100k).
- Cap rate 11.1% vs local median 2.3% in Highland-on-the-Lake — top-decile yield for the area; either an underpriced asset or a hidden risk that comps aren't pricing in. Stress-test before assuming the spread holds.
Location & tenants
- Location reads: area grade B — affects rentability + tenant quality, not the cash-flow math above.
- Evans-Brant Central School District (Lake Shore) (suburban): math 43% / reading 51% proficiency, ranked #424 of 590 in NY (top 72%) — families likely to look elsewhere, expect single-tenant / working-renter base with shorter leases.
- Zoned schools: Highland Elementary School (math 52% / reading 62%, grade C+, #842 of 2,108 statewide, top 43%, 356 students, 42% FRL); William G Houston Middle School (math 15% / reading 43%, grade F, #566 of 729 statewide, top 78%, 503 students, 0% FRL); Lake Shore Senior High School (math 92% / reading 95%, grade A+, #131 of 1,100 statewide, top 13%, 671 students, 47% FRL).
- Zoned-school proficiency averages 60% at this address vs 47% district-wide (+13 pts) — the actual schools serving this property are materially stronger than the Evans-Brant Central School District (Lake Shore) average implies; a family-tenant draw the district grade alone would hide.
- Market conditions: 47 active listings in the ZIP; 1 comparable units currently listed for rent nearby; 1,244 units permitted in Erie County in 2024 (563 in 5+ unit buildings).
Forward outlook
- Local home prices are declining (-3.0%/yr); year-one equity from $691 of loan paydown is wiped out by about $3k of value loss. Plan a longer hold.
- At projected returns (-3.0% appreciation + 3.0% rent growth), your $28k cash investment doubles in ~7 years — after that, you're playing with house money.
Negotiation context
- Only 9 days on market — expect competitive offers; lowballing is unlikely to land.
Risks & watch-outs
- Watch-outs: property tax is 3.6% of price; built in 1947 — expect roof / HVAC / electrical / plumbing capex.
Questions for the listing agent
- Built in 1947 — when were the roof, HVAC, electrical panel, plumbing, and water heater last replaced?
- Property tax is high relative to price — has the assessment been appealed recently, and will the sale trigger a re-assessment?
- Is there a deadline driving the sale (1031 exchange, divorce, estate, relocation)? That informs how much negotiation room exists.
- What's the average days-on-market for RENTAL listings here right now (not sales)? A rising rental-DOM trend means longer vacancies and softer asking-rent achievability than the comps imply.
- What's the recent tenant-quality profile in this submarket — average credit score on applications, eviction rate, late-payment / NSF rate, and stable-employment percentage? A property-management company in the area should have these aggregated.
- How much new for-sale + rental construction is in the pipeline within 1–3 miles? Heavy new supply typically softens prices + rents 12–24 months out; constrained supply supports both.
Investment metrics
- 1% rule
- 1.60% ✓
- Cap rate
- 11.11%
- Cash-on-cash
- 17.20%
- DSCR
- 1.77
- GRM
- 5.2
CMA / ARV
- ARV (on-the-fly)
- $209,922
- Comps found
- 12
Show comp detail 12 sales within ~0.75 mi
| Address | Dist | Beds/Ba | Sqft | Sold | Price | $/sf | Match |
|---|---|---|---|---|---|---|---|
| 6692 Prescott Dr | 0.26mi | 2/1.5 | 1,200 (+1%) | 11mo | $150,000 | $125 | 75 |
| 6689 Wayne Dr | 0.21mi | 3/2.0 (+1) | 1,276 (+8%) | 5mo | $231,000 | $181 | 64 |
| 1350 Peppertree Dr | 0.36mi | 3/2.0 (+1) | 1,214 (+2%) | 8mo | $230,000 | $189 | 64 |
| 6665 Wellington Dr | 0.17mi | 3/1.0 (+1) | 1,035 (-13%) | 6mo | $165,000 | $159 | 60 |
| 6795 Prescott Dr | 0.44mi | 2/1.0 | 1,072 (-10%) | 5mo | $180,000 | $168 | 59 |
| 6910 Hamilton Dr | 0.60mi | 3/1.0 (+1) | 1,116 (-6%) | 9mo | $230,000 | $206 | 50 |
| 6689 Lake Shore Rd | 0.39mi | 3/2.0 (+1) | 1,248 (+5%) | 21mo | $230,000 | $184 | 47 |
| 6950 Wellington Dr | 0.67mi | 3/1.0 (+1) | 1,240 (+5%) | 13mo | $213,000 | $172 | 46 |
| 1351 Peppertree Dr | 0.34mi | 3/1.0 (+1) | 1,356 (+14%) | 17mo | $175,000 | $129 | 41 |
| 6730 Grissom Ct | 0.42mi | 3/2.0 (+1) | 1,356 (+14%) | 10mo | $273,000 | $201 | 39 |
| 6850 Chaffee Ct | 0.74mi | 3/1.0 (+1) | 1,280 (+8%) | 14mo | $227,000 | $177 | 35 |
| 1305 Crescent Dr | 0.74mi | 3/2.5 (+1) | 1,304 (+10%) | 20mo | $230,000 | $176 | 21 |
Match score weights: distance 35% · size 25% · config 20% · recency 20%. Top-matched comps best support the ARV.
Projected returns pro-forma
-3.0% appreciation · 3.0% rent growth · sell at horizon
- IRR
- 8.6%
- Equity multiple
- 1.34×
- Total profit
- $9,482
- Equity at exit
- $14,895
- IRR
- 17.9%
- Equity multiple
- 2.49×
- Total profit
- $41,677
- Equity at exit
- $8,638
Cash invested: $27,972 (down + closing). Projections, not guarantees.
Landlord ↔ Tenant lean methodology
- Overall (STATE)
- 15 Strongly Tenant-Friendly
- State New York
- 15 Strongly Tenant-Friendly · D+10
- County
- — inherits STATE
- City
- — inherits STATE
ZIP-level market 14047
- Home prices YoY
- -17.0%
- Active inventory
- 47
- Price-to-rent
- 5.2×
Monthly cashflow live
- Estimated rent
- $1,603 medium interval (Pro) →
- Mortgage (P&I)
- −$524
- Tax from tax record
- −$300 /mo · $3,602/yr
- Insurance
- −$42
- HOA
- −$0
- Vacancy / Maint / Mgmt
- −$337
- Net cashflow
- $401
Break-even live
Sensitivity live
| Price | -10% $458 | -5% $429 | +0% $401 | +5% $373 | +10% $344 |
|---|---|---|---|---|---|
| Rent | -10% $274 | -5% $338 | +0% $401 | +5% $464 | +10% $528 |
| Rate | -1.0pp $451 | -0.5pp $426 | base $401 | +0.5pp $375 | +1.0pp $349 |
UW: 25.0% down · 7.5% · 30yr · 1.5% tax · 5.0% vac · 8.0% maint · 8.0% mgmt
Financing live
Cash to close
- Down payment
- $24,975
- Closing costs
- $2,997
- Reserves months
- —
- Total cash needed
- —
Loan-product check · same deal, 3 products live
Conventional
25% down · 7.5% · 30yr
- Down + closing
- —
- Monthly P&I
- —
- Monthly cashflow
- —
- DSCR
- —
- Eligible?
- —
Personal DTI + credit; lowest rate.
DSCR
20% down · 8.5% · 30yr
- Down + closing
- —
- Monthly P&I
- —
- Monthly cashflow
- —
- DSCR
- —
- Eligible?
- —
No personal income docs; deal must DSCR.
Hard money
10% down · 12.0% · 12mo
- Down + closing
- —
- Monthly P&I
- —
- Monthly cashflow
- —
- DSCR
- —
- Eligible?
- —
Short-term bridge; refi at stabilization.
Rent comps 1 comps
| Address | Beds | Baths | Sqft | Rent | $/sqft | DOM | Units | Dist |
|---|---|---|---|---|---|---|---|---|
| 7008 Erie Rd Derby, NY | 1.0–4.0 | 1.0 | 685 | $1,603 | $2.34 | 3d | 9 | 1.04mi |
Listing history 2 events
-
2026-04-16status Pending
-
2026-04-07$99,900 Active
ⓘ Source: listings_history table (triggers on properties + properties_extension) + one-shot
backfill from property_details.listing_events for pre-trigger history.
Tax reassessment forecast NY · Partial reset (capped growth)
- Current annual tax
- $3,602 · $300/mo
- Projected year-2 tax
- $3,602 · $300/mo
- Expected delta
- $0/yr ($0/mo · 0.0%)
ⓘ Screening estimate from a state-policy table — verify with the county assessor before closing.
Climate risk First Street
- Flood 1/10 Low FEMA zone X (unshaded) · 0% chance over 30 yrs
- Wildfire 1/10 Low
- Heat 2/10 Low 7 d/yr ≥93°F today · 16 d/yr by 30 yrs out
- Wind 1/10 Low
- Air quality 3/10 Moderate 2 unhealthy d/yr today · 5 by 30 yrs out
Nearby sold comps map
Loading sold comps map…
Walkable amenities ~0.75 mi
Loading nearby amenities…
Taxation est. · year 1
- Rental income
- $19,240
- − Mortgage interest
- −$5,596
- − Property taxes
- −$3,602
- − Insurance
- −$500
- − Repairs & maintenance
- −$1,539
- − Management
- −$1,539
- − Depreciation
- −$2,906
- Taxable income
- $3,558
- Est. tax owed @ 24.0%
- −$854
- After-tax cash flow
- $3,958/yr
For passive investors: Depreciation is non-cash, so a rental often shows a tax loss while cash-flowing — sheltering income. Rental losses are passive: they offset passive income freely, and up to $25,000/yr can offset ordinary (W-2) income if you actively participate and your MAGI is under $100k (phasing out to $0 by $150k); unused losses carry forward. On sale, claimed depreciation is recaptured at up to 25%, and gains may owe capital-gains tax (a 1031 exchange can defer both). Figures are a year-1 estimate at your 24.0% rate — not tax advice; consult a CPA.
Schools (NCES district)
- District
- Evans-Brant Central School District (Lake Shore)
- NCES district ID
- 3616560
- Math proficiency
- 43% ▼ -9.00%
- Reading proficiency
- 51% ▲ 6.00%
- Median HH income
- $56,433
- Composite
- 40.89/100
- National rank
- #3619
- State rank
- #424 of 590 in NY
Livability — Highland-on-the-Lake
No livability data for this city. (Only ~50 U.S. cities are tracked.)
Census & demographics
- Census place
- Highland-on-the-Lake, NY
- Population (ZIP)
- 6,072
Population outlook (Erie County) Hauer SSP2
- Today (2025)
- 933,037 people
- By 2030
- 935,181 · +0.2%
- By 2040
- 928,531 · -0.5%
- By 2050
- 905,725 · -2.9%
- By 2075
- 834,037 · -10.6%
- By 2100
- 708,033 · -24.1%
Race, ethnicity, and origin ACS 2023
- Neighborhood character
- Predominantly White (94%)
- Race & ethnicity
- White 94% Hispanic / Latino 3% Two or more races 3%
- Common ancestry
- Romanian 19% Scottish 6% Lithuanian 3%
- Foreign-born
- 2% · Canada
- Languages at home
- 98% English-only · Russian/Polish/Slavic 1%
Political lean MEDSL · Erie
- 2024 margin
- Lean D (+9.7) · D 54.8% · R 45.2%
- 2008→2024 swing
- -7.9pp toward R · 2008: 17.5pp · 2024: 9.7pp
- All cycles
- 2024: D+9.7 2020: D+14.7 2016: D+4.8 2012: D+15.6 2008: D+17.5
Not yet ingested
- Civics
- —
Market trends
- HPI YoY
- ▼ -68.60%
- Current HPI
- 334.5151
- Rent YoY
- —
- Metro
- —
- State GDP YoY
- ▲ 2.60%
- F500 in state
- 92
Industry mix (Fortune 500 HQ in NY)
| Industry | F500 HQs | Revenue |
|---|---|---|
| Financial Services | 10 | $950B |
|
||
| Consumer Goods | 9 | $162B |
|
||
| Insurance | 4 | $225B |
|
||
| Telecommunications | 2 | $144B |
|
||
| Pharmaceuticals | 2 | $112B |
|
||
| Media / Entertainment | 2 | $69B |
|
||
Price history
2 events — show timeline
- 2026-04-16 Pending — WNYREIS
- 2026-04-07 Listed $99,900 WNYREIS
Property tax history
+8.3%/yrLatest (2025): $3,602 · +1.3% YoY. Source: county tax records.
Cash-flow waterfall
monthlySold comps — $/sqft
last 12 mo · ≤1 miLoading sold comps…