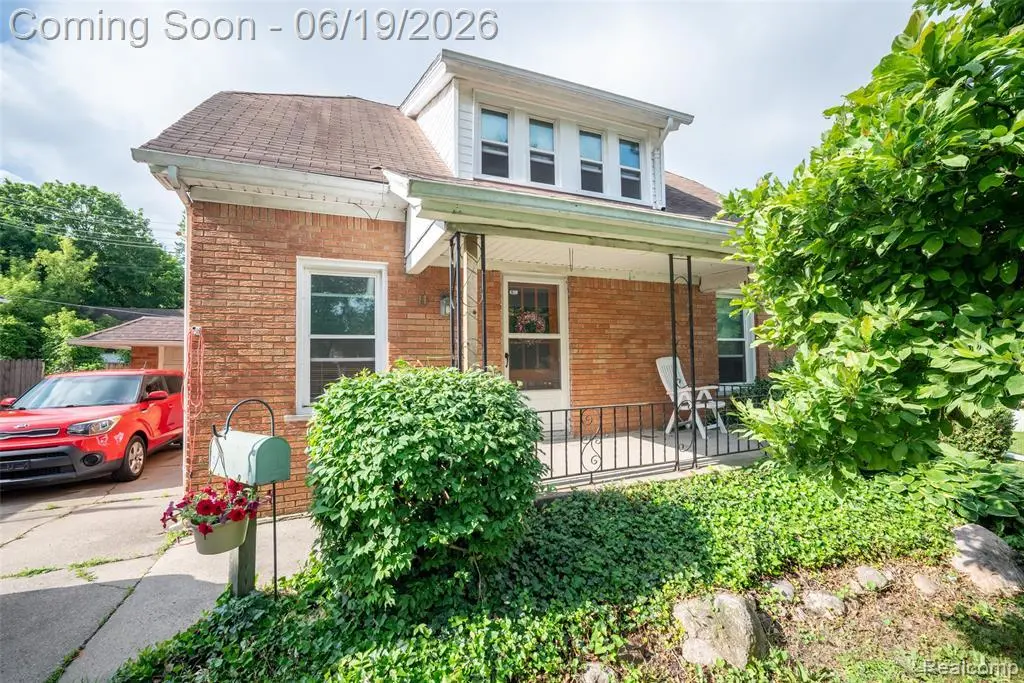
11 Leonore St · Mount Clemens, MI
Flood risk 1/10 · Minimal
- FEMA flood zone
- X (unshaded)
- Chance of flooding over 30 yrs
- 0.0%
- Est. flood insurance / yr
- $473 – $860
Fire risk 1/10 · Minimal
- Est. fire insurance / yr
- $784 – $1,456
Heat risk 3/10 · Minor
- Hot days now (above 97°F)
- 7 days/yr
- Hot days in 30 yrs
- 15 days/yr
Wind risk 1/10 · Minimal
- Chance of severe wind over 30 yrs
- —
Air-quality risk 4/10 · Minor
- Unhealthy air days now
- 4 days/yr
- Unhealthy air days in 30 yrs
- 6 days/yr
Risk factors via First Street. Map © Google.
Why this score? — see what drove the C- grade
The composite is a weighted blend of 9 inputs, each scored 0–100. Each bar is that input's sub-score; the figure is the points it added to the 100-point composite (weight × sub-score).
- Cash flow +16.6/30.0
- ARV discount +13.8/15.0
- DSCR +5.2/10.0
- Appreciation +5.0/10.0
- 1% rule +4.8/10.0
- Livability +3.9/5.0
- Rent growth +2.5/5.0
- Condition / age +2.5/5.0
- Schools +0.6/10.0
$150,000
🖨 Deal sheet 📄 Offer letter ✓ Due diligence
Listing remarks
Charming brick home loaded with character and timeless appeal! This well-maintained 3-bedroom, 2-bath residence offers beautiful hardwood flooring, abundant natural light, and classic architectural details throughout. The spacious living and dining areas create a warm and inviting atmosphere, while large windows fill the home with natural sunlight. The generously sized kitchen provides ample cabinet and counter space, stainless steel appliances, and convenient access to the first-floor laundry area. A flexible floor plan offers plenty of room for everyday living, entertaining, a home office, or additional hobby space. Two full bathrooms provide added convenience and functionality for today'
Key facts
- Hardwood flooring
- Large windows
- Natural light
Tags
Property features AI
Exterior
- Parking: Attached garage with 1 parking space
- Utilities: Public water; Public sewer at street; Natural gas
- Home design: Residential property; 2-story structure; Built in 1940; Frontage of about 48 feet
- Construction: Crawl foundation
- Exterior features: Brick exterior; Fenced yard; Paved street access
Interior
- Kitchen: Kitchen on the entry level, about 12 x 10; Dining room on the entry level, about 12 x 10
- Bedrooms: Three bedrooms on the second floor (approx. 8 x 14; 12 x 18; one listed as W=21)
- Bathrooms: Two full bathrooms; Both bathrooms located on the entry level; one measures about 5 x 8
- Heating & cooling: Forced air heating; Natural gas fuel
- Interior features: Total of 8 rooms; Living room on entry level, approximately 12 x 18
Neighborhood map
What this means for you Summary
Snapshot
- This is a 3-bed/2.0-bath single-family listed at $150k.
Deal economics
- At list price, monthly cash flow is $91 ($1k/yr) — positive.
- The deal already cash-flows at list — no discount required.
- To meet the 1% rule (rent ≥ 1% of price), the offer needs to be $146k (2.4% below list).
- Recommended offer: $146k (2.4% below list) — sets the bar for 1% rule.
- Cap rate 7.0% vs local median 3.5% in Mount Clemens — top-decile yield for the area; either an underpriced asset or a hidden risk that comps aren't pricing in. Stress-test before assuming the spread holds.
Location & tenants
- Location reads 77/100 on livability (#120 in MI, #2,918 nationally) — a middle-class / working-renter tenant base. Strengths: commute A+, cost of living A+, housing A+; Watch: schools D+, crime D+, amenities D+.
- Mount Clemens Community School District (suburban): math 4% / reading 11% proficiency, ranked #532 of 540 in MI (top 98%) — low school quality limits family demand, transient renter base, plan for 1-2y turnover; 80% free/reduced lunch — lower-income household profile, screen leases tightly.
- Market conditions: 1 active listings in the ZIP; 12 comparable units currently listed for rent nearby; rentals leasing fast (median 5d on market — plan ~1-2 weeks tenant-placement turnaround); 1,321 units permitted in Macomb County in 2024 (86 in 5+ unit buildings).
Forward outlook
- In year one you build about $6k of equity ($1k loan paydown + $4k appreciation (3.0% local appreciation)).
- Macomb County population projected at +9% by 2050 — modest demand growth; plan on rents tracking national, not racing it.
- At projected returns (3.0% appreciation + 3.0% rent growth), your $42k cash investment doubles in ~6 years — after that, you're playing with house money.
- By year 7, paydown + projected appreciation supports a ~$35k cash-out refi (75% LTV) — recoverable capital for the next deal without selling this one.
Negotiation context
- Only 1 days on market — expect competitive offers; lowballing is unlikely to land.
- 5 sale attempts since 30y ago; this cycle's ask has dropped $15k (9%) from the opening price — seller is motivated, your offer sets the floor, not the list.
- Current owner paid $60k; list at $150k implies a 149% gain — meaningful room to come down on a strong offer.
Risks & watch-outs
- Watch-outs: built in 1940 — expect roof / HVAC / electrical / plumbing capex.
Questions for the listing agent
- Built in 1940 — when were the roof, HVAC, electrical panel, plumbing, and water heater last replaced?
- Is there a deadline driving the sale (1031 exchange, divorce, estate, relocation)? That informs how much negotiation room exists.
- Schools are D-rated, which usually means shorter tenancies and higher turnover. Who's the typical renter profile here, and what's been the actual vacancy rate?
- Crime grade is D in this area — have there been break-ins, vandalism, or insurance claims at this property in the last 3 years? What carrier currently insures it and at what premium?
- What's the average days-on-market for RENTAL listings here right now (not sales)? A rising rental-DOM trend means longer vacancies and softer asking-rent achievability than the comps imply.
- What's the recent tenant-quality profile in this submarket — average credit score on applications, eviction rate, late-payment / NSF rate, and stable-employment percentage? A property-management company in the area should have these aggregated.
- How much new for-sale + rental construction is in the pipeline within 1–3 miles? Heavy new supply typically softens prices + rents 12–24 months out; constrained supply supports both.
Investment metrics
- 1% rule
- 0.98% ✗
- Cap rate
- 7.02%
- Cash-on-cash
- 2.59%
- DSCR
- 1.12
- GRM
- 8.5
CMA / ARV
- ARV (on-the-fly)
- $174,328
- Comps found
- 12
Show comp detail 12 sales within ~0.75 mi
| Address | Dist | Beds/Ba | Sqft | Sold | Price | $/sf | Match |
|---|---|---|---|---|---|---|---|
| 51 Leonore St | 0.12mi | 3/1.5 | 1,168 (+3%) | 10mo | $189,000 | $162 | 79 |
| 26 Hollywood Ct | 0.30mi | 3/1.0 | 1,260 (+11%) | 1mo | $170,500 | $135 | 62 |
| 58 Yeamans St | 0.20mi | 2/1.5 (-1) | 1,046 (-8%) | 10mo | $145,000 | $139 | 62 |
| 57 High St | 0.30mi | 3/1.5 | 1,237 (+9%) | 10mo | $206,000 | $167 | 61 |
| 71 Boehme St St | 0.56mi | 2/1.0 (-1) | 1,156 (+2%) | 2mo | $169,900 | $147 | 59 |
| 43770 North Ave | 0.61mi | 3/1.0 | 1,104 (-2%) | 8mo | $144,900 | $131 | 57 |
| 166 Clinton St | 0.45mi | 2/1.0 (-1) | 1,035 (-9%) | 1mo | $102,500 | $99 | 55 |
| 72 Gratiot Ave | 0.67mi | 3/1.0 | 1,045 (-8%) | 1mo | $169,900 | $163 | 52 |
| 38 Clair St | 0.39mi | 3/1.0 | 1,000 (-12%) | 10mo | $146,000 | $146 | 51 |
| 31 N Highland Ave | 0.64mi | 3/1.0 | 1,060 (-6%) | 7mo | $192,500 | $182 | 50 |
| 179 Washington St | 0.40mi | 3/1.0 | 1,300 (+15%) | 10mo | $200,000 | $154 | 44 |
| 161 N Wilson Blvd | 0.54mi | 2/1.0 (-1) | 1,025 (-10%) | 9mo | $160,000 | $156 | 42 |
Match score weights: distance 35% · size 25% · config 20% · recency 20%. Top-matched comps best support the ARV.
Projected returns pro-forma
3.0% appreciation · 3.0% rent growth · sell at horizon
- IRR
- 9.9%
- Equity multiple
- 1.57×
- Total profit
- $23,881
- Equity at exit
- $67,446
- IRR
- 12.3%
- Equity multiple
- 2.83×
- Total profit
- $77,004
- Equity at exit
- $103,943
Cash invested: $42,000 (down + closing). Projections, not guarantees.
Landlord ↔ Tenant lean methodology
- Overall (STATE)
- 62 Landlord-Friendly
- State Michigan
- 62 Landlord-Friendly · EVEN
- County
- — inherits STATE
- City
- — inherits STATE
ZIP-level market 48043 1401
- Active inventory
- 1
- Price-to-rent
- 8.5×
Monthly cashflow live
- Estimated rent
- $1,464 high interval (Pro) →
- Mortgage (P&I)
- −$787
- Tax from tax record
- −$217 /mo · $2,602/yr
- Insurance
- −$62
- HOA
- −$0
- Vacancy / Maint / Mgmt
- −$307
- Net cashflow
- $91
Break-even live
UW: 25.0% down · 7.5% · 30yr · 1.5% tax · 5.0% vac · 8.0% maint · 8.0% mgmt
Financing live
Cash to close
- Down payment
- $37,500
- Closing costs
- $4,500
- Reserves months
- —
- Total cash needed
- —
Loan-product check · same deal, 3 products live
Conventional
25% down · 7.5% · 30yr
- Down + closing
- —
- Monthly P&I
- —
- Monthly cashflow
- —
- DSCR
- —
- Eligible?
- —
Personal DTI + credit; lowest rate.
DSCR
20% down · 8.5% · 30yr
- Down + closing
- —
- Monthly P&I
- —
- Monthly cashflow
- —
- DSCR
- —
- Eligible?
- —
No personal income docs; deal must DSCR.
Hard money
10% down · 12.0% · 12mo
- Down + closing
- —
- Monthly P&I
- —
- Monthly cashflow
- —
- DSCR
- —
- Eligible?
- —
Short-term bridge; refi at stabilization.
Rent comps 12 comps
| Address | Beds | Baths | Sqft | Rent | $/sqft | DOM | Units | Dist |
|---|---|---|---|---|---|---|---|---|
| 40 Ferrin Pl Mount Clemens, MI | 3.0 | 1.0 | 1400 | $1,700 | $1.21 | 1d | 1 | 0.55mi |
| 20 Lincoln St Unit 225 Mt Clemens, MI | 2.0 | 1.0 | 816 | $1,200 | $1.47 | 43d | 1 | 0.60mi |
| 121 Jones St Unit 2 Mt Clemens, MI | 2.0 | 1.0 | 1050 | $1,600 | $1.52 | 2d | 1 | 0.62mi |
| 121 Jones St Unit 1 Mt Clemens, MI | 2.0 | 1.0 | 1080 | $1,400 | $1.30 | 1d | 1 | 0.62mi |
| 176 N Christine Cir Unit 1 Mt Clemens, MI | 2.0 | 1.5 | 1020 | $1,300 | $1.27 | 43d | 1 | 0.66mi |
| 133 S Christine Cir Unit 1 Mt Clemens, MI | 3.0 | 1.5 | 1040 | $1,500 | $1.44 | 1d | 1 | 0.67mi |
| 277 N Rose St Mt Clemens, MI | 1.0–2.0 | 1.0 | 755 | $1,434 | $1.90 | 1d | 2 | 0.82mi |
| 15 Washington St Unit 2 Mt Clemens, MI | 3.0 | 1.0 | 1396 | $1,400 | $1.00 | 43d | 1 | 0.85mi |
| 64 Crocker Blvd Mt Clemens, MI | 2.0 | 1.0 | 950 | $1,250 | $1.32 | 43d | 1 | 1.16mi |
| 70 Crocker Blvd Mt Clemens, MI | 2.0 | 1.0 | 950 | $1,400 | $1.47 | 10d | 1 | 1.16mi |
| 104 Crocker Blvd Mt Clemens, MI | 2.0 | 1.0 | 854 | $1,250 | $1.46 | 4d | 1 | 1.25mi |
| 35 S Groesbeck Hwy Mt Clemens, MI | 1.0–2.0 | 1.0–1.5 | 1125 | $2,050 | $1.82 | 1d | 1 | 1.27mi |
Listing history 2 events
-
2026-06-18remarks 699-char remark
-
2026-06-18$150,000 Coming Soon 1 DOM
ⓘ Source: listings_history table (triggers on properties + properties_extension) + one-shot
backfill from property_details.listing_events for pre-trigger history.
Tax reassessment forecast MI · Partial reset (capped growth)
- Current annual tax
- $2,602 · $217/mo
- Projected year-2 tax
- $2,602 · $217/mo
- Expected delta
- $0/yr ($0/mo · 0.0%)
ⓘ Screening estimate from a state-policy table — verify with the county assessor before closing.
Climate risk First Street
- Flood 1/10 Low FEMA zone X (unshaded) · 0% chance over 30 yrs
- Wildfire 1/10 Low
- Heat 3/10 Moderate 7 d/yr ≥97°F today · 15 d/yr by 30 yrs out
- Wind 1/10 Low
- Air quality 4/10 Moderate 4 unhealthy d/yr today · 6 by 30 yrs out
Nearby sold comps map
Loading sold comps map…
Walkable amenities ~0.75 mi
Loading nearby amenities…
Taxation est. · year 1
- Rental income
- $17,568
- − Mortgage interest
- −$8,402
- − Property taxes
- −$2,602
- − Insurance
- −$750
- − Repairs & maintenance
- −$1,405
- − Management
- −$1,405
- − Depreciation
- −$4,364
- Taxable loss
- −$1,361
- Est. tax savings @ 24.0%
- +$327
- After-tax cash flow
- $1,414/yr
For passive investors: Depreciation is non-cash, so a rental often shows a tax loss while cash-flowing — sheltering income. Rental losses are passive: they offset passive income freely, and up to $25,000/yr can offset ordinary (W-2) income if you actively participate and your MAGI is under $100k (phasing out to $0 by $150k); unused losses carry forward. On sale, claimed depreciation is recaptured at up to 25%, and gains may owe capital-gains tax (a 1031 exchange can defer both). Figures are a year-1 estimate at your 24.0% rate — not tax advice; consult a CPA.
Schools (NCES district)
- District
- Mount Clemens Community School District
- NCES district ID
- 2624690
- Math proficiency
- 4% ▼ -9.00%
- Reading proficiency
- 11% ▼ -7.00%
- Median HH income
- $36,632
- Composite
- 6.25/100
- National rank
- #10005
- State rank
- #532 of 540 in MI
Livability — Mount Clemens
- Score
- 77/100
- State rank
- #120
- US rank
- #2918
Category grades
Schools grade is shown separately in the Schools card above.
Census & demographics
- Census place
- Mount Clemens, MI
Population outlook (Macomb County) Hauer SSP2
- Today (2025)
- 925,296 people
- By 2030
- 948,226 · +2.5%
- By 2040
- 983,961 · +6.3%
- By 2050
- 1,010,200 · +9.2%
- By 2075
- 1,076,222 · +16.3%
- By 2100
- 1,077,065 · +16.4%
Not yet ingested
- Political lean
- —
- Race & ethnicity
- —
- Common origin
- —
- Civics
- —
Market trends
- HPI YoY
- —
- Current HPI
- —
- Rent YoY
- —
- Metro
- —
- State GDP YoY
- ▲ 1.37%
- F500 in state
- 28
Industry mix (Fortune 500 HQ in MI)
| Industry | F500 HQs | Revenue |
|---|---|---|
| Automotive Parts | 3 | $48B |
|
||
| Automotive | 2 | $372B |
|
||
| Chemicals | 1 | $45B |
|
||
| Automotive Retail | 1 | $29B |
|
||
| Healthcare / Medical Devices | 1 | $23B |
|
||
| Automotive Technology | 1 | $20B |
|
||
Price history
+158.6% since first listed19 events — show timeline
- 2026-06-17 Coming Soon $150,000 MiRealSource-MiMLS
- 2025-11-28 Listing Removed — MiRealSource-MiMLS
- 2025-11-28 Listing Removed — REALCOMP
- 2025-11-20 Price Changed $159,900 MiRealSource-MiMLS
- 2025-11-19 Price Changed $159,900 REALCOMP
- 2025-11-10 Listed $165,000 REALCOMP
- 2025-11-10 Listed $165,000 MiRealSource-MiMLS
- 2025-11-07 Coming Soon — MiRealSource-MiMLS
- 2011-03-15 Sold (Public Records) $60,133 Public Records
- 2009-11-19 Sold (MLS) $25,000 MiRealSource-MiMLS
- 2009-11-19 Sold (MLS) $25,000 REALCOMP
- 2009-10-29 Listing Removed — MiRealSource-MiMLS
- 2009-10-29 Listed $25,000 MiRealSource-MiMLS
- 2009-10-29 Listed $25,000 REALCOMP
- 1996-12-06 Sold (MLS) $83,000 MiRealSource-MiMLS
- 1996-10-29 Sold (Public Records) $85,000 Public Records
- 1996-09-23 Listing Removed — MiRealSource-MiMLS
- 1996-08-13 Listed $89,900 MiRealSource-MiMLS
- 1993-03-10 Sold (Public Records) $58,000 Public Records
Property tax history
+3.1%/yrLatest (2025): $2,602 · +0.9% YoY. Source: county tax records.
Cash-flow waterfall
monthlySold comps — $/sqft
last 12 mo · ≤1 miLoading sold comps…