 🌊 Lakefront
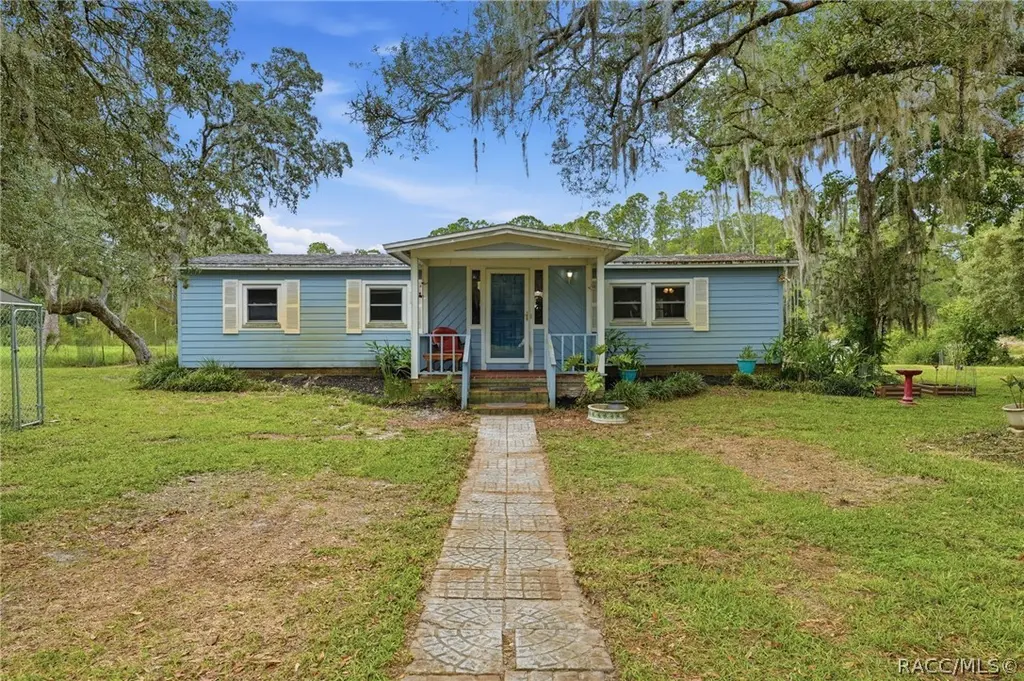
9380 N Cedar Cove Rd · Hernando, FL
Flood risk 1/10 · Minimal
- FEMA flood zone
- AE
- Chance of flooding over 30 yrs
- 0.0%
- Est. flood insurance / yr
- $1,737 – $8,500
Fire risk 6/10 · Moderate
- Est. fire insurance / yr
- $947 – $1,759
Heat risk 9/10 · Severe
- Hot days now (above 107°F)
- 7 days/yr
- Hot days in 30 yrs
- 24 days/yr
Wind risk 9/10 · Severe
- Chance of severe wind over 30 yrs
- 99.0%
Air-quality risk 2/10 · Minimal
- Unhealthy air days now
- 1 days/yr
- Unhealthy air days in 30 yrs
- 1 days/yr
Risk factors via First Street. Map © Google.
Why this score? — see what drove the C+ grade
The composite is a weighted blend of 9 inputs, each scored 0–100. Each bar is that input's sub-score; the figure is the points it added to the 100-point composite (weight × sub-score).
- Cash flow +27.0/30.0
- DSCR +9.4/10.0
- ARV discount +7.5/15.0
- 1% rule +6.2/10.0
- Schools +4.1/10.0
- Livability +3.6/5.0
- Rent growth +2.5/5.0
- Condition / age +2.5/5.0
- Appreciation +0.1/10.0
$145,000
🖨 Deal sheet (PDF) 📄 Offer letter ✓ Due diligence
Listing remarks MLS
Enjoy the peaceful Florida lifestyle on this beautiful 1.10-acre lakefront property in the desirable Cedar Cove area of Dunnellon. Nestled among mature trees and beautiful canopy's and offering exceptional privacy, this property provides the perfect setting for those seeking space, nature, and country living. Wake up to serene lake views from the backyard and enjoy the tranquility of your own retreat. This 2-bedroom, 2-bath double-wide mobile home offers 1,296 square feet of living space with a functional floor plan featuring a spacious living room, family room, dining area, and inviting kitchen. Recent improvements include new windows, a new water treatment system, and a roof replaced in 2017. A large Florida room and expansive screened back porch provide additional living and entertaining space while allowing you to enjoy the beautiful lake views year-round. Outside, the possibilities are endless. The 1.10-acre property offers plenty of room for boats, RVs, trailers, and all your outdoor toys, complete with a 30-amp RV hookup. A workshop/storage building and utility shed with 30 amp RV hook up, provide ample space for projects, hobbies, and equipment storage. The expansive lot also offers room for gardening, recreation, or even a future pool. Located on a paved county-maintained road with existing well and septic, this property combines rural charm with everyday convenience. Whether you're searching for a full-time residence, seasonal getaway, or investment opportunity, this waterfront property offers outstanding value and endless potential.
Key facts
- Lakefront property
- Serene lake views
- Recent improvements
Tags
Property features AI
Finance
- Other: Homestead exempt; Zoned CLRMH
- Financial info: No lease restrictions
- HOA & community: No HOA/association
Exterior
- Parking: No specific parking details provided
- Security: No security features listed
- Utilities: Well water; Septic tank; Cable connected
- Home design: Residential mobile home, double wide; One story; East-facing entry
- Construction: Wood siding construction; Shingle roof; Built on crawlspace
- Exterior features: Covered front and rear porches; Porch; Dog run; Private mailbox; Chain link and wire fencing; Shed(s) and workshop; Cleared, wooded and landscaped with oak trees; Paved public-maintained road access; Lakefront with limited lake access and lake views (165 ft frontage)
Interior
- Kitchen: Dishwasher; Range; Refrigerator
- Bedrooms: 2 bedrooms
- Flooring: Laminate flooring; Wood flooring
- Bathrooms: 2 full bathrooms
- Heating & cooling: Central heating; Central air conditioning
- Interior features: Ceiling fans; Living room/dining room combo; Double pane ENERGY STAR windows; Sliding doors
- Laundry & utility: Washer and dryer (inside laundry); Crawlspace foundation
Neighborhood map
What this means for you Summary
Snapshot
- This is a 2-bed/2.0-bath manufactured listed at $145k.
Deal economics
- At list price, monthly cash flow is $-19 ($-231/yr) — negative.
- To cash-flow at today's rent, offer at most $142k (2.3% below list).
- Meets the 1% rule at list price ($2k rent vs $145k).
- Recommended offer: $142k (2.3% below list) — sets the bar for cash-flow.
- Cap rate 9.7% vs local median 6.0% in Hernando — top-decile yield for the area; either an underpriced asset or a hidden risk that comps aren't pricing in. Stress-test before assuming the spread holds.
Location & tenants
- Location reads 71/100 on livability (#402 in FL) — a middle-class / working-renter tenant base. Strengths: cost of living A+, housing A+, health & safety A+; Watch: amenities F, commute F, employment D-.
- Citrus (rural): math 49% / reading 50% proficiency, ranked #44 of 73 in FL (top 60%) — families likely to look elsewhere, expect single-tenant / working-renter base with shorter leases.
- Zoned schools: Central Ridge Elementary School (math 41% / reading 44%, grade F, #1,383 of 2,144 statewide, top 65%, 723 students, 64% FRL); Citrus Springs Middle School (math 55% / reading 54%, grade B-, #183 of 571 statewide, top 34%, 821 students, 59% FRL); Citrus High School (math 34% / reading 51%, grade F, #264 of 667 statewide, top 41%, 1,503 students, 54% FRL) — zoned schools at 59% FRL track the district average.
- Market conditions: 1247 active listings in the ZIP; 2,443 units permitted in Citrus County in 2024 (0 in 5+ unit buildings).
Forward outlook
- Local home prices are declining (-3.0%/yr); year-one equity from $1k of loan paydown is wiped out by about $4k of value loss. Plan a longer hold.
- Citrus County population projected to shrink 10% by 2050 — rents likely to lag national; underwrite the cash flow, not the appreciation.
Negotiation context
- Only 3 days on market — expect competitive offers; lowballing is unlikely to land.
- 2 sale attempts with the ask held roughly flat each time — persistent listings suggest the price (not the market) is what's stuck; bring a comps-based counter.
- Current owner paid $58k; list at $145k implies a 150% gain — meaningful room to come down on a strong offer.
Risks & watch-outs
- Watch-outs: flood insurance adds $427/mo.
- Climate carrying-cost: in FEMA flood zone AE (mandatory federal flood insurance); severe wind risk, 99% chance of damaging wind over 30y; major wildfire risk; extreme-heat days projected 7→24/yr by 2055 (HVAC capex compounding) — expect insurance premiums to compound above CPI over the hold.
Questions for the listing agent
- What do current leases actually rent for vs. the listed asking? Can we see a recent rent roll and the last 12 months of T-12 income?
- Built in 1974 — when were the roof, HVAC, electrical panel, plumbing, and water heater last replaced?
- What's the actual annual flood-insurance premium (NFIP or private), and is the property in a SFHA with mandatory coverage?
- Is there a deadline driving the sale (1031 exchange, divorce, estate, relocation)? That informs how much negotiation room exists.
- This sits on a lake — are riparian / water-frontage rights deeded with the parcel? Any dock permits, shoreline easements, or HOA water-use restrictions?
- What's the documented flood / surge / shoreline-erosion history here (FEMA AND non-FEMA — e.g., storm surge, creek backup, septic-field saturation)?
- Any water-quality or seasonal algae-bloom issues that affect tenant satisfaction or short-term-rental demand?
- What's the average days-on-market for RENTAL listings here right now (not sales)? A rising rental-DOM trend means longer vacancies and softer asking-rent achievability than the comps imply.
- What's the recent tenant-quality profile in this submarket — average credit score on applications, eviction rate, late-payment / NSF rate, and stable-employment percentage? A property-management company in the area should have these aggregated.
- How much new for-sale + rental construction is in the pipeline within 1–3 miles? Heavy new supply typically softens prices + rents 12–24 months out; constrained supply supports both.
Investment metrics
- 1% rule
- 1.12% ✓
- Cap rate
- 9.66%
- Cash-on-cash
- 12.04%
- DSCR
- 1.54
- GRM
- 7.5
CMA / ARV
- ARV (on-the-fly)
- $304,430
- Comps found
- 5
Show comp detail 5 sales within ~0.75 mi
| Address | Dist | Beds/Ba | Sqft | Sold | Price | $/sf | Match |
|---|---|---|---|---|---|---|---|
| 3629 E Westcove Ct | 0.22mi | 2/2.0 | 1,282 (-1%) | 20mo | $225,000 | $176 | 72 |
| 8750 N Brandy Ter | 0.58mi | 3/2.0 (+1) | 1,288 (-1%) | 4mo | $110,000 | $85 | 64 |
| 4140 E Riverside Dr | 0.53mi | 3/2.0 (+1) | 1,344 (+4%) | 5mo | $85,000 | $63 | 60 |
| 4158 E Seminole Ln | 0.56mi | 3/2.0 (+1) | 1,264 (-2%) | 16mo | $219,900 | $174 | 51 |
| 4180 E Seminole Ln | 0.58mi | 3/2.0 (+1) | 1,264 (-2%) | 23mo | $219,800 | $174 | 44 |
Match score weights: distance 35% · size 25% · config 20% · recency 20%. Top-matched comps best support the ARV.
Projected returns pro-forma
-3.0% appreciation · 3.0% rent growth · sell at horizon
- IRR
- -17.1%
- Equity multiple
- 0.40×
- Total profit
- $-24,515
- Equity at exit
- $21,620
- IRR
- -8.7%
- Equity multiple
- 0.46×
- Total profit
- $-22,089
- Equity at exit
- $12,537
Cash invested: $40,600 (down + closing). Projections, not guarantees.
Landlord ↔ Tenant lean methodology
- Overall (STATE)
- 87 Strongly Landlord-Friendly
- State Florida
- 87 Strongly Landlord-Friendly · R+3
- County
- — inherits STATE
- City
- — inherits STATE
ZIP-level market 34434
- Home prices YoY
- -2.9%
- Active inventory
- 1247
- Price-to-rent
- 7.5×
Monthly cashflow live
- Estimated rent
- $1,618 medium interval (Pro) →
- Mortgage (P&I)
- −$760
- Tax from tax record
- −$50 /mo · $597/yr
- Insurance
- −$60
- Flood insurance flood zone
- −$427 /mo · $5,118/yr
- HOA
- −$0
- Vacancy / Maint / Mgmt
- −$340
- Net cashflow
- $-19
Break-even live
Sensitivity live
| Price | -10% $63 | -5% $22 | +0% $-19 | +5% $-60 | +10% $-101 |
|---|---|---|---|---|---|
| Rent | -10% $-147 | -5% $-83 | +0% $-19 | +5% $45 | +10% $109 |
| Rate | -1.0pp $54 | -0.5pp $18 | base $-19 | +0.5pp $-57 | +1.0pp $-95 |
UW: 25.0% down · 7.5% · 30yr · 1.5% tax · 5.0% vac · 8.0% maint · 8.0% mgmt
Financing live
Cash to close
- Down payment
- $36,250
- Closing costs
- $4,350
- Reserves months
- —
- Total cash needed
- —
Loan-product check · same deal, 3 products live
Conventional
25% down · 7.5% · 30yr
- Down + closing
- —
- Monthly P&I
- —
- Monthly cashflow
- —
- DSCR
- —
- Eligible?
- —
Personal DTI + credit; lowest rate.
DSCR
20% down · 8.5% · 30yr
- Down + closing
- —
- Monthly P&I
- —
- Monthly cashflow
- —
- DSCR
- —
- Eligible?
- —
No personal income docs; deal must DSCR.
Hard money
10% down · 12.0% · 12mo
- Down + closing
- —
- Monthly P&I
- —
- Monthly cashflow
- —
- DSCR
- —
- Eligible?
- —
Short-term bridge; refi at stabilization.
Listing history 3 events
-
2026-06-13statusdays on market $145,000 Pending 3 DOM
-
2026-06-10remarks 699-char remark
-
2026-06-10$145,000 Active 1 DOM
ⓘ Source: listings_history table (triggers on properties + properties_extension) + one-shot
backfill from property_details.listing_events for pre-trigger history.
Tax reassessment forecast FL · Resets to sale price
- Current annual tax
- $597 · $50/mo
- Projected year-2 tax
- $1,204 · $100/mo
- Expected delta
- +$606/yr (+$51/mo · 101.4%)
ⓘ Screening estimate from a state-policy table — verify with the county assessor before closing.
Climate risk First Street
- Flood 1/10 Low FEMA zone AE · 0% chance over 30 yrs
- Wildfire 6/10 Major
- Heat 9/10 Extreme 7 d/yr ≥107°F today · 24 d/yr by 30 yrs out
- Wind 9/10 Extreme 99% chance of damaging wind over 30 yrs
- Air quality 2/10 Low 1 unhealthy d/yr today · 1 by 30 yrs out
Nearby sold comps map
Loading sold comps map…
Walkable amenities ~0.75 mi
Loading nearby amenities…
Taxation est. · year 1
- Rental income
- $19,411
- − Mortgage interest
- −$8,122
- − Property taxes
- −$597
- − Insurance
- −$5,844
- − Repairs & maintenance
- −$1,553
- − Management
- −$1,553
- − Depreciation
- −$4,218
- Taxable loss
- −$2,476
- Est. tax savings @ 24.0%
- +$594
- After-tax cash flow
- $363/yr
For passive investors: Depreciation is non-cash, so a rental often shows a tax loss while cash-flowing — sheltering income. Rental losses are passive: they offset passive income freely, and up to $25,000/yr can offset ordinary (W-2) income if you actively participate and your MAGI is under $100k (phasing out to $0 by $150k); unused losses carry forward. On sale, claimed depreciation is recaptured at up to 25%, and gains may owe capital-gains tax (a 1031 exchange can defer both). Figures are a year-1 estimate at your 24.0% rate — not tax advice; consult a CPA.
Schools (NCES district)
- District
- Citrus
- NCES district ID
- 1200270
- Math proficiency
- 49% ▼ -10.00%
- Reading proficiency
- 50% ▼ -6.00%
- Median HH income
- $38,618
- Composite
- 41.28/100
- National rank
- #3519
- State rank
- #44 of 73 in FL
Livability — Hernando
- Score
- 71/100
- State rank
- #402
- US rank
- #7137
Category grades
Schools grade is shown separately in the Schools card above.
Census & demographics
- Census place
- Hernando, FL
- County
- Citrus County · 111,314 people
- City population
- 17,281
- Metro
- Homosassa Springs, FL
- Population (ZIP)
- 11,074
- Household income
- $68,939
- Rent vs Own
- Severe rent burden
- 171.0
Population outlook (Citrus County) Hauer SSP2
- Today (2025)
- 138,622 people
- By 2030
- 136,886 · -1.3%
- By 2040
- 132,009 · -4.8%
- By 2050
- 125,196 · -9.7%
- By 2075
- 108,570 · -21.7%
- By 2100
- 84,454 · -39.1%
Race, ethnicity, and origin ACS 2023
- Neighborhood character
- Predominantly White (78%)
- Race & ethnicity
- White 78% Two or more races 11% Hispanic / Latino 9% Black 6%
- Hispanic origin (detail)
- Mexican 3% Puerto Rican 4%
- Common ancestry
- Iranian 3% Romanian 2% Slovak 2%
- Foreign-born
- 4% · Canada
- Languages at home
- 93% English-only · Spanish 5% German/W. Germanic 1% Other Indo-European 1%
Political lean MEDSL · Citrus
- 2024 margin
- Solid R (+45.9) · D 26.8% · R 72.6%
- 2008→2024 swing
- -29.8pp toward R · 2008: -16.1pp · 2024: -45.9pp
- All cycles
- 2024: R+45.9 2020: R+41.0 2016: R+39.7 2012: R+21.9 2008: R+16.1
Not yet ingested
- Civics
- —
Market trends
- HPI YoY
- ▼ -9.70%
- Current HPI
- 328.2164
- Rent YoY
- —
- Metro
- Homosassa Springs, FL
- State GDP YoY
- ▲ 3.28%
- F500 in state
- 36
Industry mix (Fortune 500 HQ in FL)
| Industry | F500 HQs | Revenue |
|---|---|---|
| Industrial Technology | 2 | $29B |
|
||
| Insurance | 2 | $17B |
|
||
| Retail | 1 | $60B |
|
||
| Technology Distribution | 1 | $58B |
|
||
| Homebuilding | 1 | $35B |
|
||
| Technology Manufacturing | 1 | $35B |
|
||
Price history
+326.5% since first listed6 events — show timeline
- 2026-06-09 Listed $145,000 Stellar MLS as Distributed by MLS Grid
- 2026-06-09 Listed $145,000 RACC
- 1998-05-13 Sold (Public Records) $58,000 Public Records
- 1995-04-01 Sold (Public Records) $50,000 Public Records
- 1992-05-01 Sold (Public Records) $60,000 Public Records
- 1983-07-01 Sold (Public Records) $34,000 Public Records
Property tax history
+3.7%/yrLatest (2025): $597 · +9.9% YoY. Source: county tax records.
Cash-flow waterfall
monthlySold comps — $/sqft
last 12 mo · ≤1 miLoading sold comps…