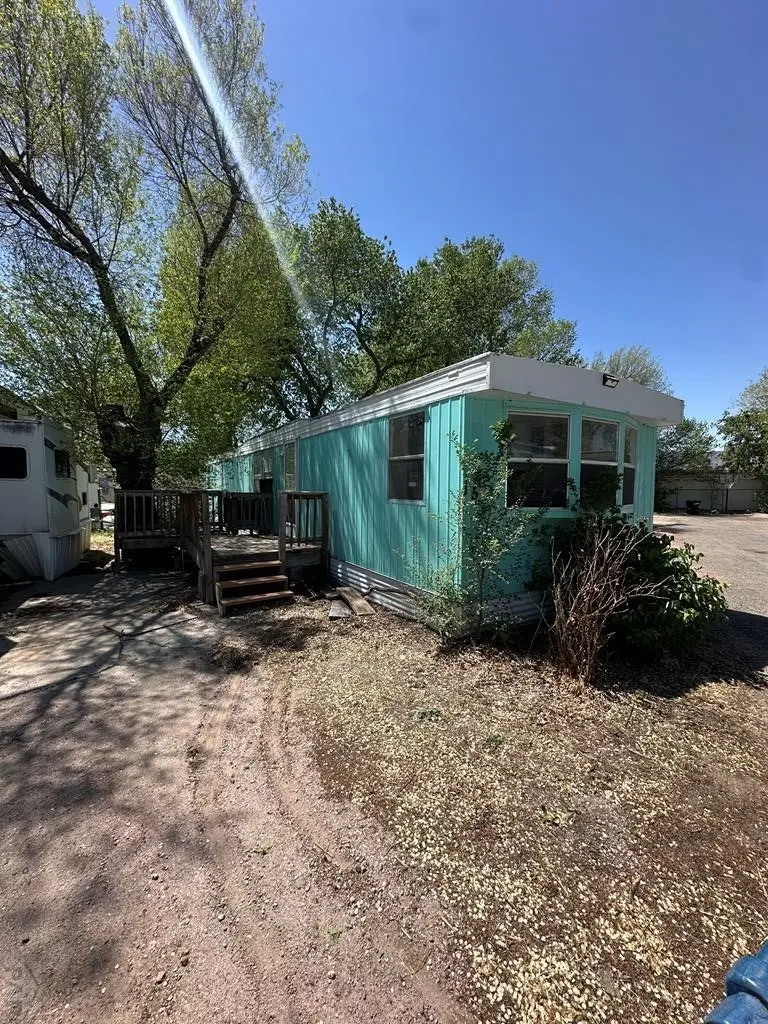
220 Mount View Ln #15 · Colorado Springs, CO
Flood risk 1/10 · Minimal
- FEMA flood zone
- X
- Chance of flooding over 30 yrs
- 0.0%
- Est. flood insurance / yr
- $507 – $1,088
Fire risk 6/10 · Moderate
- Est. fire insurance / yr
- $939 – $1,743
Heat risk 2/10 · Minimal
- Hot days now (above 89°F)
- 7 days/yr
- Hot days in 30 yrs
- 17 days/yr
Wind risk 2/10 · Minimal
- Chance of severe wind over 30 yrs
- —
Air-quality risk 2/10 · Minimal
- Unhealthy air days now
- 0 days/yr
- Unhealthy air days in 30 yrs
- 1 days/yr
Risk factors via First Street. Map © Google.
Why this score? — see what drove the B- grade
The composite is a weighted blend of 9 inputs, each scored 0–100. Each bar is that input's sub-score; the figure is the points it added to the 100-point composite (weight × sub-score).
- Cash flow +30.0/30.0
- 1% rule +10.0/10.0
- DSCR +10.0/10.0
- ARV discount +7.5/15.0
- Livability +3.9/5.0
- Rent growth +2.5/5.0
- Schools +2.5/10.0
- Condition / age +2.5/5.0
- Appreciation +0.0/10.0
$35,000
🖨 Deal sheet (PDF) 📄 Offer letter ✓ Due diligence
Listing remarks
Updated 2 bed 1 bath Mobile Home in Colorado Springs Family Park. Enjoy being close to amenities with this unit. Start your journey to homeownership with this adorable Mobile Home. Best yet, it's financeable! With low lot rent and a convenient location, what's stopping you? Grab your closest Realtor and check it out today!
Key facts
- Built 1965
- Listed 46 days
Property features AI
Finance
- Other: Zoning: M
- Financial info: Land lease: $890/month
- HOA & community: No association amenities
Exterior
- Parking: No garage
- Security: Smoke detector(s)
- Utilities: Public water; Public sewer
- Home design: Residential mobile home; Single-family style; Entry level information not specified; Facing direction not specified
- Construction: Metal siding; Metal roof; 672 above-grade finished area
- Exterior features: Deck; Porch; Has a view; Located on a cul-de-sac; Irregular lot
Interior
- Kitchen: Range; Oven; Refrigerator
- Bedrooms: 2 bedrooms on the main level
- Flooring: Carpet; Laminate
- Bathrooms: 1 full bathroom
- Heating & cooling: Natural gas forced-air heating
- Interior features: Master bedroom on the main level; No fireplace; No basement
Neighborhood map
What this means for you Summary
Snapshot
- This is a 2-bed/1.0-bath land listed at $35k.
Deal economics
- At list price, monthly cash flow is $722 ($9k/yr) — positive.
- The deal already cash-flows at list — no discount required.
- Meets the 1% rule at list price ($1k rent vs $35k).
- Recommended offer: $34k (3.0% below list) — sets the bar for market timing.
- Cap rate 31.0% vs local median 3.3% in Colorado Springs — top-decile yield for the area; either an underpriced asset or a hidden risk that comps aren't pricing in. Stress-test before assuming the spread holds.
Location & tenants
- Location reads 78/100 on livability (#23 in CO, #2,639 nationally) — a middle-class / working-renter tenant base. Strengths: amenities A+, housing A+, health & safety A+; Watch: cost of living C-, crime F.
- Colorado Springs School District No. 11 In The County Of E (urban): math 20% / reading 37% proficiency, ranked #56 of 86 in CO (top 65%) — low school quality limits family demand, transient renter base, plan for 1-2y turnover.
- Zoned schools: Edison Elementary School (math 30% / reading 37%, grade F, #454 of 966 statewide, top 47%, 263 students, 77% FRL); Mann Middle School (math 12% / reading 27%, grade F, #207 of 270 statewide, top 79%, 387 students, 67% FRL); Coronado High School (math 32% / reading 58%, grade D-, #139 of 381 statewide, top 36%, 1,305 students, 45% FRL).
- Market conditions: Rents flat; 195 active listings in the ZIP; 28 comparable units currently listed for rent nearby; rentals leasing fast (median 5d on market — plan ~1-2 weeks tenant-placement turnaround); 3,906 units permitted in El Paso County in 2024 (872 in 5+ unit buildings).
Forward outlook
- Local home prices are declining (-3.0%/yr); year-one equity from $242 of loan paydown is wiped out by about $1k of value loss. Plan a longer hold.
- El Paso County population projected at +28% by 2050 — long-run rental-demand tailwind backs the buy-and-hold thesis.
- At projected returns (-3.0% appreciation + 0.1% rent growth), your $10k cash investment doubles in ~2 years — after that, you're playing with house money.
Negotiation context
- It's been on market 46 days — a 3% lower offer ($34k) is reasonable based on typical stale-listing flexibility.
Risks & watch-outs
- Climate carrying-cost: major wildfire risk — expect insurance premiums to compound above CPI over the hold.
Questions for the listing agent
- It's been on market 46 days. Have you received any prior offers? Is the seller open to a 3% concession, seller financing, or rate buy-down credit?
- Built in 1965 — when were the roof, HVAC, electrical panel, plumbing, and water heater last replaced?
- Is there a deadline driving the sale (1031 exchange, divorce, estate, relocation)? That informs how much negotiation room exists.
- Schools are B-rated — typically a magnet for longer-tenancy family renters. What's the average tenant stay here, and is there a school-zone premium baked into asking?
- Crime grade is F in this area — have there been break-ins, vandalism, or insurance claims at this property in the last 3 years? What carrier currently insures it and at what premium?
- What's the average days-on-market for RENTAL listings here right now (not sales)? A rising rental-DOM trend means longer vacancies and softer asking-rent achievability than the comps imply.
- What's the recent tenant-quality profile in this submarket — average credit score on applications, eviction rate, late-payment / NSF rate, and stable-employment percentage? A property-management company in the area should have these aggregated.
- How much new for-sale + rental construction is in the pipeline within 1–3 miles? Heavy new supply typically softens prices + rents 12–24 months out; constrained supply supports both.
Investment metrics
- 1% rule
- 3.49% ✓
- Cap rate
- 31.04%
- Cash-on-cash
- 88.38%
- DSCR
- 4.93
- GRM
- 2.4
CMA / ARV
No comps found within radius.
Projected returns pro-forma
-3.0% appreciation · 0.11% rent growth · sell at horizon
- IRR
- 85.7%
- Equity multiple
- 4.76×
- Total profit
- $36,870
- Equity at exit
- $5,219
- IRR
- 88.2%
- Equity multiple
- 8.96×
- Total profit
- $78,022
- Equity at exit
- $3,026
Cash invested: $9,800 (down + closing). Projections, not guarantees.
Landlord ↔ Tenant lean methodology
- Overall (STATE)
- 38 Tenant-Leaning
- State Colorado
- 38 Tenant-Leaning · D+4
- County
- — inherits STATE
- City
- — inherits STATE
ZIP-level market 80907
- Rents YoY
- 0.1%
- Active inventory
- 195
- Price-to-rent
- 2.4×
Monthly cashflow live
- Estimated rent
- $1,220 high interval (Pro) →
- Mortgage (P&I)
- −$184
- Tax est. 1.5%
- −$44 /mo · $525/yr
- Insurance
- −$15
- HOA
- −$0
- Vacancy / Maint / Mgmt
- −$256
- Net cashflow
- $722
Break-even live
Sensitivity live
| Price | -10% $746 | -5% $734 | +0% $722 | +5% $710 | +10% $698 |
|---|---|---|---|---|---|
| Rent | -10% $625 | -5% $674 | +0% $722 | +5% $770 | +10% $818 |
| Rate | -1.0pp $739 | -0.5pp $731 | base $722 | +0.5pp $713 | +1.0pp $703 |
UW: 25.0% down · 7.5% · 30yr · 1.5% tax · 5.0% vac · 8.0% maint · 8.0% mgmt
Financing live
Cash to close
- Down payment
- $8,750
- Closing costs
- $1,050
- Reserves months
- —
- Total cash needed
- —
Loan-product check · same deal, 3 products live
Conventional
25% down · 7.5% · 30yr
- Down + closing
- —
- Monthly P&I
- —
- Monthly cashflow
- —
- DSCR
- —
- Eligible?
- —
Personal DTI + credit; lowest rate.
DSCR
20% down · 8.5% · 30yr
- Down + closing
- —
- Monthly P&I
- —
- Monthly cashflow
- —
- DSCR
- —
- Eligible?
- —
No personal income docs; deal must DSCR.
Hard money
10% down · 12.0% · 12mo
- Down + closing
- —
- Monthly P&I
- —
- Monthly cashflow
- —
- DSCR
- —
- Eligible?
- —
Short-term bridge; refi at stabilization.
Rent comps 28 comps
| Address | Beds | Baths | Sqft | Rent | $/sqft | DOM | Units | Dist |
|---|---|---|---|---|---|---|---|---|
| 325 Cragmor Rd Colorado Springs, CO | 2.0 | 1.0 | 537 | $899 | $1.67 | 4d | 2 | 0.18mi |
| 921 Westmoreland Rd Colorado Springs, CO | 1.0–2.0 | 1.0 | 750 | $1,234 | $1.65 | 4d | 12 | 0.38mi |
| 3850 Schafer Hts Colorado Springs, CO | 1.0–2.0 | 1.0–2.0 | 752 | $1,524 | $2.03 | 4d | 5 | 0.43mi |
| 1038 Westmoreland Rd Unit A Colorado Springs, CO | 2.0 | 1.0 | 700 | $875 | $1.25 | 16d | 1 | 0.52mi |
| 1134 Westmoreland Rd Colorado Springs, CO | 1.0–2.0 | 1.0 | 675 | $1,050 | $1.56 | 4d | 2 | 0.63mi |
| 3341 El Paso Pl Colorado Springs, CO | 1.0 | 1.0 | 495 | $899 | $1.82 | 4d | 1 | 0.63mi |
| 39 Sunflower Rd Unit B 58766927680 Colorado Springs, CO | 1.0 | 1.0 | 544 | $1,250 | $2.30 | 16d | 1 | 0.71mi |
| 4311 N Chestnut St Unit 2 Colorado Springs, CO | 1.0 | 1.0 | 700 | $925 | $1.32 | 25d | 1 | 0.90mi |
| 4331 N Chestnut St Colorado Springs, CO | 1.0 | 1.0 | 516 | $928 | $1.80 | 4d | 5 | 0.93mi |
| 3224 Illinois Ave Colorado Springs, CO | 2.0 | 1.0 | 600 | $1,249 | $2.08 | 25d | 1 | 0.96mi |
| 4760 Rusina Rd Colorado Springs, CO | 1.0–2.0 | 1.0–2.0 | 705 | $1,441 | $2.04 | 4d | 14 | 1.01mi |
| 4348 N Chestnut St Colorado Springs, CO | 1.0 | 1.0 | 525 | $1,018 | $1.94 | 4d | 6 | 1.02mi |
| 6715 N Century St Colorado Springs, CO | 1.0–3.0 | 1.0–2.0 | 1043 | $2,105 | $2.02 | 4d | 26 | 1.02mi |
| 4357 N Chestnut St Colorado Springs, CO | 1.0 | 1.0 | 550 | $880 | $1.60 | 23d | 1 | 1.03mi |
| 917 2nd St Colorado Springs, CO | 1.0 | 1.0 | 432 | $875 | $2.03 | 25d | 1 | 1.06mi |
| 3113 Illinois Ave Colorado Springs, CO | 1.0 | 1.0 | 600 | $964 | $1.61 | 4d | 1 | 1.14mi |
| 3113 Illinois Ave Unit 4 Colorado Springs, CO | 1.0 | 1.0 | 600 | $814 | $1.36 | 25d | 1 | 1.14mi |
| 2912 Concord St Colorado Springs, CO | 1.0 | 1.0 | 525 | $795 | $1.51 | 25d | 1 | 1.17mi |
| 80 W Taylor St Colorado Springs, CO | 1.0 | 1.0 | 535 | $750 | $1.40 | 4d | 3 | 1.17mi |
| 2924 N Arcadia St Colorado Springs, CO | 1.0–2.0 | 1.0 | 775 | $1,099 | $1.42 | 25d | 4 | 1.20mi |
| 5400 N Nevada Ave Colorado Springs, CO | 1.0–3.0 | 1.0–2.0 | 875 | $1,187 | $1.36 | 4d | 14 | 1.22mi |
| 3125 Sinton Rd Colorado Springs, CO | 2.0 | 1.0 | 660 | $1,402 | $2.12 | 4d | 6 | 1.23mi |
| 2925 Tremont St Colorado Springs, CO | 1.0–2.0 | 1.0 | 682 | $915 | $1.34 | 4d | 8 | 1.24mi |
| 10 Cragmor Village Rd Colorado Springs, CO | 1.0–4.0 | 1.0–4.0 | 979 | $2,011 | $2.05 | 4d | 1 | 1.28mi |
| 3210 N Chestnut St Colorado Springs, CO | 2.0 | 1.0 | 597 | $1,233 | $2.06 | 4d | 8 | 1.32mi |
| 2613 Concord St Apt 104 Colorado Springs, CO | 2.0 | 1.0 | 725 | $1,149 | $1.58 | 4d | 1 | 1.39mi |
| 2602 N Cascade Ave Unit 2602-102 Colorado Springs, CO | 1.0 | 1.0 | 691 | $1,495 | $2.16 | 25d | 1 | 1.40mi |
| 2602 N Cascade Ave Unit 2515-102 Colorado Springs, CO | 1.0 | 1.0 | 691 | $1,495 | $2.16 | 4d | 1 | 1.43mi |
Listing history 17 events
-
2026-06-22days on market $35,000 Active 46 DOM
-
2026-06-18days on market $35,000 Active 43 DOM
-
2026-06-17days on market $35,000 Active 42 DOM
-
2026-06-16days on market $35,000 Active 41 DOM
-
2026-06-15days on market $35,000 Active 40 DOM
-
2026-06-14days on market $35,000 Active 38 DOM
-
2026-06-10days on market $35,000 Active 35 DOM
-
2026-06-09days on market $35,000 Active 34 DOM
-
2026-06-08days on market $35,000 Active 33 DOM
-
2026-06-07days on market $35,000 Active 32 DOM
-
2026-06-05days on market $35,000 Active 29 DOM
-
2026-06-03days on market $35,000 Active 28 DOM
-
2026-06-03days on market $35,000 Active 27 DOM
-
2026-06-02price $35,000 Active 26 DOM
-
2026-06-01days on market $39,000 Active 26 DOM
-
2026-05-31days on market $39,000 Active 25 DOM
-
2026-05-06$39,000 Active
ⓘ Source: listings_history table (triggers on properties + properties_extension) + one-shot
backfill from property_details.listing_events for pre-trigger history.
Climate risk First Street
- Flood 1/10 Low FEMA zone X · 0% chance over 30 yrs
- Wildfire 6/10 Major
- Heat 2/10 Low 7 d/yr ≥89°F today · 17 d/yr by 30 yrs out
- Wind 2/10 Low
- Air quality 2/10 Low 0 unhealthy d/yr today · 1 by 30 yrs out
Nearby sold comps map
Loading sold comps map…
Walkable amenities ~0.75 mi
Loading nearby amenities…
Taxation est. · year 1
- Rental income
- $14,638
- − Mortgage interest
- −$1,961
- − Property taxes
- −$525
- − Insurance
- −$175
- − Repairs & maintenance
- −$1,171
- − Management
- −$1,171
- − Depreciation
- −$1,018
- Taxable income
- $8,617
- Est. tax owed @ 24.0%
- −$2,068
- After-tax cash flow
- $6,593/yr
For passive investors: Depreciation is non-cash, so a rental often shows a tax loss while cash-flowing — sheltering income. Rental losses are passive: they offset passive income freely, and up to $25,000/yr can offset ordinary (W-2) income if you actively participate and your MAGI is under $100k (phasing out to $0 by $150k); unused losses carry forward. On sale, claimed depreciation is recaptured at up to 25%, and gains may owe capital-gains tax (a 1031 exchange can defer both). Figures are a year-1 estimate at your 24.0% rate — not tax advice; consult a CPA.
Schools (NCES district)
- District
- Colorado Springs School District No. 11 In The County Of E
- NCES district ID
- 0803060
- Math proficiency
- 20% ▼ -8.00%
- Reading proficiency
- 37% ▼ -4.00%
- Median HH income
- $47,884
- Composite
- 24.69/100
- National rank
- #7613
- State rank
- #56 of 86 in CO
Livability — Colorado Springs
- Score
- 78/100
- State rank
- #23
- US rank
- #2639
Category grades
Schools grade is shown separately in the Schools card above.
Census & demographics
- Census place
- Colorado Springs, CO
- County
- El Paso County · 689,348 people
- City population
- 555,783
- Metro
- Colorado Springs, CO
- Population (ZIP)
- 27,815
- Household income
- $74,402
- Rent vs Own
- Severe rent burden
- 1396.0
Population outlook (El Paso County) Hauer SSP2
- Today (2025)
- 768,926 people
- By 2030
- 815,739 · +6.1%
- By 2040
- 903,489 · +17.5%
- By 2050
- 981,204 · +27.6%
- By 2075
- 1,155,542 · +50.3%
- By 2100
- 1,202,070 · +56.3%
Race, ethnicity, and origin ACS 2023
- Neighborhood character
- Predominantly White (77%)
- Race & ethnicity
- White 77% Hispanic / Latino 12% Two or more races 10% Black 3% Asian 2%
- Hispanic origin (detail)
- Mexican 8%
- Common ancestry
- Italian 3% Lithuanian 3% Slovak 3%
- Foreign-born
- 5% · Canada
- Languages at home
- 93% English-only · Spanish 4% German/W. Germanic 1%
Political lean MEDSL · El Paso
- 2024 margin
- Lean R (+9.8) · D 43.8% · R 53.5% · Other 2.7%
- 2008→2024 swing
- +9.0pp toward D · 2008: -18.8pp · 2024: -9.8pp
- All cycles
- 2024: R+9.8 2020: R+10.8 2016: R+22.6 2012: R+21.4 2008: R+18.8
Not yet ingested
- Civics
- —
Market trends
- HPI YoY
- ▼ -544.07%
- Current HPI
- 276.2139
- Rent YoY
- ▲ 0.11%
- Metro
- Colorado Springs, CO
- State GDP YoY
- ▲ 1.95%
- F500 in state
- 14
Industry mix (Fortune 500 HQ in CO)
| Industry | F500 HQs | Revenue |
|---|---|---|
| Technology Distribution | 1 | $31B |
|
||
| Food / Agriculture | 1 | $18B |
|
||
| Packaging | 1 | $14B |
|
||
| Healthcare | 1 | $13B |
|
||
| Energy | 1 | $10B |
|
||
| Technology | 1 | $4B |
|
||
Price history
1 event — show timeline
- 2026-05-06 Listed $39,000 PARMLS
Property tax history
+9.1%/yrLatest (2021): $12 · +33.8% YoY. Source: county tax records.
Cash-flow waterfall
monthlySold comps — $/sqft
last 12 mo · ≤1 miLoading sold comps…