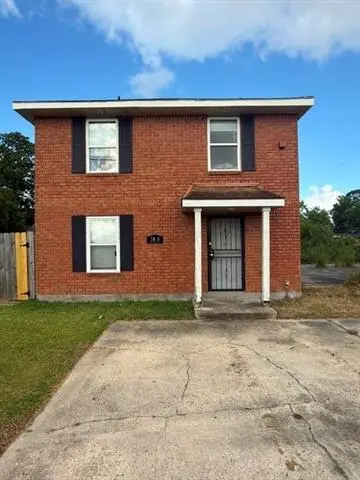
1410 Hendee St · New Orleans, LA
Flood risk 8/10 · Major
- FEMA flood zone
- X
- Chance of flooding over 30 yrs
- 0.6%
- Est. flood insurance / yr
- $507 – $1,088
Fire risk 1/10 · Minimal
- Est. fire insurance / yr
- $1,269 – $2,357
Heat risk 10/10 · Severe
- Hot days now (above 108°F)
- 7 days/yr
- Hot days in 30 yrs
- 21 days/yr
Wind risk 10/10 · Severe
- Chance of severe wind over 30 yrs
- 99.0%
Air-quality risk 2/10 · Minimal
- Unhealthy air days now
- 2 days/yr
- Unhealthy air days in 30 yrs
- 2 days/yr
Risk factors via First Street. Map © Google.
Why this score? — see what drove the B+ grade
The composite is a weighted blend of 9 inputs, each scored 0–100. Each bar is that input's sub-score; the figure is the points it added to the 100-point composite (weight × sub-score).
- Cash flow +30.0/30.0
- ARV discount +15.0/15.0
- 1% rule +10.0/10.0
- DSCR +10.0/10.0
- Livability +4.0/5.0
- Condition / age +2.5/5.0
- Rent growth +2.3/5.0
- Schools +1.6/10.0
- Appreciation +0.0/10.0
$92,500
🖨 Deal sheet 📄 Offer letter ✓ Due diligence
Listing remarks
Algiers, New Orleans | 1410 Hendee Street | $92,500 Whether you're a first-time buyer ready to put your stamp on something or an investor looking for your next smart acquisition -- this one deserves your attention. This 3BD/2.5BA two-story brick home is priced to sell and loaded with value within walking distance to LB Landry High School. Granite countertops, stainless steel appliances, ceramic tile & LVT throughout (no carpet anywhere!), and a large living area overlooking the kitchen. Outside features a completely fenced yard, storage shed, and dog kennel out back. It needs interior paint and flooring and some TLC-- but it's already priced with that in mind, meaning equity is built
Key facts
- Large living area
- Ceramic tile
- Granite countertops
Tags
Property features AI
Exterior
- Home design: Single-family residence
- Construction: Composition roof
- Exterior features: Full fencing; Workshop (outbuilding)
Interior
- Kitchen: Dishwasher; Microwave
- Bedrooms: Two bedrooms
- Bathrooms: Two full bathrooms; One half bathroom
- Heating & cooling: Central heating; Central air conditioning
- Interior features: Granite counters; Living room; Kitchen; Bathroom 1; Bathroom 2; Bedroom 1; Bedroom 2
Neighborhood map
What this means for you Summary
Snapshot
- This is a 3-bed/2.5-bath single-family listed at $92k.
Deal economics
- At list price, monthly cash flow is $571 ($7k/yr) — positive.
- The deal already cash-flows at list — no discount required.
- Meets the 1% rule at list price ($2k rent vs $92k).
- Cap rate 14.6% vs local median 4.4% in New Orleans — top-decile yield for the area; either an underpriced asset or a hidden risk that comps aren't pricing in. Stress-test before assuming the spread holds.
Location & tenants
- Location reads 81/100 on livability (#3 in LA, #1,383 nationally) — a professional / high-income tenant draw. Strengths: amenities A+, commute A+, health & safety A+; Watch: crime C-, employment D.
- Orleans Parish (urban): math 11% / reading 27% proficiency, ranked #69 of 98 in LA (top 70%) — low school quality limits family demand, transient renter base, plan for 1-2y turnover; 68% free/reduced lunch — lower-income household profile, screen leases tightly.
- Market conditions: Rents soft (-0.7%/yr); 265 active listings in the ZIP; 40 comparable units currently listed for rent nearby; rentals at typical pace (median 24d on market — plan ~3-4 weeks tenant-placement turnaround); lower-income renter base — watch delinquency; 710 units permitted in Orleans Parish in 2024 (244 in 5+ unit buildings).
- This rent runs 45% of the median local income ($43k/yr) — at the standard rent-burdened threshold; future hikes will face affordability resistance.
Forward outlook
- Local home prices are declining (-3.0%/yr); year-one equity from $640 of loan paydown is wiped out by about $3k of value loss. Plan a longer hold.
- Orleans County population projected at +61% by 2050 — long-run rental-demand tailwind backs the buy-and-hold thesis.
- At projected returns (-3.0% appreciation + 0.0% rent growth), your $26k cash investment doubles in ~6 years — after that, you're playing with house money.
Negotiation context
- Only 1 days on market — expect competitive offers; lowballing is unlikely to land.
- 4 sale attempts since 8y ago with the ask held roughly flat each time — persistent listings suggest the price (not the market) is what's stuck; bring a comps-based counter.
Risks & watch-outs
- Watch-outs: flood insurance adds $66/mo.
- Climate carrying-cost: severe flood risk; severe wind risk, 99% chance of damaging wind over 30y; extreme-heat days projected 7→21/yr by 2055 (HVAC capex compounding) — expect insurance premiums to compound above CPI over the hold.
Questions for the listing agent
- Built in 1970 — when were the roof, HVAC, electrical panel, plumbing, and water heater last replaced?
- What's the actual annual flood-insurance premium (NFIP or private), and is the property in a SFHA with mandatory coverage?
- Is there a deadline driving the sale (1031 exchange, divorce, estate, relocation)? That informs how much negotiation room exists.
- What's the average days-on-market for RENTAL listings here right now (not sales)? A rising rental-DOM trend means longer vacancies and softer asking-rent achievability than the comps imply.
- What's the recent tenant-quality profile in this submarket — average credit score on applications, eviction rate, late-payment / NSF rate, and stable-employment percentage? A property-management company in the area should have these aggregated.
- How much new for-sale + rental construction is in the pipeline within 1–3 miles? Heavy new supply typically softens prices + rents 12–24 months out; constrained supply supports both.
Investment metrics
- 1% rule
- 1.75% ✓
- Cap rate
- 14.57%
- Cash-on-cash
- 29.55%
- DSCR
- 2.31
- GRM
- 4.8
CMA / ARV
- ARV (on-the-fly)
- $143,750
- Comps found
- 12
Show comp detail 12 sales within ~0.75 mi
| Address | Dist | Beds/Ba | Sqft | Sold | Price | $/sf | Match |
|---|---|---|---|---|---|---|---|
| 1410 Hendee St | 0.00mi | 3/2.5 | 1,150 (0%) | 0mo | $90,000 | $78 | 100 |
| 1200 Farragut St | 0.35mi | 3/2.0 | 1,155 (+0%) | 14mo | $195,000 | $169 | 69 |
| 1518 Leboeuf St | 0.21mi | 2/1.0 (-1) | 1,095 (-5%) | 3mo | $15,000 | $14 | 69 |
| 704 Sumner St | 0.52mi | 3/1.5 | 1,127 (-2%) | 12mo | $265,000 | $235 | 58 |
| 1551 Shirley Dr | 0.46mi | 3/2.0 | 1,208 (+5%) | 12mo | $37,500 | $31 | 58 |
| 1056 Farragut St | 0.38mi | 3/1.0 | 1,279 (+11%) | 1mo | $85,000 | $66 | 57 |
| 1327 Shirley Dr | 0.42mi | 3/2.0 | 1,274 (+11%) | 6mo | $70,000 | $55 | 56 |
| 1416 Pace Blvd | 0.70mi | 3/1.0 | 1,118 (-3%) | 1mo | $140,000 | $125 | 56 |
| 800 Whitney Ave | 0.48mi | 3/2.0 | 1,069 (-7%) | 16mo | $170,000 | $159 | 50 |
| 1401 Nunez St | 0.72mi | 3/2.0 | 1,213 (+6%) | 8mo | $175,000 | $144 | 48 |
| 424 Park Blvd | 0.72mi | 3/1.5 | 1,259 (+10%) | 2mo | $175,000 | $139 | 45 |
| 1623 Shirley Dr | 0.50mi | 2/2.0 (-1) | 1,275 (+11%) | 8mo | $70,000 | $55 | 44 |
Match score weights: distance 35% · size 25% · config 20% · recency 20%. Top-matched comps best support the ARV.
Projected returns pro-forma
-3.0% appreciation · 0.0% rent growth · sell at horizon
- IRR
- 16.7%
- Equity multiple
- 1.65×
- Total profit
- $16,723
- Equity at exit
- $13,792
- IRR
- 22.8%
- Equity multiple
- 2.67×
- Total profit
- $43,366
- Equity at exit
- $7,998
Cash invested: $25,900 (down + closing). Projections, not guarantees.
Landlord ↔ Tenant lean methodology
- Overall (STATE)
- 90 Strongly Landlord-Friendly
- State Louisiana
- 90 Strongly Landlord-Friendly · R+12
- County
- — inherits STATE
- City
- — inherits STATE
ZIP-level market 70114
- Rents YoY
- -0.7%
- Active inventory
- 265
- Price-to-rent
- 4.8×
Monthly cashflow live
- Estimated rent
- $1,617 high interval (Pro) →
- Mortgage (P&I)
- −$485
- Tax from tax record
- −$116 /mo · $1,395/yr
- Insurance
- −$39
- Flood insurance flood zone
- −$66 /mo · $798/yr
- HOA
- −$0
- Vacancy / Maint / Mgmt
- −$340
- Net cashflow
- $571
Break-even live
UW: 25.0% down · 7.5% · 30yr · 1.5% tax · 5.0% vac · 8.0% maint · 8.0% mgmt
Financing live
Cash to close
- Down payment
- $23,125
- Closing costs
- $2,775
- Reserves months
- —
- Total cash needed
- —
Loan-product check · same deal, 3 products live
Conventional
25% down · 7.5% · 30yr
- Down + closing
- —
- Monthly P&I
- —
- Monthly cashflow
- —
- DSCR
- —
- Eligible?
- —
Personal DTI + credit; lowest rate.
DSCR
20% down · 8.5% · 30yr
- Down + closing
- —
- Monthly P&I
- —
- Monthly cashflow
- —
- DSCR
- —
- Eligible?
- —
No personal income docs; deal must DSCR.
Hard money
10% down · 12.0% · 12mo
- Down + closing
- —
- Monthly P&I
- —
- Monthly cashflow
- —
- DSCR
- —
- Eligible?
- —
Short-term bridge; refi at stabilization.
Rent comps 40 comps
| Address | Beds | Baths | Sqft | Rent | $/sqft | DOM | Units | Dist |
|---|---|---|---|---|---|---|---|---|
| 1510 Sumner St New Orleans, LA | 2.0 | 1.0 | 950 | $1,474 | $1.55 | 15d | 1 | 0.07mi |
| 1418 Behrman Ave New Orleans, LA | 2.0 | 1.0 | 876 | $1,400 | $1.60 | 15d | 1 | 0.13mi |
| 1421 Numa St Unit 1421 New Orleans, LA | 3.0 | 2.0 | 861 | $1,400 | $1.63 | 23d | 1 | 0.18mi |
| 1421 23 Numa St New Orleans, LA | 3.0 | 2.0 | 861 | $1,400 | $1.63 | 1d | 1 | 0.19mi |
| 1421 23 Numa St New Orleans, LA | 3.0 | 2.0 | 861 | $1,400 | $1.63 | 14d | 1 | 0.19mi |
| 1108 Sumner St New Orleans, LA | 3.0 | 1.5 | 1197 | $1,500 | $1.25 | 11d | 1 | 0.26mi |
| 1625 Lauradale Dr New Orleans, LA | 3.0 | 2.0 | 1029 | $1,700 | $1.65 | 3d | 1 | 0.39mi |
| 718 Majestic Pl New Orleans, LA | 3.0 | 2.0 | 1164 | $1,785 | $1.53 | 21d | 1 | 0.47mi |
| 810 Whitney Ave New Orleans, LA | 2.0 | 1.0 | 900 | $1,250 | $1.39 | 11d | 1 | 0.49mi |
| 807 Whitney Ave Unit 1 New Orleans, LA | 3.0 | 2.0 | 1262 | $1,500 | $1.19 | 3d | 1 | 0.50mi |
| 701 Behrman Ave New Orleans, LA | 3.0 | 2.0 | 1368 | $2,300 | $1.68 | 3d | 1 | 0.56mi |
| 740 Thayer Unit 2A New Orleans, LA | 2.0 | 2.0 | 950 | $1,350 | $1.42 | 23d | 1 | 0.57mi |
| 909 Atlantic Ave New Orleans, LA | 2.0 | 1.0 | 741 | $1,200 | $1.62 | 23d | 1 | 0.58mi |
| 2243 Kraft Pl New Orleans, LA | 2.0 | 1.0 | 865 | $1,200 | $1.39 | 23d | 1 | 0.62mi |
| 606 Drum St New Orleans, LA | 3.0 | 2.0 | 1131 | $2,350 | $2.08 | 23d | 1 | 0.70mi |
| 625 Atlantic Ave New Orleans, LA | 2.0 | 1.0 | 780 | $1,400 | $1.79 | 16d | 1 | 0.73mi |
| 1719 Pace Blvd New Orleans, LA | 3.0 | 1.0 | 1178 | $2,000 | $1.70 | 11d | 1 | 0.73mi |
| 733 Elmira Ave New Orleans, LA | 2.0 | 1.0 | 864 | $1,100 | $1.27 | 23d | 1 | 0.74mi |
| 400 Park Blvd Unit A New Orleans, LA | 4.0 | 1.5 | 1275 | $2,200 | $1.73 | 23d | 1 | 0.76mi |
| 543 Atlantic Ave New Orleans, LA | 2.0 | 2.5 | 1430 | $2,200 | $1.54 | 23d | 1 | 0.77mi |
| 1010 Isbell St Gretna, LA | 3.0 | 1.0 | 1300 | $1,350 | $1.04 | 43d | 1 | 0.79mi |
| 507 Newton St New Orleans, LA | 2.0 | 2.0 | 1150 | $1,400 | $1.22 | 23d | 1 | 0.79mi |
| 537 Pacific Ave New Orleans, LA | 2.0 | 1.0 | 750 | $1,400 | $1.87 | 3d | 1 | 0.81mi |
| 537 Pacific Ave New Orleans, LA | 2.0 | 1.0 | 750 | $1,400 | $1.87 | 2d | 1 | 0.81mi |
| 1140 Teche St Apt B New Orleans, LA | 3.0 | 1.0 | 1100 | $1,850 | $1.68 | 23d | 1 | 0.81mi |
| 1622 Jo Ann Pl New Orleans, LA | 3.0 | 1.5 | 1301 | $1,500 | $1.15 | 1d | 1 | 0.82mi |
| 335 Whitney Ave New Orleans, LA | 2.0 | 1.0 | 1100 | $1,575 | $1.43 | 23d | 1 | 0.83mi |
| 1945 Pace Blvd Unit 104 New Orleans, LA | 2.0 | 1.0 | 1000 | $1,250 | $1.25 | 23d | 1 | 0.86mi |
| 1945 Pace Blvd Apt 101 New Orleans, LA | 2.0 | 1.0 | 1000 | $1,250 | $1.25 | 10d | 1 | 0.86mi |
| 1565 Murl St Unit B New Orleans, LA | 2.0 | 2.0 | 1100 | $1,100 | $1.00 | 23d | 1 | 0.86mi |
| 1136 Brooklyn Ave New Orleans, LA | 3.0 | 1.0 | 913 | $1,600 | $1.75 | 23d | 1 | 0.87mi |
| 3000 Americus St New Orleans, LA | 3.0 | 2.0 | 1280 | $1,400 | $1.09 | 23d | 1 | 0.87mi |
| 620 Opelousas Ave Unit 103 New Orleans, LA | 2.0 | 1.5 | 1000 | $1,650 | $1.65 | 2d | 1 | 0.88mi |
| 724 Evelina St Unit B New Orleans, LA | 2.0 | 1.0 | 1000 | $1,600 | $1.60 | 16d | 1 | 0.89mi |
| 2002 Pace Blvd Unit 103 New Orleans, LA | 3.0 | 2.0 | 1000 | $1,500 | $1.50 | 14d | 1 | 0.89mi |
| 1200 Southlawn Blvd New Orleans, LA | 3.0 | 2.0 | 950 | $1,725 | $1.82 | 23d | 1 | 0.89mi |
| 601 Vallette St New Orleans, LA | 2.0 | 1.0 | 815 | $1,600 | $1.96 | 2d | 1 | 0.91mi |
| 3102 Lawrence St New Orleans, LA | 2.0 | 1.0 | 950 | $1,500 | $1.58 | 23d | 1 | 0.95mi |
| 336 Elmira Ave New Orleans, LA | 3.0 | 1.0 | 1250 | $1,825 | $1.46 | 23d | 1 | 0.97mi |
| 325 Elmira Ave Unit 325 New Orleans, LA | 3.0 | 1.5 | 1050 | $1,525 | $1.45 | 23d | 1 | 1.00mi |
Listing history 35 events
-
2026-05-20status Pending
-
2026-05-18$92,500 Active
-
2019-05-08soldstatus $109,900
-
2019-05-01soldstatus $109,900 Closed
-
2019-03-08status Pending
-
2019-02-16price $109,900
-
2019-02-05$109,900
-
2019-02-05$119,000 Active
-
2019-01-29price $121,800
-
2019-01-27price $121,999
-
2019-01-26price $122,500
-
2019-01-24price $122,999
-
2019-01-24price $123,000
-
2019-01-23price $123,500
-
2019-01-22price $124,999
-
2019-01-21price $125,900
-
2019-01-20price $125,999
-
2019-01-18price $125,799
-
2019-01-15price $125,900
-
2019-01-14price $125,999
-
2019-01-11price $126,299
-
2019-01-10price $126,300
-
2019-01-08price $126,500
-
2019-01-05price $127,000
-
2019-01-05price $12,700
-
2019-01-03price $127,500
-
2018-12-29price $128,000
-
2018-12-22price $128,500
-
2018-12-13price $128,999
-
2018-12-03price $129,500
-
2018-11-19price $129,800
-
2018-11-08$121,800
-
2014-07-22soldstatus $13,000
-
1994-03-11soldstatus $13,000
-
1981-04-28soldstatus $39,200
ⓘ Source: listings_history table (triggers on properties + properties_extension) + one-shot
backfill from property_details.listing_events for pre-trigger history.
Tax reassessment forecast LA · Resets to sale price
- Current annual tax
- $1,395 · $116/mo
- Projected year-2 tax
- $1,395 · $116/mo
- Expected delta
- $0/yr ($0/mo · 0.0%)
ⓘ Screening estimate from a state-policy table — verify with the county assessor before closing.
Climate risk First Street
- Flood 8/10 Severe FEMA zone X · 60% chance over 30 yrs
- Wildfire 1/10 Low
- Heat 10/10 Extreme 7 d/yr ≥108°F today · 21 d/yr by 30 yrs out
- Wind 10/10 Extreme 99% chance of damaging wind over 30 yrs
- Air quality 2/10 Low 2 unhealthy d/yr today · 2 by 30 yrs out
Nearby sold comps map
Loading sold comps map…
Walkable amenities ~0.75 mi
Loading nearby amenities…
Taxation est. · year 1
- Rental income
- $19,407
- − Mortgage interest
- −$5,181
- − Property taxes
- −$1,395
- − Insurance
- −$1,260
- − Repairs & maintenance
- −$1,553
- − Management
- −$1,553
- − Depreciation
- −$2,691
- Taxable income
- $5,775
- Est. tax owed @ 24.0%
- −$1,386
- After-tax cash flow
- $5,470/yr
For passive investors: Depreciation is non-cash, so a rental often shows a tax loss while cash-flowing — sheltering income. Rental losses are passive: they offset passive income freely, and up to $25,000/yr can offset ordinary (W-2) income if you actively participate and your MAGI is under $100k (phasing out to $0 by $150k); unused losses carry forward. On sale, claimed depreciation is recaptured at up to 25%, and gains may owe capital-gains tax (a 1031 exchange can defer both). Figures are a year-1 estimate at your 24.0% rate — not tax advice; consult a CPA.
Schools (NCES district)
- District
- Orleans Parish
- NCES district ID
- 2201170
- Math proficiency
- 11% ▼ -52.00%
- Reading proficiency
- 27% ▼ -46.00%
- Median HH income
- $37,011
- Composite
- 15.78/100
- National rank
- #9271
- State rank
- #69 of 98 in LA
Livability — New Orleans
- Score
- 81/100
- State rank
- #3
- US rank
- #1383
Category grades
Schools grade is shown separately in the Schools card above.
Census & demographics
- Census place
- New Orleans, LA
- County
- Orleans Parish · 338,817 people
- City population
- 338,817
- Metro
- New Orleans-Metairie, LA
- Population (ZIP)
- 22,659
- Household income
- $43,493
- Rent vs Own
- Severe rent burden
- 2240.0
Population outlook (Orleans County) Hauer SSP2
- Today (2025)
- 513,025 people
- By 2030
- 575,781 · +12.2%
- By 2040
- 700,174 · +36.5%
- By 2050
- 826,541 · +61.1%
- By 2075
- 1,123,374 · +119.0%
- By 2100
- 1,355,609 · +164.2%
Race, ethnicity, and origin ACS 2023
- Neighborhood character
- Predominantly Black (72%)
- Race & ethnicity
- Black 72% White 16% Hispanic / Latino 8% Two or more races 5%
- Hispanic origin (detail)
- Mexican 2% Puerto Rican 1%
- Common ancestry
- Lithuanian 3% Slovak 1% Italian 1%
- Foreign-born
- 5% · Canada
- Languages at home
- 91% English-only · Spanish 6% French/Haitian/Cajun 2% Other Indo-European 1%
Political lean MEDSL · Orleans
- 2024 margin
- Solid D (+67.0) · D 82.2% · R 15.2% · Other 2.7%
- 2008→2024 swing
- +6.7pp toward D · 2008: 60.3pp · 2024: 67.0pp
- All cycles
- 2024: D+67.0 2020: D+68.2 2016: D+66.2 2012: D+62.5 2008: D+60.3
Not yet ingested
- Civics
- —
Market trends
- HPI YoY
- ▼ -98.56%
- Current HPI
- 149.0172
- Rent YoY
- ▼ -0.72%
- Metro
- New Orleans-Metairie, LA
- State GDP YoY
- ▲ 3.29%
- F500 in state
- 10
Industry mix (Fortune 500 HQ in LA)
| Industry | F500 HQs | Revenue |
|---|---|---|
| Telecommunications | 2 | $23B |
|
||
| Utilities | 1 | $12B |
|
||
| Wholesale / Distribution | 1 | $5B |
|
||
| Advertising | 1 | $2B |
|
||
Price history
+136.0% since first listed35 events — show timeline
- 2026-05-20 Pending — AcadianaMLS
- 2026-05-18 Listed $92,500 AcadianaMLS
- 2019-05-08 Sold (Public Records) $109,900 Public Records
- 2019-05-01 Sold (MLS) $109,900 GSREIN
- 2019-03-08 Pending — GSREIN
- 2019-02-16 Price Changed $109,900 GSREIN
- 2019-02-05 Listed $119,000 GSREIN
- 2019-02-05 Listed $109,900 AcadianaMLS
- 2019-01-29 Price Changed $121,800 GSREIN
- 2019-01-27 Price Changed $121,999 GSREIN
- 2019-01-26 Price Changed $122,500 GSREIN
- 2019-01-24 Price Changed $122,999 GSREIN
- 2019-01-24 Price Changed $123,000 GSREIN
- 2019-01-23 Price Changed $123,500 GSREIN
- 2019-01-22 Price Changed $124,999 GSREIN
- 2019-01-21 Price Changed $125,900 GSREIN
- 2019-01-20 Price Changed $125,999 GSREIN
- 2019-01-18 Price Changed $125,799 GSREIN
- 2019-01-15 Price Changed $125,900 GSREIN
- 2019-01-14 Price Changed $125,999 GSREIN
- 2019-01-11 Price Changed $126,299 GSREIN
- 2019-01-10 Price Changed $126,300 GSREIN
- 2019-01-08 Price Changed $126,500 GSREIN
- 2019-01-05 Price Changed $127,000 GSREIN
- 2019-01-05 Price Changed $12,700 GSREIN
- 2019-01-03 Price Changed $127,500 GSREIN
- 2018-12-29 Price Changed $128,000 GSREIN
- 2018-12-22 Price Changed $128,500 GSREIN
- 2018-12-13 Price Changed $128,999 GSREIN
- 2018-12-03 Price Changed $129,500 GSREIN
- 2018-11-19 Price Changed $129,800 GSREIN
- 2018-11-08 Listed $121,800 AcadianaMLS
- 2014-07-22 Sold (Public Records) $13,000 Public Records
- 1994-03-11 Sold (Public Records) $13,000 Public Records
- 1981-04-28 Sold (Public Records) $39,200 Public Records
Property tax history
+19.6%/yrLatest (2026): $1,395 · +183.8% YoY. Source: county tax records.
Cash-flow waterfall
monthlySold comps — $/sqft
last 12 mo · ≤1 miLoading sold comps…