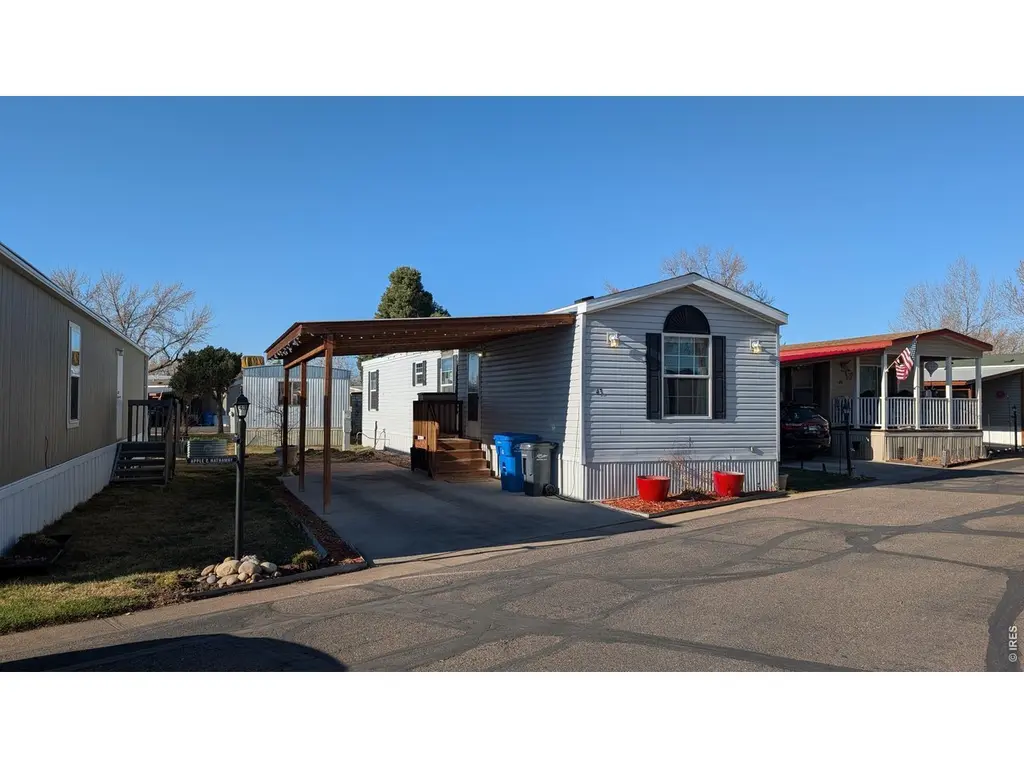
1601 N College Ave #43 · Fort Collins, CO
Flood risk 1/10 · Minimal
- FEMA flood zone
- X (unshaded)
- Chance of flooding over 30 yrs
- 0.0%
- Est. flood insurance / yr
- $507 – $1,088
Fire risk 3/10 · Minor
- Est. fire insurance / yr
- $939 – $1,743
Heat risk 3/10 · Minor
- Hot days now (above 91°F)
- 7 days/yr
- Hot days in 30 yrs
- 18 days/yr
Wind risk 1/10 · Minimal
- Chance of severe wind over 30 yrs
- —
Air-quality risk 6/10 · Moderate
- Unhealthy air days now
- 13 days/yr
- Unhealthy air days in 30 yrs
- 13 days/yr
Risk factors via First Street. Map © Google.
Why this score? — see what drove the B grade
The composite is a weighted blend of 9 inputs, each scored 0–100. Each bar is that input's sub-score; the figure is the points it added to the 100-point composite (weight × sub-score).
- Cash flow +30.0/30.0
- 1% rule +10.0/10.0
- DSCR +10.0/10.0
- ARV discount +6.1/15.0
- Schools +4.5/10.0
- Livability +4.0/5.0
- Rent growth +3.5/5.0
- Condition / age +2.5/5.0
- Appreciation +0.0/10.0
$52,000
🖨 Deal sheet 📄 Offer letter ✓ Due diligence
Listing remarks
Welcome Home! Only minutes from downtown Ft Collins, this move in ready home in a gated 55+ community is awaiting it's new owner. With a new roof and open concept, with plenty of storage this home has it all. Primary bedroom has it's own private walk-in shower. All appliances included, even the washer/dryer. Only minutes from hiking/biking trails, shopping and restaurants.
Key facts
- Gated community
- Hiking biking trails
- Open concept
Tags
Property features AI
Finance
- Other: No recorded improvements
- HOA & community: No association fees
Exterior
- Parking: Carport
- Utilities: City water with meter installed; Natural gas available (Xcel); Electricity available
- Home design: Manufactured in park; Mobile home
- Construction: Vinyl siding; Other construction materials; Composition roof
- Exterior features: Storage structure; Post and pier foundation
Interior
- Kitchen: Electric range; Dishwasher; Refrigerator; Microwave; Disposal
- Bedrooms: 2 bedrooms
- Bathrooms: 1 full bathroom; 1 three-quarter bathroom
- Heating & cooling: Forced air heating; Central air conditioning
- Interior features: Eat-in kitchen; Window coverings; Fire alarm; Some furniture included
- Laundry & utility: Washer; Dryer
Neighborhood map
What this means for you Summary
Snapshot
- This is a 2-bed/2.0-bath manufactured listed at $52k.
Deal economics
- At list price, monthly cash flow is $948 ($11k/yr) — positive.
- The deal already cash-flows at list — no discount required.
- Meets the 1% rule at list price ($2k rent vs $52k).
- Recommended offer: $50k (3.0% below list) — sets the bar for market timing.
- Cap rate 28.2% vs local median 2.6% in Fort Collins — top-decile yield for the area; either an underpriced asset or a hidden risk that comps aren't pricing in. Stress-test before assuming the spread holds.
Location & tenants
- Location reads 80/100 on livability (#11 in CO, #1,750 nationally) — a professional / high-income tenant draw. Strengths: amenities A+, commute A+, health & safety A+; Watch: cost of living F.
- Poudre School District R-1 (urban): math 45% / reading 60% proficiency, ranked #10 of 86 in CO (top 12%) — acceptable for families but not a draw, mixed tenant base, ~2y average lease.
- Market conditions: Rents rising fast (+4.1%/yr); 422 active listings in the ZIP; 12 comparable units currently listed for rent nearby; rentals at typical pace (median 21d on market — plan ~3-4 weeks tenant-placement turnaround); solid renter incomes; 1,786 units permitted in Larimer County in 2024 (402 in 5+ unit buildings).
Forward outlook
- Local home prices are declining (-3.0%/yr); year-one equity from $360 of loan paydown is wiped out by about $2k of value loss. Plan a longer hold.
- Larimer County population projected at +51% by 2050 — long-run rental-demand tailwind backs the buy-and-hold thesis.
- At projected returns (-3.0% appreciation + 4.1% rent growth), your $15k cash investment doubles in ~2 years — after that, you're playing with house money.
Negotiation context
- It's been on market 49 days — a 3% lower offer ($50k) is reasonable based on typical stale-listing flexibility.
- 5 sale attempts since 2y ago with the ask held roughly flat each time — persistent listings suggest the price (not the market) is what's stuck; bring a comps-based counter.
Questions for the listing agent
- It's been on market 49 days. Have you received any prior offers? Is the seller open to a 3% concession, seller financing, or rate buy-down credit?
- Is there a deadline driving the sale (1031 exchange, divorce, estate, relocation)? That informs how much negotiation room exists.
- Schools are B-rated — typically a magnet for longer-tenancy family renters. What's the average tenant stay here, and is there a school-zone premium baked into asking?
- What's the average days-on-market for RENTAL listings here right now (not sales)? A rising rental-DOM trend means longer vacancies and softer asking-rent achievability than the comps imply.
- What's the recent tenant-quality profile in this submarket — average credit score on applications, eviction rate, late-payment / NSF rate, and stable-employment percentage? A property-management company in the area should have these aggregated.
- How much new for-sale + rental construction is in the pipeline within 1–3 miles? Heavy new supply typically softens prices + rents 12–24 months out; constrained supply supports both.
Investment metrics
- 1% rule
- 3.06% ✓
- Cap rate
- 28.17%
- Cash-on-cash
- 78.15%
- DSCR
- 4.48
- GRM
- 2.7
CMA / ARV
- ARV (on-the-fly)
- $50,400
- Comps found
- 12
Show comp detail 12 sales within ~0.75 mi
| Address | Dist | Beds/Ba | Sqft | Sold | Price | $/sf | Match |
|---|---|---|---|---|---|---|---|
| 1601 N College Ave #41 | 0.00mi | 2/2.0 | 840 (0%) | 1mo | $32,000 | $38 | 99 |
| 1601 N College Ave #77 | 0.00mi | 2/2.0 | 840 (0%) | 23mo | $70,000 | $83 | 80 |
| 1601 N College Ave #144 | 0.00mi | 2/2.0 | 896 (+7%) | 13mo | $48,000 | $54 | 78 |
| 1601 N College Ave #330 | 0.00mi | 2/2.0 | 938 (+12%) | 11mo | $19,500 | $21 | 72 |
| 1601 N College Ave #274 | 0.00mi | 2/1.5 | 938 (+12%) | 12mo | $67,000 | $71 | 68 |
| 1601 N College Ave #134 | 0.00mi | 2/1.0 | 728 (-13%) | 9mo | $26,500 | $36 | 66 |
| 1601 N College Ave #11 | 0.00mi | 3/2.0 (+1) | 960 (+14%) | 9mo | $11,000 | $11 | 64 |
| 1601 N College Ave #343 | 0.00mi | 2/2.0 | 924 (+10%) | 23mo | $75,000 | $81 | 64 |
| 1601 N College Ave #352 | 0.00mi | 2/2.0 | 952 (+13%) | 17mo | $35,000 | $37 | 64 |
| 1601 N College Ave #270 | 0.00mi | 2/1.0 | 938 (+12%) | 21mo | $67,500 | $72 | 59 |
| 2025 N College Ave #243 | 0.47mi | 3/2.0 (+1) | 924 (+10%) | 11mo | $55,000 | $60 | 48 |
| 301 Spaulding Ln #35 | 0.55mi | 3/2.0 (+1) | 938 (+12%) | 22mo | $90,000 | $96 | 31 |
Match score weights: distance 35% · size 25% · config 20% · recency 20%. Top-matched comps best support the ARV.
Projected returns pro-forma
-3.0% appreciation · 4.13% rent growth · sell at horizon
- IRR
- 79.4%
- Equity multiple
- 4.69×
- Total profit
- $53,788
- Equity at exit
- $7,753
- IRR
- 83.2%
- Equity multiple
- 10.08×
- Total profit
- $132,265
- Equity at exit
- $4,496
Cash invested: $14,560 (down + closing). Projections, not guarantees.
Landlord ↔ Tenant lean methodology
- Overall (STATE)
- 38 Tenant-Leaning
- State Colorado
- 38 Tenant-Leaning · D+4
- County
- — inherits STATE
- City
- — inherits STATE
ZIP-level market 80524
- Rents YoY
- 4.1%
- Active inventory
- 422
- Price-to-rent
- 2.7×
Monthly cashflow live
- Estimated rent
- $1,593 high interval (Pro) →
- Mortgage (P&I)
- −$273
- Tax from tax record
- −$16 /mo · $192/yr
- Insurance
- −$22
- HOA
- −$0
- Vacancy / Maint / Mgmt
- −$335
- Net cashflow
- $948
Break-even live
UW: 25.0% down · 7.5% · 30yr · 1.5% tax · 5.0% vac · 8.0% maint · 8.0% mgmt
Financing live
Cash to close
- Down payment
- $13,000
- Closing costs
- $1,560
- Reserves months
- —
- Total cash needed
- —
Loan-product check · same deal, 3 products live
Conventional
25% down · 7.5% · 30yr
- Down + closing
- —
- Monthly P&I
- —
- Monthly cashflow
- —
- DSCR
- —
- Eligible?
- —
Personal DTI + credit; lowest rate.
DSCR
20% down · 8.5% · 30yr
- Down + closing
- —
- Monthly P&I
- —
- Monthly cashflow
- —
- DSCR
- —
- Eligible?
- —
No personal income docs; deal must DSCR.
Hard money
10% down · 12.0% · 12mo
- Down + closing
- —
- Monthly P&I
- —
- Monthly cashflow
- —
- DSCR
- —
- Eligible?
- —
Short-term bridge; refi at stabilization.
Rent comps 12 comps
| Address | Beds | Baths | Sqft | Rent | $/sqft | DOM | Units | Dist |
|---|---|---|---|---|---|---|---|---|
| 1601 N College Ave #60 Fort Collins, CO | 2.0 | 1.0 | 784 | $1,150 | $1.47 | 23d | 1 | 0.03mi |
| 1713 Aspen St Fort Collins, CO | 1.0 | 1.0 | 660 | $1,500 | $2.27 | 21d | 1 | 0.26mi |
| 1331 Redwood St Fort Collins, CO | 2.0 | 1.5–2.0 | 1154 | $1,598 | $1.38 | 13d | 2 | 0.59mi |
| 311 N Mason St Fort Collins, CO | 2.0 | 1.0–2.0 | 645 | $2,115 | $3.28 | 13d | 7 | 1.15mi |
| 310 N Mason St Fort Collins, CO | 2.0 | 1.0–2.0 | 690 | $2,339 | $3.39 | 13d | 8 | 1.17mi |
| 281 Willow St Fort Collins, CO | 2.0 | 1.0–2.0 | 694 | $2,766 | $3.99 | 13d | 20 | 1.23mi |
| 2636 Terry Lake Rd Fort Collins, CO | 2.0 | 1.0 | 856 | $1,825 | $2.13 | 13d | 1 | 1.24mi |
| 527 West St Unit 2 Fort Collins, CO | 2.0 | 1.0 | 850 | $1,395 | $1.64 | 13d | 1 | 1.25mi |
| 172 N College Ave Fort Collins, CO | 1.0–2.0 | 1.0 | 462 | $1,723 | $3.73 | 23d | 4 | 1.35mi |
| 308 West St Fort Collins, CO | 2.0 | 1.0 | 719 | $1,500 | $2.09 | 23d | 1 | 1.41mi |
| 612 9th St Fort Collins, CO | 2.0 | 1.0 | 896 | $1,800 | $2.01 | 23d | 1 | 1.44mi |
| 221 E Mountain Ave #315 Fort Collins, CO | 1.0 | 1.5 | 781 | $2,600 | $3.33 | 23d | 1 | 1.49mi |
Listing history 27 events
-
2026-06-18days on market $52,000 Active 49 DOM
-
2026-06-17days on market $52,000 Active 48 DOM
-
2026-06-16days on market $52,000 Active 47 DOM
-
2026-06-15days on market $52,000 Active 46 DOM
-
2026-06-14days on market $52,000 Active 44 DOM
-
2026-06-10days on market $52,000 Active 41 DOM
-
2026-06-09days on market $52,000 Active 40 DOM
-
2026-06-08days on market $52,000 Active 39 DOM
-
2026-06-07days on market $52,000 Active 38 DOM
-
2026-06-03days on market $52,000 Active 34 DOM
-
2026-06-02days on market $52,000 Active 33 DOM
-
2026-06-01days on market $52,000 Active 32 DOM
-
2026-05-31days on market $52,000 Active 31 DOM
-
2026-05-30days on market $52,000 Active 30 DOM
-
2026-04-30$52,000 Active
-
2025-10-20historical
-
2025-08-22price $78,000
-
2025-07-29price $79,000
-
2025-07-17price $82,500
-
2025-06-17status Active
-
2025-06-17$88,000 Active
-
2025-05-16historical
-
2025-05-16historical
-
2025-05-12$88,000 Active
-
2024-08-09soldstatus $68,500 Sold
-
2024-07-29status Pending
-
2024-06-21$68,500 Active
ⓘ Source: listings_history table (triggers on properties + properties_extension) + one-shot
backfill from property_details.listing_events for pre-trigger history.
Tax reassessment forecast CO · Resets to sale price
- Current annual tax
- $192 · $16/mo
- Projected year-2 tax
- $286 · $24/mo
- Expected delta
- +$94/yr (+$8/mo · 49.1%)
ⓘ Screening estimate from a state-policy table — verify with the county assessor before closing.
Climate risk First Street
- Flood 1/10 Low FEMA zone X (unshaded) · 0% chance over 30 yrs
- Wildfire 3/10 Moderate
- Heat 3/10 Moderate 7 d/yr ≥91°F today · 18 d/yr by 30 yrs out
- Wind 1/10 Low
- Air quality 6/10 Major 13 unhealthy d/yr today · 13 by 30 yrs out
Nearby sold comps map
Loading sold comps map…
Walkable amenities ~0.75 mi
Loading nearby amenities…
Taxation est. · year 1
- Rental income
- $19,117
- − Mortgage interest
- −$2,913
- − Property taxes
- −$192
- − Insurance
- −$260
- − Repairs & maintenance
- −$1,529
- − Management
- −$1,529
- − Depreciation
- −$1,513
- Taxable income
- $11,181
- Est. tax owed @ 24.0%
- −$2,683
- After-tax cash flow
- $8,695/yr
For passive investors: Depreciation is non-cash, so a rental often shows a tax loss while cash-flowing — sheltering income. Rental losses are passive: they offset passive income freely, and up to $25,000/yr can offset ordinary (W-2) income if you actively participate and your MAGI is under $100k (phasing out to $0 by $150k); unused losses carry forward. On sale, claimed depreciation is recaptured at up to 25%, and gains may owe capital-gains tax (a 1031 exchange can defer both). Figures are a year-1 estimate at your 24.0% rate — not tax advice; consult a CPA.
Schools (NCES district)
- District
- Poudre School District R-1
- NCES district ID
- 0803990
- Math proficiency
- 45% ▼ -7.00%
- Reading proficiency
- 60% ▼ -2.00%
- Median HH income
- $57,281
- Composite
- 45.5/100
- National rank
- #2610
- State rank
- #10 of 86 in CO
Livability — Fort Collins
- Score
- 80/100
- State rank
- #11
- US rank
- #1750
Category grades
Schools grade is shown separately in the Schools card above.
Census & demographics
- Census place
- Fort Collins, CO
- County
- Larimer County · 338,255 people
- City population
- 202,303
- Metro
- Fort Collins, CO
- Population (ZIP)
- 40,030
- Household income
- $85,035
- Rent vs Own
- Severe rent burden
- 1860.0
Population outlook (Larimer County) Hauer SSP2
- Today (2025)
- 415,361 people
- By 2030
- 457,762 · +10.2%
- By 2040
- 542,310 · +30.6%
- By 2050
- 627,048 · +51.0%
- By 2075
- 833,722 · +100.7%
- By 2100
- 952,590 · +129.3%
Race, ethnicity, and origin ACS 2023
- Neighborhood character
- Predominantly White (77%)
- Race & ethnicity
- White 77% Hispanic / Latino 17% Two or more races 11% Asian 1% Native American 1%
- Hispanic origin (detail)
- Mexican 13%
- Common ancestry
- Slovak 3% Portuguese 3% Italian 3%
- Foreign-born
- 8% · Canada
- Languages at home
- 88% English-only · Spanish 10% German/W. Germanic 1%
Political lean MEDSL · Larimer
- 2024 margin
- D (+17.6) · D 57.4% · R 39.8% · Other 2.9%
- 2008→2024 swing
- +7.9pp toward D · 2008: 9.7pp · 2024: 17.6pp
- All cycles
- 2024: D+17.6 2020: D+15.4 2016: D+4.9 2012: D+5.2 2008: D+9.7
Not yet ingested
- Civics
- —
Market trends
- HPI YoY
- ▼ -581.67%
- Current HPI
- 274.4026
- Rent YoY
- ▲ 4.13%
- Metro
- Fort Collins, CO
- State GDP YoY
- ▲ 1.95%
- F500 in state
- 14
Industry mix (Fortune 500 HQ in CO)
| Industry | F500 HQs | Revenue |
|---|---|---|
| Technology Distribution | 1 | $31B |
|
||
| Food / Agriculture | 1 | $18B |
|
||
| Packaging | 1 | $14B |
|
||
| Healthcare | 1 | $13B |
|
||
| Energy | 1 | $10B |
|
||
| Technology | 1 | $4B |
|
||
Price history
-24.1% since first listed13 events — show timeline
- 2026-04-30 Listed $52,000 IRES
- 2025-10-20 Listing Removed — IRES
- 2025-08-22 Price Changed $78,000 IRES
- 2025-07-29 Price Changed $79,000 IRES
- 2025-07-17 Price Changed $82,500 IRES
- 2025-06-17 Relisted — IRES
- 2025-06-17 Listed $88,000 IRES
- 2025-05-16 Listing Removed — IRES
- 2025-05-16 Listing Removed — IRES
- 2025-05-12 Listed $88,000 IRES
- 2024-08-09 Sold (MLS) $68,500 IRES
- 2024-07-29 Pending — IRES
- 2024-06-21 Listed $68,500 IRES
Property tax history
-5.0%/yrLatest (2025): $192 · +99.9% YoY. Source: county tax records.
Cash-flow waterfall
monthlySold comps — $/sqft
last 12 mo · ≤1 miLoading sold comps…