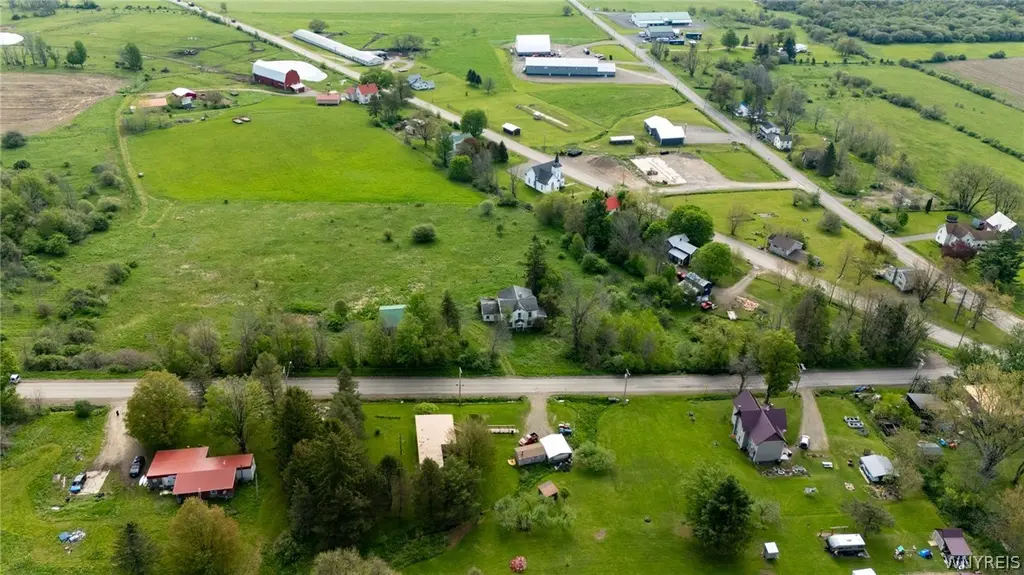
11028 Bliss Rd · Bliss, NY
Flood risk 1/10 · Minimal
- FEMA flood zone
- —
- Chance of flooding over 30 yrs
- 0.0%
- Est. flood insurance / yr
- —
Fire risk 1/10 · Minimal
- Est. fire insurance / yr
- $691 – $1,283
Heat risk 1/10 · Minimal
- Hot days now (above 88°F)
- 7 days/yr
- Hot days in 30 yrs
- 17 days/yr
Wind risk 1/10 · Minimal
- Chance of severe wind over 30 yrs
- —
Air-quality risk 1/10 · Minimal
- Unhealthy air days now
- 0 days/yr
- Unhealthy air days in 30 yrs
- 0 days/yr
Risk factors via First Street. Map © Google.
Why this score? — see what drove the B grade
The composite is a weighted blend of 9 inputs, each scored 0–100. Each bar is that input's sub-score; the figure is the points it added to the 100-point composite (weight × sub-score).
- Cash flow +30.0/30.0
- 1% rule +10.0/10.0
- DSCR +10.0/10.0
- ARV discount +7.5/15.0
- Appreciation +5.0/10.0
- Schools +4.4/10.0
- Livability +2.9/5.0
- Rent growth +2.5/5.0
- Condition / age +2.5/5.0
$59,900
🖨 Deal sheet (PDF) 📄 Offer letter ✓ Due diligence
Listing remarks
Mostly fenced 4.8-acre lot in the Town of Centerville featuring a single-story barn with four horse stalls. A drilled well and septic system are in place. Electricity is available at the site. The existing house is a total loss and will need to be removed. Priced to reflect current condition, a solid location for someone looking to build or expand an existing operation. Property sold as-is.
Key facts
- Four horse stalls
- Single-story barn
- Fenced lot
Tags
Property features AI
Finance
- Other: Located on County Road frontage
- Financial info: Property previously used as or suitable for single-family and recreational purposes
Exterior
- Parking: Dirt driveway access
- Utilities: Electricity available; Well water; Septic tank
- Home design: Two-story house
- Construction: Built as a single-family property
- Exterior features: Dirt driveway; Barn(s) on the property; Rectangular, residential rural lot
Interior
- Bathrooms: 1 full bathroom
- Interior features: Level topography in places; see remarks for additional site details
Neighborhood map
What this means for you Summary
Snapshot
- This is a 4-bed/1.0-bath single-family listed at $60k.
Deal economics
- At list price, monthly cash flow is $530 ($6k/yr) — positive.
- The deal already cash-flows at list — no discount required.
- Meets the 1% rule at list price ($1k rent vs $60k).
Location & tenants
- Location reads 58/100 on livability (#1,065 in NY) — a working-class tenant base; expect higher turnover. Strengths: cost of living A+, housing A+; Watch: schools F, crime F, amenities F.
- Fillmore Central School District (rural): math 52% / reading 53% proficiency, ranked #359 of 590 in NY (top 61%) — acceptable for families but not a draw, mixed tenant base, ~2y average lease.
- Market conditions: 2 active listings in the ZIP; 87 units permitted in Allegany County in 2024 (0 in 5+ unit buildings).
Forward outlook
- In year one you build about $2k of equity ($414 loan paydown + $2k appreciation (3.0% local appreciation)).
- Allegany County population projected at -26% by 2050 — secular population decline; favor cash flow + early exit over multi-decade hold.
- At projected returns (3.0% appreciation + 3.0% rent growth), your $17k cash investment doubles in ~2 years — after that, you're playing with house money.
Negotiation context
- Only 9 days on market — expect competitive offers; lowballing is unlikely to land.
Risks & watch-outs
- Watch-outs: property tax is 4.6% of price; built in 1900 — expect roof / HVAC / electrical / plumbing capex.
Questions for the listing agent
- Built in 1900 — when were the roof, HVAC, electrical panel, plumbing, and water heater last replaced?
- Property tax is high relative to price — has the assessment been appealed recently, and will the sale trigger a re-assessment?
- Is there a deadline driving the sale (1031 exchange, divorce, estate, relocation)? That informs how much negotiation room exists.
- Schools are F-rated, which usually means shorter tenancies and higher turnover. Who's the typical renter profile here, and what's been the actual vacancy rate?
- Crime grade is F in this area — have there been break-ins, vandalism, or insurance claims at this property in the last 3 years? What carrier currently insures it and at what premium?
- What's the average days-on-market for RENTAL listings here right now (not sales)? A rising rental-DOM trend means longer vacancies and softer asking-rent achievability than the comps imply.
- What's the recent tenant-quality profile in this submarket — average credit score on applications, eviction rate, late-payment / NSF rate, and stable-employment percentage? A property-management company in the area should have these aggregated.
- How much new for-sale + rental construction is in the pipeline within 1–3 miles? Heavy new supply typically softens prices + rents 12–24 months out; constrained supply supports both.
Investment metrics
- 1% rule
- 2.32% ✓
- Cap rate
- 16.91%
- Cash-on-cash
- 37.91%
- DSCR
- 2.69
- GRM
- 3.6
CMA / ARV
No comps found within radius.
Projected returns pro-forma
3.0% appreciation · 3.0% rent growth · sell at horizon
- IRR
- 43.5%
- Equity multiple
- 3.45×
- Total profit
- $41,075
- Equity at exit
- $26,934
- IRR
- 43.4%
- Equity multiple
- 6.91×
- Total profit
- $99,104
- Equity at exit
- $41,508
Cash invested: $16,772 (down + closing). Projections, not guarantees.
Landlord ↔ Tenant lean methodology
- Overall (STATE)
- 15 Strongly Tenant-Friendly
- State New York
- 15 Strongly Tenant-Friendly · D+10
- County
- — inherits STATE
- City
- — inherits STATE
ZIP-level market 14029
- Active inventory
- 2
- Price-to-rent
- 3.6×
Monthly cashflow live
- Estimated rent
- $1,392 medium interval (Pro) →
- Mortgage (P&I)
- −$314
- Tax from tax record
- −$231 /mo · $2,768/yr
- Insurance
- −$25
- HOA
- −$0
- Vacancy / Maint / Mgmt
- −$292
- Net cashflow
- $530
Break-even live
Sensitivity live
| Price | -10% $727 | -5% $547 | +0% $530 | +5% $513 | +10% $496 |
|---|---|---|---|---|---|
| Rent | -10% $420 | -5% $475 | +0% $530 | +5% $585 | +10% $640 |
| Rate | -1.0pp $560 | -0.5pp $545 | base $530 | +0.5pp $514 | +1.0pp $498 |
UW: 25.0% down · 7.5% · 30yr · 1.5% tax · 5.0% vac · 8.0% maint · 8.0% mgmt
Financing live
Cash to close
- Down payment
- $14,975
- Closing costs
- $1,797
- Reserves months
- —
- Total cash needed
- —
Loan-product check · same deal, 3 products live
Conventional
25% down · 7.5% · 30yr
- Down + closing
- —
- Monthly P&I
- —
- Monthly cashflow
- —
- DSCR
- —
- Eligible?
- —
Personal DTI + credit; lowest rate.
DSCR
20% down · 8.5% · 30yr
- Down + closing
- —
- Monthly P&I
- —
- Monthly cashflow
- —
- DSCR
- —
- Eligible?
- —
No personal income docs; deal must DSCR.
Hard money
10% down · 12.0% · 12mo
- Down + closing
- —
- Monthly P&I
- —
- Monthly cashflow
- —
- DSCR
- —
- Eligible?
- —
Short-term bridge; refi at stabilization.
Listing history 8 events
-
2026-06-21days on market $59,900 Active 9 DOM
-
2026-06-18days on market $59,900 Active 7 DOM
-
2026-06-17days on market $59,900 Active 6 DOM
-
2026-06-16days on market $59,900 Active 5 DOM
-
2026-06-15days on market $59,900 Active 4 DOM
-
2026-06-13days on market $59,900 Active 2 DOM
-
2026-06-12remarks 393-char remark
-
2026-06-12$59,900 Active 1 DOM
ⓘ Source: listings_history table (triggers on properties + properties_extension) + one-shot
backfill from property_details.listing_events for pre-trigger history.
Tax reassessment forecast NY · Partial reset (capped growth)
- Current annual tax
- $2,768 · $231/mo
- Projected year-2 tax
- $2,768 · $231/mo
- Expected delta
- $0/yr ($0/mo · 0.0%)
ⓘ Screening estimate from a state-policy table — verify with the county assessor before closing.
Climate risk First Street
- Flood 1/10 Low 0% chance over 30 yrs
- Wildfire 1/10 Low
- Heat 1/10 Low 7 d/yr ≥88°F today · 17 d/yr by 30 yrs out
- Wind 1/10 Low
- Air quality 1/10 Low 0 unhealthy d/yr today · 0 by 30 yrs out
Nearby sold comps map
Loading sold comps map…
Walkable amenities ~0.75 mi
Loading nearby amenities…
Taxation est. · year 1
- Rental income
- $16,702
- − Mortgage interest
- −$3,355
- − Property taxes
- −$2,768
- − Insurance
- −$300
- − Repairs & maintenance
- −$1,336
- − Management
- −$1,336
- − Depreciation
- −$1,743
- Taxable income
- $5,864
- Est. tax owed @ 24.0%
- −$1,407
- After-tax cash flow
- $4,950/yr
For passive investors: Depreciation is non-cash, so a rental often shows a tax loss while cash-flowing — sheltering income. Rental losses are passive: they offset passive income freely, and up to $25,000/yr can offset ordinary (W-2) income if you actively participate and your MAGI is under $100k (phasing out to $0 by $150k); unused losses carry forward. On sale, claimed depreciation is recaptured at up to 25%, and gains may owe capital-gains tax (a 1031 exchange can defer both). Figures are a year-1 estimate at your 24.0% rate — not tax advice; consult a CPA.
Schools (NCES district)
- District
- Fillmore Central School District
- NCES district ID
- 3611070
- Math proficiency
- 52% ▼ -12.00%
- Reading proficiency
- 53% ▼ -8.00%
- Median HH income
- $41,114
- Composite
- 44.01/100
- National rank
- #2889
- State rank
- #359 of 590 in NY
Livability — Bliss
- Score
- 58/100
- State rank
- #1065
- US rank
- #21289
Category grades
Schools grade is shown separately in the Schools card above.
Census & demographics
- City population
- 1,606
- Population (ZIP)
- 31
Population outlook (Allegany County) Hauer SSP2
- Today (2025)
- 45,362 people
- By 2030
- 43,078 · -5.0%
- By 2040
- 38,031 · -16.2%
- By 2050
- 33,634 · -25.9%
- By 2075
- 25,285 · -44.3%
- By 2100
- 18,902 · -58.3%
Race, ethnicity, and origin ACS 2023
- Neighborhood character
- Predominantly White (100%)
- Race & ethnicity
- White 100%
- Common ancestry
- Iranian 19% Lithuanian 6%
Political lean MEDSL · Allegany
- 2024 margin
- Solid R (+43.2) · D 28.4% · R 71.6%
- 2008→2024 swing
- -21.5pp toward R · 2008: -21.7pp · 2024: -43.2pp
- All cycles
- 2024: R+43.2 2020: R+38.9 2016: R+42.3 2012: R+25.3 2008: R+21.7
Not yet ingested
- Civics
- —
Market trends
- HPI YoY
- —
- Current HPI
- —
- Rent YoY
- —
- Metro
- —
- State GDP YoY
- ▲ 2.60%
- F500 in state
- 92
Industry mix (Fortune 500 HQ in NY)
| Industry | F500 HQs | Revenue |
|---|---|---|
| Financial Services | 10 | $950B |
|
||
| Consumer Goods | 9 | $162B |
|
||
| Insurance | 4 | $225B |
|
||
| Telecommunications | 2 | $144B |
|
||
| Pharmaceuticals | 2 | $112B |
|
||
| Media / Entertainment | 2 | $69B |
|
||
Price history
1 event — show timeline
- 2026-06-11 Listed $59,900 WNYREIS
Property tax history
+1.1%/yrLatest (2025): $2,768 · +0.6% YoY. Source: county tax records.
Cash-flow waterfall
monthlySold comps — $/sqft
last 12 mo · ≤1 miLoading sold comps…