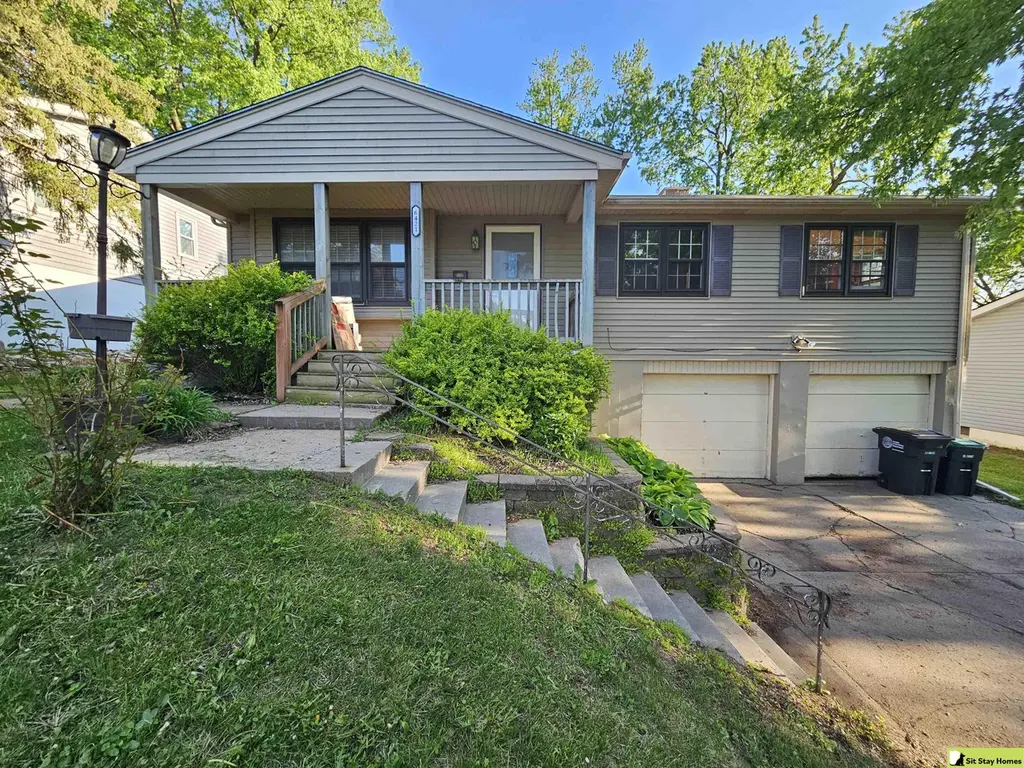
6421 Ogden St · Omaha, NE
Flood risk 1/10 · Minimal
- FEMA flood zone
- X (unshaded)
- Chance of flooding over 30 yrs
- 0.0%
- Est. flood insurance / yr
- $473 – $860
Fire risk 1/10 · Minimal
- Est. fire insurance / yr
- $1,161 – $2,155
Heat risk 3/10 · Minor
- Hot days now (above 104°F)
- 7 days/yr
- Hot days in 30 yrs
- 15 days/yr
Wind risk 2/10 · Minimal
- Chance of severe wind over 30 yrs
- —
Air-quality risk 2/10 · Minimal
- Unhealthy air days now
- 0 days/yr
- Unhealthy air days in 30 yrs
- 1 days/yr
Risk factors via First Street. Map © Google.
Why this score? — see what drove the C- grade
The composite is a weighted blend of 9 inputs, each scored 0–100. Each bar is that input's sub-score; the figure is the points it added to the 100-point composite (weight × sub-score).
- Cash flow +17.4/30.0
- ARV discount +15.0/15.0
- DSCR +5.4/10.0
- 1% rule +4.9/10.0
- Livability +4.2/5.0
- Rent growth +3.1/5.0
- Condition / age +2.5/5.0
- Schools +2.1/10.0
- Appreciation +0.0/10.0
$180,000
🖨 Deal sheet 📄 Offer letter ✓ Due diligence
Listing remarks
Investor special backing golf course! Great opportunity to build sweat equity. Large fenced back yard overlooking Benson golf course. Inside this home feels larger than it looks. Hardwood floors throughout the main floor. Living room is open to the dining room and kitchen. Newer Furnace and A/C. Vinyl siding. Extra non conforming room in the basement. Buyer to verify schools. All measurements approximate.
Key facts
- Open living room
- Fenced back yard
- Vinyl siding
Tags
Property features AI
Exterior
- Parking: Attached garage with two built-in, covered spaces; Garage door opener
- Utilities: Public water; Public sewer
- Home design: Single family residence; Residential property; Not new (built in 1962); One main living level with additional below-grade finished area
- Construction: Vinyl siding; Composition roof; Other foundation; Year built 1962
- Exterior features: Porch; Chain link full fencing; Up to 1/4 acre lot; Lot dimensions approximately 60 x 120.16
Interior
- Kitchen: Range; Refrigerator; Dishwasher; Microwave
- Bedrooms: Master bedroom on the main floor; Additional bedrooms on the main floor
- Flooring: Wood flooring; Vinyl flooring
- Bathrooms: One full bathroom; One half bathroom; Two bathrooms on the main level
- Heating & cooling: Natural gas forced air heating; Central air conditioning
- Interior features: Ceiling fan(s)
- Laundry & utility: Partially finished basement (additional finished area below grade)
Neighborhood map
What this means for you Summary
Snapshot
- This is a 3-bed/1.5-bath single-family listed at $180k.
Deal economics
- At list price, monthly cash flow is $134 ($2k/yr) — positive.
- The deal already cash-flows at list — no discount required.
- To meet the 1% rule (rent ≥ 1% of price), the offer needs to be $179k (0.7% below list).
- Recommended offer: $179k (0.7% below list) — sets the bar for 1% rule.
- Cap rate 7.2% vs local median 3.6% in Omaha — top-decile yield for the area; either an underpriced asset or a hidden risk that comps aren't pricing in. Stress-test before assuming the spread holds.
Location & tenants
- Location reads 84/100 on livability (#7 in NE, #663 nationally) — a professional / high-income tenant draw. Strengths: amenities A+, commute A+, cost of living A+; Watch: crime F.
- Omaha Public Schools (urban): math 20% / reading 28% proficiency, ranked #110 of 111 in NE (top 99%) — low school quality limits family demand, transient renter base, plan for 1-2y turnover; 62% free/reduced lunch — lower-income household profile, screen leases tightly.
- Zoned schools: Hartman Elementary School (math 12% / reading 18%, grade F, #480 of 502 statewide, top 96%, 449 students, 0% FRL); Nathan Hale Magnet Middle School (math 13% / reading 18%, grade F, #125 of 128 statewide, top 98%, 620 students, 0% FRL); Northwest High School (math 8% / reading 14%, grade F, #256 of 261 statewide, top 98%, 1,593 students, 0% FRL) — zoned schools average 0% FRL vs 62% district-wide (62 pts lower); this property's tenant base skews higher-income than the district average.
- Market conditions: Rents rising (+2.4%/yr); 172 active listings in the ZIP; 15 comparable units currently listed for rent nearby; rentals at typical pace (median 24d on market — plan ~3-4 weeks tenant-placement turnaround); 4,539 units permitted in Douglas County in 2024 (2,583 in 5+ unit buildings).
- This rent runs 35% of the median local income ($61k/yr) — at the standard rent-burdened threshold; future hikes will face affordability resistance.
Forward outlook
- Local home prices are declining (-3.0%/yr); year-one equity from $1k of loan paydown is wiped out by about $5k of value loss. Plan a longer hold.
- Douglas County population projected at +28% by 2050 — long-run rental-demand tailwind backs the buy-and-hold thesis.
Negotiation context
- Only 3 days on market — expect competitive offers; lowballing is unlikely to land.
Questions for the listing agent
- Built in 1962 — when were the roof, HVAC, electrical panel, plumbing, and water heater last replaced?
- Is there a deadline driving the sale (1031 exchange, divorce, estate, relocation)? That informs how much negotiation room exists.
- Crime grade is F in this area — have there been break-ins, vandalism, or insurance claims at this property in the last 3 years? What carrier currently insures it and at what premium?
- What's the average days-on-market for RENTAL listings here right now (not sales)? A rising rental-DOM trend means longer vacancies and softer asking-rent achievability than the comps imply.
- What's the recent tenant-quality profile in this submarket — average credit score on applications, eviction rate, late-payment / NSF rate, and stable-employment percentage? A property-management company in the area should have these aggregated.
- How much new for-sale + rental construction is in the pipeline within 1–3 miles? Heavy new supply typically softens prices + rents 12–24 months out; constrained supply supports both.
Investment metrics
- 1% rule
- 0.99% ✗
- Cap rate
- 7.19%
- Cash-on-cash
- 3.19%
- DSCR
- 1.14
- GRM
- 8.4
CMA / ARV
- ARV (median comp)
- $216,138
- List price
- $180,000
- Delta
- -16.72%
- Verdict
- UNDERPRICED
- Comps
- 20 within 1.0 mi
Show comp detail 12 sales within ~0.75 mi
| Address | Dist | Beds/Ba | Sqft | Sold | Price | $/sf | Match |
|---|---|---|---|---|---|---|---|
| 5317 N 64 St | 0.09mi | 3/1.5 | 1,460 (-0%) | 3mo | $148,500 | $102 | 92 |
| 6428 Odgen St | 0.03mi | 3/1.0 | 1,434 (-2%) | 5mo | $195,000 | $136 | 88 |
| 6703 Ogden St | 0.21mi | 3/2.0 | 1,516 (+3%) | 1mo | $220,000 | $145 | 82 |
| 6921 Ogden St | 0.39mi | 3/1.5 | 1,362 (-7%) | 3mo | $218,000 | $160 | 67 |
| 6748 Kansas Ave | 0.55mi | 3/2.0 | 1,532 (+4%) | 2mo | $139,000 | $91 | 63 |
| 4624 N 61 St | 0.45mi | 3/3.0 | 1,542 (+5%) | 3mo | $237,000 | $154 | 62 |
| 6905 Laurel Ave | 0.48mi | 4/2.0 (+1) | 1,375 (-6%) | 2mo | $235,000 | $171 | 58 |
| 6735 Kansas Ave | 0.51mi | 3/1.5 | 1,293 (-12%) | 2mo | $185,000 | $143 | 55 |
| 6610 Vernon Ave | 0.66mi | 3/1.5 | 1,328 (-10%) | 2mo | $250,000 | $188 | 51 |
| 4905 N 59th St | 0.51mi | 3/2.5 | 1,653 (+13%) | 4mo | $219,000 | $132 | 48 |
| 6504 Ames Ave | 0.50mi | 2/1.5 (-1) | 1,262 (-14%) | 2mo | $163,000 | $129 | 47 |
| 5626 Fowler Ave | 0.68mi | 4/2.0 (+1) | 1,626 (+11%) | 5mo | $255,000 | $157 | 39 |
Match score weights: distance 35% · size 25% · config 20% · recency 20%. Top-matched comps best support the ARV.
Projected returns pro-forma
-3.0% appreciation · 2.35% rent growth · sell at horizon
- IRR
- -12.0%
- Equity multiple
- 0.57×
- Total profit
- $-21,743
- Equity at exit
- $26,839
- IRR
- -3.8%
- Equity multiple
- 0.75×
- Total profit
- $-12,448
- Equity at exit
- $15,563
Cash invested: $50,400 (down + closing). Projections, not guarantees.
Landlord ↔ Tenant lean methodology
- Overall (STATE)
- 83 Strongly Landlord-Friendly
- State Nebraska
- 83 Strongly Landlord-Friendly · R+13
- County
- — inherits STATE
- City
- — inherits STATE
ZIP-level market 68104
- Rents YoY
- 2.4%
- Active inventory
- 172
- Price-to-rent
- 8.4×
Monthly cashflow live
- Estimated rent
- $1,788 high interval (Pro) →
- Mortgage (P&I)
- −$944
- Tax from tax record
- −$260 /mo · $3,115/yr
- Insurance
- −$75
- HOA
- −$0
- Vacancy / Maint / Mgmt
- −$375
- Net cashflow
- $134
Break-even live
UW: 25.0% down · 7.5% · 30yr · 1.5% tax · 5.0% vac · 8.0% maint · 8.0% mgmt
Financing live
Cash to close
- Down payment
- $45,000
- Closing costs
- $5,400
- Reserves months
- —
- Total cash needed
- —
Loan-product check · same deal, 3 products live
Conventional
25% down · 7.5% · 30yr
- Down + closing
- —
- Monthly P&I
- —
- Monthly cashflow
- —
- DSCR
- —
- Eligible?
- —
Personal DTI + credit; lowest rate.
DSCR
20% down · 8.5% · 30yr
- Down + closing
- —
- Monthly P&I
- —
- Monthly cashflow
- —
- DSCR
- —
- Eligible?
- —
No personal income docs; deal must DSCR.
Hard money
10% down · 12.0% · 12mo
- Down + closing
- —
- Monthly P&I
- —
- Monthly cashflow
- —
- DSCR
- —
- Eligible?
- —
Short-term bridge; refi at stabilization.
Rent comps 15 comps
| Address | Beds | Baths | Sqft | Rent | $/sqft | DOM | Units | Dist |
|---|---|---|---|---|---|---|---|---|
| 6405 Parkview Ln Omaha, NE | 3.0 | 1.5 | 1718 | $1,950 | $1.14 | 44d | 1 | 0.06mi |
| 6029 Nebraska Ave Omaha, NE | 4.0 | 2.0 | 1840 | $2,000 | $1.09 | 23d | 1 | 0.64mi |
| 5615 Northampton Blvd Omaha, NE | 3.0 | 1.0–1.5 | 781 | $1,500 | $1.92 | 2d | 1 | 0.79mi |
| 6605 N 65th St Omaha, NE | 3.0 | 1.5 | 1494 | $1,800 | $1.20 | 44d | 1 | 0.81mi |
| 7323 Ames Cir Unit 7225 Omaha, NE | 2.0 | 2.0 | 1632 | $1,250 | $0.77 | 3d | 1 | 0.89mi |
| 4114 N 54th St Omaha, NE | 3.0 | 2.0 | 1683 | $1,745 | $1.04 | 3d | 1 | 1.04mi |
| 6010 Evans St Omaha, NE | 3.0 | 2.0 | 1196 | $1,850 | $1.55 | 23d | 1 | 1.12mi |
| 6116 Pinkney St Omaha, NE | 3.0 | 1.5 | 1700 | $1,800 | $1.06 | 12d | 1 | 1.15mi |
| 3333 N 61st St Unit 3331 Omaha, NE | 2.0 | 1.0 | 1077 | $1,050 | $0.97 | 12d | 1 | 1.21mi |
| 4918 Ames Ave Unit 17 Omaha, NE | 2.0 | 1.5 | 1074 | $850 | $0.79 | 23d | 1 | 1.33mi |
| 4657 Camden Ave Omaha, NE | 3.0 | 1.0 | 1250 | $1,500 | $1.20 | 44d | 1 | 1.40mi |
| 5119 Pratt St Omaha, NE | 3.0 | 1.0 | 1008 | $1,900 | $1.88 | 44d | 1 | 1.40mi |
| 4852 Boyd St Omaha, NE | 2.0 | 2.0 | 912 | $1,500 | $1.64 | 44d | 1 | 1.41mi |
| 6152 Military Ave Omaha, NE | 2.0 | 1.0–2.0 | 785 | $1,599 | $2.04 | 2d | 6 | 1.43mi |
| 3204 N 56th St Omaha, NE | 3.0 | 2.0 | 1800 | $1,700 | $0.94 | 10d | 1 | 1.47mi |
Listing history 2 events
-
2026-05-02status Pending 408-char remark
-
2026-04-29$180,000 New 408-char remark
ⓘ Source: listings_history table (triggers on properties + properties_extension) + one-shot
backfill from property_details.listing_events for pre-trigger history.
Tax reassessment forecast NE · Resets to sale price
- Current annual tax
- $3,115 · $260/mo
- Projected year-2 tax
- $3,115 · $260/mo
- Expected delta
- $0/yr ($0/mo · 0.0%)
ⓘ Screening estimate from a state-policy table — verify with the county assessor before closing.
Climate risk First Street
- Flood 1/10 Low FEMA zone X (unshaded) · 0% chance over 30 yrs
- Wildfire 1/10 Low
- Heat 3/10 Moderate 7 d/yr ≥104°F today · 15 d/yr by 30 yrs out
- Wind 2/10 Low
- Air quality 2/10 Low 0 unhealthy d/yr today · 1 by 30 yrs out
Nearby sold comps map
Loading sold comps map…
Walkable amenities ~0.75 mi
Loading nearby amenities…
Taxation est. · year 1
- Rental income
- $21,457
- − Mortgage interest
- −$10,083
- − Property taxes
- −$3,115
- − Insurance
- −$900
- − Repairs & maintenance
- −$1,717
- − Management
- −$1,717
- − Depreciation
- −$5,236
- Taxable loss
- −$1,310
- Est. tax savings @ 24.0%
- +$314
- After-tax cash flow
- $1,923/yr
For passive investors: Depreciation is non-cash, so a rental often shows a tax loss while cash-flowing — sheltering income. Rental losses are passive: they offset passive income freely, and up to $25,000/yr can offset ordinary (W-2) income if you actively participate and your MAGI is under $100k (phasing out to $0 by $150k); unused losses carry forward. On sale, claimed depreciation is recaptured at up to 25%, and gains may owe capital-gains tax (a 1031 exchange can defer both). Figures are a year-1 estimate at your 24.0% rate — not tax advice; consult a CPA.
Schools (NCES district)
- District
- Omaha Public Schools
- NCES district ID
- 3174820
- Math proficiency
- 20% ▼ -10.00%
- Reading proficiency
- 28% ▼ -5.00%
- Median HH income
- $46,039
- Composite
- 20.83/100
- National rank
- #8502
- State rank
- #110 of 111 in NE
Livability — Omaha
- Score
- 84/100
- State rank
- #7
- US rank
- #663
Category grades
Schools grade is shown separately in the Schools card above.
Census & demographics
- Census place
- Omaha, NE
- County
- Douglas County · 538,646 people
- City population
- 552,986
- Metro
- Omaha-Council Bluffs, NE-IA
- Population (ZIP)
- 36,673
- Household income
- $60,549
- Rent vs Own
- Severe rent burden
- 1738.0
Population outlook (Douglas County) Hauer SSP2
- Today (2025)
- 625,245 people
- By 2030
- 661,613 · +5.8%
- By 2040
- 732,395 · +17.1%
- By 2050
- 801,988 · +28.3%
- By 2075
- 968,637 · +54.9%
- By 2100
- 1,101,871 · +76.2%
Race, ethnicity, and origin ACS 2023
- Neighborhood character
- Diverse neighborhood (Simpson 0.68)
- Race & ethnicity
- White 50% Black 23% Asian 12% Two or more races 11% Hispanic / Latino 7%
- Hispanic origin (detail)
- Mexican 6%
- Common ancestry
- Slovak 2% Lithuanian 2% Romanian 2%
- Foreign-born
- 13% · Philippines, Canada, India
- Languages at home
- 83% English-only · Other Asian/Pacific 8% Spanish 5% Other Indo-European 2%
Political lean MEDSL · Douglas
- 2024 margin
- D (+10.2) · D 54.4% · R 44.2% · Other 1.4%
- 2008→2024 swing
- +5.5pp toward D · 2008: 4.6pp · 2024: 10.2pp
- All cycles
- 2024: D+10.2 2020: D+11.3 2016: D+1.4 2012: R+4.3 2008: D+4.6
Not yet ingested
- Civics
- —
Market trends
- HPI YoY
- ▼ -196.54%
- Current HPI
- 298.8625
- Rent YoY
- ▲ 2.35%
- Metro
- Omaha-Council Bluffs, NE-IA
- State GDP YoY
- ▲ 0.68%
- F500 in state
- 2
Industry mix (Fortune 500 HQ in NE)
| Industry | F500 HQs | Revenue |
|---|---|---|
| Conglomerate | 1 | $371B |
|
||
Price history
-2.7% since first listed3 events — show timeline
- 2026-05-11 Sold (MLS) $175,150 GPRMLS
- 2026-05-02 Pending — GPRMLS
- 2026-04-29 Listed $180,000 GPRMLS
Property tax history
+6.1%/yrLatest (2025): $3,115 · +14.2% YoY. Source: county tax records.
Cash-flow waterfall
monthlySold comps — $/sqft
last 12 mo · ≤1 miLoading sold comps…