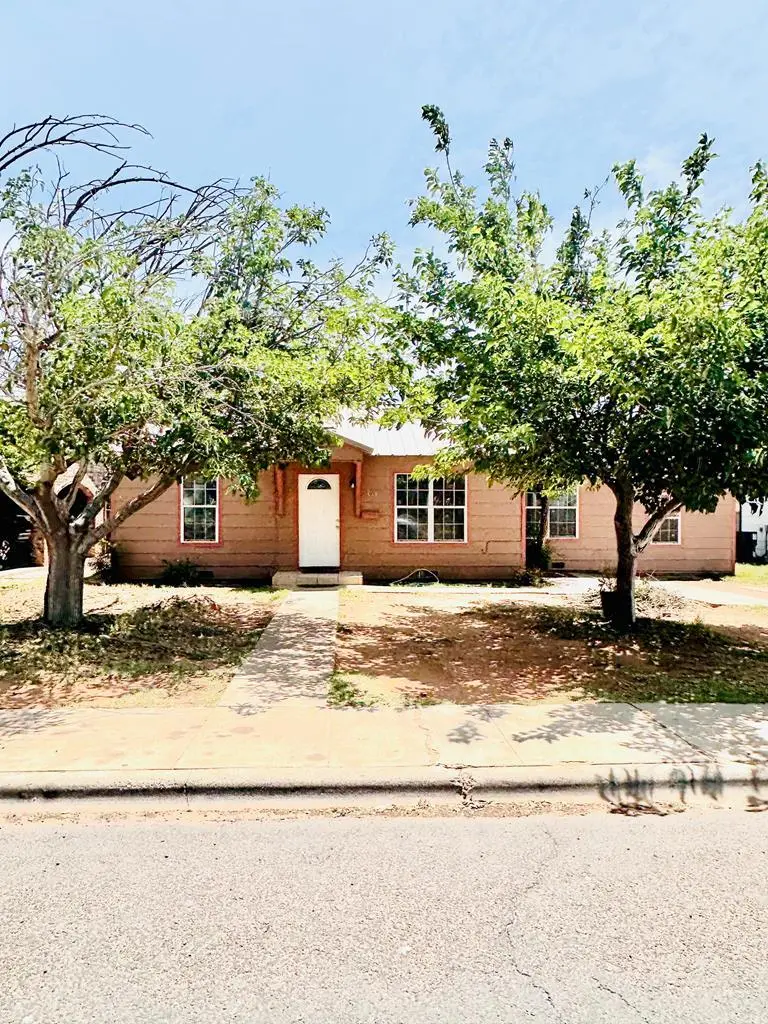
303 Santa Rita Dr · Odessa, TX
Flood risk 1/10 · Minimal
- FEMA flood zone
- X (unshaded)
- Chance of flooding over 30 yrs
- 0.0%
- Est. flood insurance / yr
- $507 – $1,088
Fire risk 4/10 · Minor
- Est. fire insurance / yr
- $1,222 – $2,270
Heat risk 6/10 · Moderate
- Hot days now (above 102°F)
- 7 days/yr
- Hot days in 30 yrs
- 22 days/yr
Wind risk 2/10 · Minimal
- Chance of severe wind over 30 yrs
- 2.0%
Air-quality risk 1/10 · Minimal
- Unhealthy air days now
- 0 days/yr
- Unhealthy air days in 30 yrs
- 0 days/yr
Risk factors via First Street. Map © Google.
Why this score? — see what drove the D+ grade
The composite is a weighted blend of 9 inputs, each scored 0–100. Each bar is that input's sub-score; the figure is the points it added to the 100-point composite (weight × sub-score).
- Cash flow +19.6/30.0
- ARV discount +7.5/15.0
- DSCR +6.2/10.0
- 1% rule +5.1/10.0
- Livability +3.8/5.0
- Rent growth +2.5/5.0
- Condition / age +2.5/5.0
- Schools +2.2/10.0
- Appreciation +0.0/10.0
$199,000
🖨 Deal sheet (PDF) 📄 Offer letter ✓ Due diligence
Listing remarks
This cute remodelled 3 bedroom, 1 bath is a MUST SEE. Definitely would be a great starter home or investment property. Roof, windows & HVAC are 5 years old. This cutie also has ORIGINAL 1949 hardwood floors which have been recently restored. Great shade in the front & tons of backyard space. If that isn't enough, seller is offering $6,500 in closing costs!! Pick up that phone & call your realtor to schedule your personal tour.
Key facts
- Recently restored
- Backyard space
- 7,187 sq ft lot
Tags
Property features AI
Exterior
- Parking: Parking pad
- Utilities: Public water; Public sewer; Propane service
- Home design: Residential single-family home; Single-story (entry level not specified)
- Construction: Vinyl siding; Metal roof; Pillar/post/pier foundation; Built with a home warranty
- Exterior features: Masonry fence; Paved road access; Solar energy generation
Interior
- Kitchen: Electric range; Refrigerator
- Flooring: Tile flooring; Hardwood flooring
- Bathrooms: 1 full bathroom
- Heating & cooling: Central heating (electric); Central air conditioning (electric)
- Interior features: Electric water heater; Home comes with a refrigerator; No fireplace
Neighborhood map
What this means for you Summary
Snapshot
- This is a 3-bed/1.0-bath single-family listed at $199k.
Deal economics
- At list price, monthly cash flow is $229 ($3k/yr) — positive.
- The deal already cash-flows at list — no discount required.
- Meets the 1% rule at list price ($2k rent vs $199k).
- Recommended offer: $193k (3.0% below list) — sets the bar for market timing.
Location & tenants
- Location reads 75/100 on livability (#132 in TX, #3,928 nationally) — a middle-class / working-renter tenant base. Strengths: cost of living A+, housing A+, health & safety A+; Watch: commute D+, amenities D.
- Ector County ISD (urban): math 22% / reading 27% proficiency, ranked #707 of 826 in TX (top 86%) — low school quality limits family demand, transient renter base, plan for 1-2y turnover.
- Zoned schools: San Jacinto El (math 43% / reading 34%, grade F, #1,680 of 4,322 statewide, top 40%, 396 students, 83% FRL); Bowie Middle (math 11% / reading 21%, grade F, #1,543 of 1,662 statewide, top 94%, 914 students, 74% FRL); Odessa H S (math 18% / reading 22%, grade F, #1,397 of 1,632 statewide, top 87%, 3,874 students, 68% FRL) — zoned schools average 75% FRL vs 56% district-wide (19 pts higher); higher-poverty schools than district average — tighter screening recommended.
- Market conditions: 122 active listings in the ZIP; 22 comparable units currently listed for rent nearby; rentals lingering (median 44d on market — plan ~5-8 weeks vacancy on turnover, expect pricing pressure); 59% of comp listings sitting > 30 days — soft ceiling on asking rent; 1,004 units permitted in Ector County in 2024 (0 in 5+ unit buildings).
- This rent runs 42% of the median local income ($57k/yr) — at the standard rent-burdened threshold; future hikes will face affordability resistance.
Forward outlook
- Local home prices are declining (-3.0%/yr); year-one equity from $1k of loan paydown is wiped out by about $6k of value loss. Plan a longer hold.
- Ector County population projected at +78% by 2050 — long-run rental-demand tailwind backs the buy-and-hold thesis.
Negotiation context
- It's been on market 56 days — a 3% lower offer ($193k) is reasonable based on typical stale-listing flexibility.
Risks & watch-outs
- Watch-outs: built in 1949 — expect roof / HVAC / electrical / plumbing capex.
- Climate carrying-cost: extreme-heat days projected 7→22/yr by 2055 (HVAC capex compounding) — expect insurance premiums to compound above CPI over the hold.
Questions for the listing agent
- It's been on market 56 days. Have you received any prior offers? Is the seller open to a 3% concession, seller financing, or rate buy-down credit?
- Built in 1949 — when were the roof, HVAC, electrical panel, plumbing, and water heater last replaced?
- Is there a deadline driving the sale (1031 exchange, divorce, estate, relocation)? That informs how much negotiation room exists.
- Schools are F-rated, which usually means shorter tenancies and higher turnover. Who's the typical renter profile here, and what's been the actual vacancy rate?
- The area grade is low — what's the realistic commute time and amenity access for the typical tenant pool here? Any planned neighborhood developments (good or bad) we should know about?
- What's the average days-on-market for RENTAL listings here right now (not sales)? A rising rental-DOM trend means longer vacancies and softer asking-rent achievability than the comps imply.
- What's the recent tenant-quality profile in this submarket — average credit score on applications, eviction rate, late-payment / NSF rate, and stable-employment percentage? A property-management company in the area should have these aggregated.
- How much new for-sale + rental construction is in the pipeline within 1–3 miles? Heavy new supply typically softens prices + rents 12–24 months out; constrained supply supports both.
Investment metrics
- 1% rule
- 1.01% ✓
- Cap rate
- 7.67%
- Cash-on-cash
- 4.93%
- DSCR
- 1.22
- GRM
- 8.3
CMA / ARV
- ARV (median comp)
- $96,686
- List price
- $199,000
- Delta
- 105.82%
- Verdict
- OVERPRICED
- Comps
- 3 within 1.0 mi
Projected returns pro-forma
-3.0% appreciation · 3.0% rent growth · sell at horizon
- IRR
- -8.6%
- Equity multiple
- 0.68×
- Total profit
- $-17,652
- Equity at exit
- $29,672
- IRR
- 0.9%
- Equity multiple
- 1.06×
- Total profit
- $3,476
- Equity at exit
- $17,206
Cash invested: $55,720 (down + closing). Projections, not guarantees.
Landlord ↔ Tenant lean methodology
- Overall (STATE)
- 87 Strongly Landlord-Friendly
- State Texas
- 87 Strongly Landlord-Friendly · R+5
- County
- — inherits STATE
- City
- — inherits STATE
ZIP-level market 79763
- Active inventory
- 122
- Price-to-rent
- 8.3×
Monthly cashflow live
- Estimated rent
- $2,009 high interval (Pro) →
- Mortgage (P&I)
- −$1,044
- Tax from tax record
- −$232 /mo · $2,778/yr
- Insurance
- −$83
- HOA
- −$0
- Vacancy / Maint / Mgmt
- −$422
- Net cashflow
- $229
Break-even live
Sensitivity live
| Price | -10% $341 | -5% $285 | +0% $229 | +5% $173 | +10% $116 |
|---|---|---|---|---|---|
| Rent | -10% $70 | -5% $149 | +0% $229 | +5% $308 | +10% $388 |
| Rate | -1.0pp $329 | -0.5pp $279 | base $229 | +0.5pp $177 | +1.0pp $125 |
UW: 25.0% down · 7.5% · 30yr · 1.5% tax · 5.0% vac · 8.0% maint · 8.0% mgmt
Financing live
Cash to close
- Down payment
- $49,750
- Closing costs
- $5,970
- Reserves months
- —
- Total cash needed
- —
Loan-product check · same deal, 3 products live
Conventional
25% down · 7.5% · 30yr
- Down + closing
- —
- Monthly P&I
- —
- Monthly cashflow
- —
- DSCR
- —
- Eligible?
- —
Personal DTI + credit; lowest rate.
DSCR
20% down · 8.5% · 30yr
- Down + closing
- —
- Monthly P&I
- —
- Monthly cashflow
- —
- DSCR
- —
- Eligible?
- —
No personal income docs; deal must DSCR.
Hard money
10% down · 12.0% · 12mo
- Down + closing
- —
- Monthly P&I
- —
- Monthly cashflow
- —
- DSCR
- —
- Eligible?
- —
Short-term bridge; refi at stabilization.
Rent comps 22 comps
| Address | Beds | Baths | Sqft | Rent | $/sqft | DOM | Units | Dist |
|---|---|---|---|---|---|---|---|---|
| 200 Santa Rita Dr Odessa, TX | 3.0 | 2.0 | 1438 | $2,400 | $1.67 | 44d | 1 | 0.17mi |
| 2439 W 15th St Odessa, TX | 3.0 | 2.0 | 1175 | $1,500 | $1.28 | 14d | 1 | 0.67mi |
| 715 N Kelly Ave Odessa, TX | 2.0 | 1.0 | 1170 | $2,000 | $1.71 | 21d | 1 | 0.68mi |
| 1318 Harless Ave Odessa, TX | 2.0 | 1.5 | 1200 | $1,600 | $1.33 | 21d | 1 | 0.70mi |
| 1322 Harless Ave Unit 1 Odessa, TX | 2.0 | 1.5 | 1200 | $1,700 | $1.42 | 44d | 1 | 0.70mi |
| 1604 N Sam Houston Ave Odessa, TX | 2.0 | 1.0 | 1142 | $2,000 | $1.75 | 44d | 1 | 0.75mi |
| 2 Star Cir Odessa, TX | 3.0 | 2.0 | 1377 | $2,200 | $1.60 | 14d | 1 | 0.80mi |
| 2404 W 9th St Odessa, TX | 4.0 | 2.0 | 744 | $1,600 | $2.15 | 21d | 1 | 0.81mi |
| 1322 N Lincoln Ave Odessa, TX | 3.0 | 1.0 | 1218 | $2,200 | $1.81 | 44d | 1 | 0.85mi |
| 1322 N Lincoln Ave Odessa, TX | 3.0 | 1.0 | 1218 | $2,100 | $1.72 | 21d | 1 | 0.85mi |
| 1501 N Texas Ave Unit A Odessa, TX | 2.0 | 1.0 | 925 | $1,450 | $1.57 | 14d | 1 | 1.01mi |
| 1315 N Jackson Ave Odessa, TX | 3.0 | 2.0 | 1216 | $1,500 | $1.23 | 14d | 1 | 1.11mi |
| 3107 Merrill Ave Odessa, TX | 4.0 | 2.0 | 1212 | $1,800 | $1.49 | 44d | 1 | 1.29mi |
| 1220 Adams Ave Unit 3 Odessa, TX | 3.0 | 1.0 | 895 | $1,450 | $1.62 | 44d | 1 | 1.44mi |
| 1220 Adams Ave Unit 4 Odessa, TX | 4.0 | 1.0 | 1063 | $1,750 | $1.65 | 44d | 1 | 1.44mi |
| 1219 Milburn Ave Unit K2YBUILDING K Odessa, TX | 3.0 | 1.0 | 895 | $1,500 | $1.68 | 44d | 1 | 1.47mi |
| 1215 Milburn Ave Unit J2VBUILDING J Odessa, TX | 3.0 | 1.0 | 895 | $1,450 | $1.62 | 44d | 1 | 1.47mi |
| 1215 Milburn Ave Unit J1TBUILDING J Odessa, TX | 3.0 | 1.0 | 895 | $1,500 | $1.68 | 44d | 1 | 1.47mi |
| 1012 Adams Ave Unit C2BBUILDING C Odessa, TX | 4.0 | 1.0 | 1066 | $1,750 | $1.64 | 44d | 1 | 1.48mi |
| 1012 Adams Ave Unit C1BBUILDING C Odessa, TX | 4.0 | 1.0 | 1066 | $1,800 | $1.69 | 44d | 1 | 1.48mi |
| 1115 Milburn Ave Odessa, TX | 4.0 | 1.0 | 895 | $1,800 | $2.01 | 21d | 1 | 1.48mi |
| 1115 Milburn Ave Odessa, TX | 4.0 | 1.0 | 895 | $1,800 | $2.01 | 44d | 1 | 1.48mi |
Listing history 17 events
-
2026-06-19days on market $199,000 Active 56 DOM
-
2026-06-18days on market $199,000 Active 55 DOM
-
2026-06-17days on market $199,000 Active 54 DOM
-
2026-06-16days on market $199,000 Active 53 DOM
-
2026-06-15days on market $199,000 Active 52 DOM
-
2026-06-14days on market $199,000 Active 50 DOM
-
2026-06-13days on market $199,000 Active 49 DOM
-
2026-06-10days on market $199,000 Active 47 DOM
-
2026-06-09days on market $199,000 Active 46 DOM
-
2026-06-08days on market $199,000 Active 45 DOM
-
2026-06-07pricedays on market $199,000 Active 44 DOM
-
2026-06-03days on market $203,000 Active 39 DOM
-
2026-06-01days on market $203,000 Active 38 DOM
-
2026-05-31days on market $203,000 Active 37 DOM
-
2026-05-30days on market $203,000 Active 36 DOM
-
2026-04-25$203,000 Active 448-char remark
-
1993-10-01soldstatus
ⓘ Source: listings_history table (triggers on properties + properties_extension) + one-shot
backfill from property_details.listing_events for pre-trigger history.
Tax reassessment forecast TX · Resets to sale price
- Current annual tax
- $2,778 · $232/mo
- Projected year-2 tax
- $3,642 · $303/mo
- Expected delta
- +$863/yr (+$72/mo · 31.1%)
ⓘ Screening estimate from a state-policy table — verify with the county assessor before closing.
Climate risk First Street
- Flood 1/10 Low FEMA zone X (unshaded) · 0% chance over 30 yrs
- Wildfire 4/10 Moderate
- Heat 6/10 Major 7 d/yr ≥102°F today · 22 d/yr by 30 yrs out
- Wind 2/10 Low 2% chance of damaging wind over 30 yrs
- Air quality 1/10 Low 0 unhealthy d/yr today · 0 by 30 yrs out
Nearby sold comps map
Loading sold comps map…
Walkable amenities ~0.75 mi
Loading nearby amenities…
Taxation est. · year 1
- Rental income
- $24,104
- − Mortgage interest
- −$11,147
- − Property taxes
- −$2,778
- − Insurance
- −$995
- − Repairs & maintenance
- −$1,928
- − Management
- −$1,928
- − Depreciation
- −$5,789
- Taxable loss
- −$462
- Est. tax savings @ 24.0%
- +$111
- After-tax cash flow
- $2,857/yr
For passive investors: Depreciation is non-cash, so a rental often shows a tax loss while cash-flowing — sheltering income. Rental losses are passive: they offset passive income freely, and up to $25,000/yr can offset ordinary (W-2) income if you actively participate and your MAGI is under $100k (phasing out to $0 by $150k); unused losses carry forward. On sale, claimed depreciation is recaptured at up to 25%, and gains may owe capital-gains tax (a 1031 exchange can defer both). Figures are a year-1 estimate at your 24.0% rate — not tax advice; consult a CPA.
Schools (NCES district)
- District
- Ector County ISD
- NCES district ID
- 4818000
- Math proficiency
- 22% ▼ -9.00%
- Reading proficiency
- 27% ▼ -4.00%
- Median HH income
- $52,740
- Composite
- 21.89/100
- National rank
- #8233
- State rank
- #707 of 826 in TX
Livability — Odessa
- Score
- 75/100
- State rank
- #132
- US rank
- #3928
Category grades
Schools grade is shown separately in the Schools card above.
Census & demographics
- Census place
- Odessa, TX
- County
- Ector County · 131,169 people
- City population
- 131,169
- Metro
- Odessa, TX
- Population (ZIP)
- 35,174
- Household income
- $56,877
- Rent vs Own
- Severe rent burden
- 842.0
Population outlook (Ector County) Hauer SSP2
- Today (2025)
- 212,765 people
- By 2030
- 241,962 · +13.7%
- By 2040
- 306,582 · +44.1%
- By 2050
- 379,755 · +78.5%
- By 2075
- 568,991 · +167.4%
- By 2100
- 709,829 · +233.6%
Race, ethnicity, and origin ACS 2023
- Neighborhood character
- Predominantly Hispanic (76%)
- Race & ethnicity
- Hispanic / Latino 76% Two or more races 24% White 19% Black 2%
- Hispanic origin (detail)
- Mexican 72%
- Common ancestry
- Lithuanian 1% Slovak 1%
- Foreign-born
- 22% · Canada
- Languages at home
- 39% English-only · Spanish 60%
Political lean MEDSL · Ector
- 2024 margin
- Solid R (+52.9) · D 23.2% · R 76.1%
- 2008→2024 swing
- -4.9pp toward R · 2008: -48.0pp · 2024: -52.9pp
- All cycles
- 2024: R+52.9 2020: R+47.8 2016: R+40.6 2012: R+48.9 2008: R+48.0
Not yet ingested
- Civics
- —
Market trends
- HPI YoY
- ▼ -213.81%
- Current HPI
- 254.9773
- Rent YoY
- —
- Metro
- Odessa, TX
- State GDP YoY
- ▲ 3.95%
- F500 in state
- 110
Industry mix (Fortune 500 HQ in TX)
| Industry | F500 HQs | Revenue |
|---|---|---|
| Energy | 16 | $1,198B |
|
||
| Technology | 5 | $198B |
|
||
| Engineering / Construction | 4 | $72B |
|
||
| Energy Services | 3 | $60B |
|
||
| Utilities | 3 | $41B |
|
||
| Healthcare | 2 | $330B |
|
||
Price history
-2.0% since first listed3 events — show timeline
- 2026-06-03 Price Changed $199,000 ODMLS
- 2026-04-25 Listed $203,000 ODMLS
- 1993-10-01 Sold (Public Records) — Public Records
Property tax history
+8.9%/yrLatest (2025): $2,778 · -0.1% YoY. Source: county tax records.
Cash-flow waterfall
monthlySold comps — $/sqft
last 12 mo · ≤1 miLoading sold comps…