 Triplex
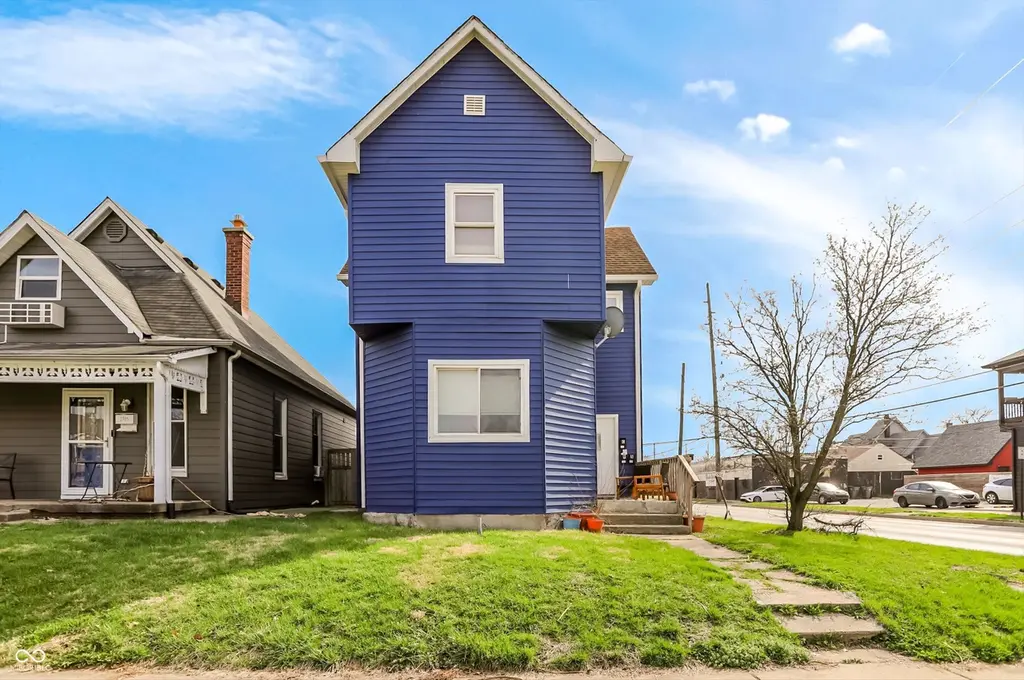
1701 Fletcher Ave · Indianapolis city (balance), IN
Flood risk 1/10 · Minimal
- FEMA flood zone
- X (unshaded)
- Chance of flooding over 30 yrs
- 0.0%
- Est. flood insurance / yr
- $473 – $860
Fire risk 1/10 · Minimal
- Est. fire insurance / yr
- $717 – $1,331
Heat risk 4/10 · Minor
- Hot days now (above 101°F)
- 7 days/yr
- Hot days in 30 yrs
- 19 days/yr
Wind risk 2/10 · Minimal
- Chance of severe wind over 30 yrs
- 1.0%
Air-quality risk 4/10 · Minor
- Unhealthy air days now
- 5 days/yr
- Unhealthy air days in 30 yrs
- 7 days/yr
Risk factors via First Street. Map © Google.
Why this score? — see what drove the B grade
The composite is a weighted blend of 9 inputs, each scored 0–100. Each bar is that input's sub-score; the figure is the points it added to the 100-point composite (weight × sub-score).
- Cash flow +30.0/30.0
- ARV discount +15.0/15.0
- 1% rule +10.0/10.0
- DSCR +10.0/10.0
- Rent growth +3.2/5.0
- Livability +2.5/5.0
- Condition / age +2.5/5.0
- Schools +1.4/10.0
- Appreciation +0.0/10.0
$309,900
🖨 Deal sheet 📄 Offer letter ✓ Due diligence
Multi-family units
County records classify this as Multi-Family (2-4 Unit). Listing-text estimate: 3 units. confirmed
Listing remarks MLS
Nestled in the thriving heart of Fountain Square, this fully renovated triplex at 1701 Fletcher Avenue is a rare investment opportunity you don't want to miss. Located just moments from the vibrant Fountain Square district, this property offers the perfect blend of justified urban rents and long-term growth potential. Each of the three units has been recently updated (2018-2019), making this a true turnkey investment. Whether you're looking to expand your portfolio or start fresh in real estate investing, the cash flow potential is here. With Fountain Square continuing to grow as one of the city's most desirable neighborhoods which should afford continued rent and value appreciation with an already 7% cap rate, which is excellent for a prime area. Don't let this opportunity slip away-multi family in prime locations like this are few and far between!
Key facts
- 3,833 sq ft lot
- 3 parking spots
- Built 1900
Neighborhood map
What this means for you Summary
Snapshot
- This is a 3 × 5-bed/6.0-bath units multifamily listed at $310k.
Deal economics
- At list price, monthly cash flow is $2k ($23k/yr) — positive. Per door: $637/mo.
- The deal already cash-flows at list — no discount required.
- Meets the 1% rule at list price ($5k rent vs $310k).
- Recommended offer: $301k (3.0% below list) — sets the bar for market timing.
- Cap rate 13.7% vs local median 4.4% in Indianapolis city (balance) — top-decile yield for the area; either an underpriced asset or a hidden risk that comps aren't pricing in. Stress-test before assuming the spread holds.
Location & tenants
- Location reads: area grade B — affects rentability + tenant quality, not the cash-flow math above.
- Indianapolis Public Schools (urban): math 14% / reading 20% proficiency, ranked #286 of 301 in IN (top 95%) — low school quality limits family demand, transient renter base, plan for 1-2y turnover; 77% free/reduced lunch — lower-income household profile, screen leases tightly.
- Market conditions: Rents rising (+2.9%/yr); 493 active listings in the ZIP; 40 comparable units currently listed for rent nearby; rentals at typical pace (median 24d on market — plan ~3-4 weeks tenant-placement turnaround); 1,906 units permitted in Marion County in 2024 (621 in 5+ unit buildings).
- At $5,349/mo this rent would consume 112% of the median local household income ($57k/yr) (locally 1499% of renters already pay >50% of income on rent) — very limited rent-growth headroom before tenants either downsize or default.
Forward outlook
- Local home prices are declining (-3.0%/yr); year-one equity from $2k of loan paydown is wiped out by about $9k of value loss. Plan a longer hold.
- Marion County population projected at +18% by 2050 — long-run rental-demand tailwind backs the buy-and-hold thesis.
- At projected returns (-3.0% appreciation + 2.9% rent growth), your $87k cash investment doubles in ~5 years — after that, you're playing with house money.
Negotiation context
- It's been on market 48 days — a 3% lower offer ($301k) is reasonable based on typical stale-listing flexibility.
- 8 sale attempts since 24y ago; this cycle's ask has dropped $25k (7%) from the opening price — seller is motivated, your offer sets the floor, not the list.
Risks & watch-outs
- Watch-outs: built in 1900 — expect roof / HVAC / electrical / plumbing capex.
Questions for the listing agent
- It's been on market 48 days. Have you received any prior offers? Is the seller open to a 3% concession, seller financing, or rate buy-down credit?
- Can we see the unit-by-unit rent roll, current vacancy, and any below-market leases? What's the average tenancy length?
- What capital expenditures (roof, boiler, parking lot, exteriors) have been made in the last 5 years, and what's planned in the next 2?
- Built in 1900 — when were the roof, HVAC, electrical panel, plumbing, and water heater last replaced?
- Is there a deadline driving the sale (1031 exchange, divorce, estate, relocation)? That informs how much negotiation room exists.
- What's the average days-on-market for RENTAL listings here right now (not sales)? A rising rental-DOM trend means longer vacancies and softer asking-rent achievability than the comps imply.
- What's the recent tenant-quality profile in this submarket — average credit score on applications, eviction rate, late-payment / NSF rate, and stable-employment percentage? A property-management company in the area should have these aggregated.
- How much new apartment / multifamily construction is in the pipeline within 1–3 miles? Heavy new supply (>2% of stock underway) typically softens rents 12–24 months out; light construction supports rent growth.
Investment metrics
- 1% rule
- 1.73% ✓
- Cap rate
- 13.69%
- Cash-on-cash
- 26.42%
- DSCR
- 2.18
- GRM
- 4.8
CMA / ARV
- ARV (median comp)
- $450,000
- List price
- $309,900
- Delta
- -31.13%
- Verdict
- UNDERPRICED
- Comps
- 9 within 1.0 mi
Show comp detail 6 sales within ~0.75 mi
| Address | Dist | Beds/Ba | Sqft | Sold | Price | $/sf | Match |
|---|---|---|---|---|---|---|---|
| 1651 Spann Ave | 0.07mi | 2/3.0 (-1) | 1,880 (-7%) | 8mo | $660,000 | $351 | 74 |
| 415 Harlan St | 0.30mi | 4/2.0 (+1) | 1,952 (-3%) | 4mo | $167,500 | $86 | 69 |
| 1701 Woodlawn Ave | 0.25mi | 4/2.0 (+1) | 1,880 (-7%) | 4mo | $275,000 | $146 | 65 |
| 1905-1907 E Pleasant Run Parkway South Dr | 0.69mi | 4/3.0 (+1) | 2,240 (+11%) | 1mo | $380,000 | $170 | 44 |
| 1226 Saint Paul St | 0.61mi | 4/3.0 (+1) | 2,310 (+15%) | 3mo | $281,300 | $122 | 39 |
| 2521 Southeastern Ave | 0.63mi | 4/2.0 (+1) | 2,240 (+11%) | 10mo | $121,000 | $54 | 34 |
Match score weights: distance 35% · size 25% · config 20% · recency 20%. Top-matched comps best support the ARV.
Projected returns pro-forma
-3.0% appreciation · 2.88% rent growth · sell at horizon
- IRR
- 20.1%
- Equity multiple
- 1.82×
- Total profit
- $71,000
- Equity at exit
- $46,207
- IRR
- 28.3%
- Equity multiple
- 3.50×
- Total profit
- $216,621
- Equity at exit
- $26,794
Cash invested: $86,772 (down + closing). Projections, not guarantees.
Landlord ↔ Tenant lean methodology
- Overall (STATE)
- 90 Strongly Landlord-Friendly
- State Indiana
- 90 Strongly Landlord-Friendly · R+11
- County
- — inherits STATE
- City
- — inherits STATE
ZIP-level market 46203
- Home prices YoY
- -26.7%
- Rents YoY
- 2.9%
- Active inventory
- 493
- Price-to-rent
- 14.5×
Monthly cashflow live
- Estimated rent
- $5,349 medium interval (Pro) →
- Mortgage (P&I)
- −$1,625
- Tax from tax record
- −$561 /mo · $6,732/yr
- Insurance
- −$129
- HOA
- −$0
- Vacancy / Maint / Mgmt
- −$1,123
- Net cashflow
- $1,910
Break-even live
3-unit breakdown (identical units grouped — click to expand)
| Units | Beds | Baths | Est. rent |
|---|---|---|---|
| 3× units | 5 | 6 | $5,349 |
| #1 | 5 | 6 | $1,783 |
| #2 | 5 | 6 | $1,783 |
| #3 | 5 | 6 | $1,783 |
| Total (3 units) | $5,349 | ||
UW: 25.0% down · 7.5% · 30yr · 1.5% tax · 5.0% vac · 8.0% maint · 8.0% mgmt
Financing live
Cash to close
- Down payment
- $77,475
- Closing costs
- $9,297
- Reserves months
- —
- Total cash needed
- —
Loan-product check · same deal, 3 products live
Conventional
25% down · 7.5% · 30yr
- Down + closing
- —
- Monthly P&I
- —
- Monthly cashflow
- —
- DSCR
- —
- Eligible?
- —
Personal DTI + credit; lowest rate.
DSCR
20% down · 8.5% · 30yr
- Down + closing
- —
- Monthly P&I
- —
- Monthly cashflow
- —
- DSCR
- —
- Eligible?
- —
No personal income docs; deal must DSCR.
Hard money
10% down · 12.0% · 12mo
- Down + closing
- —
- Monthly P&I
- —
- Monthly cashflow
- —
- DSCR
- —
- Eligible?
- —
Short-term bridge; refi at stabilization.
Rent comps 40 comps
| Address | Beds | Baths | Sqft | Rent | $/sqft | DOM | Units | Dist |
|---|---|---|---|---|---|---|---|---|
| 1643 Fletcher Ave Indianapolis, IN | 3.0 | 2.0 | 2019 | $2,249 | $1.11 | 23d | 1 | 0.02mi |
| 1613 Fletcher Ave Indianapolis, IN | 2.0 | 1.0 | 2208 | $2,149 | $0.97 | 23d | 1 | 0.05mi |
| 1548 Lexington Ave Indianapolis, IN | 4.0 | 3.0 | 2224 | $2,250 | $1.01 | 3d | 1 | 0.14mi |
| 1512 English Ave Indianapolis, IN | 3.0 | 2.0 | 1416 | $1,650 | $1.17 | 4d | 1 | 0.18mi |
| 1502 Woodlawn Ave Indianapolis, IN | 2.0 | 2.0 | 1441 | $2,500 | $1.73 | 14d | 1 | 0.32mi |
| 1020 S Randolph St Indianapolis, IN | 3.0 | 1.5 | 1550 | $1,650 | $1.06 | 23d | 1 | 0.33mi |
| 2201 Pleasant St Indianapolis, IN | 4.0 | 3.0 | 2063 | $2,495 | $1.21 | 4d | 1 | 0.39mi |
| 1140 Hoyt Ave Indianapolis, IN | 4.0 | 1.5 | 1831 | $1,895 | $1.03 | 43d | 1 | 0.41mi |
| 1135 Spann Ave Indianapolis, IN | 4.0 | 2.5 | 1836 | $2,495 | $1.36 | 17d | 1 | 0.41mi |
| 1441 Prospect St Indianapolis, IN | 2.0 | 1.0–2.0 | 2840 | $2,000 | $0.70 | 1d | 13 | 0.44mi |
| 145 McKim Ave Indianapolis, IN | 3.0 | 2.5 | 1470 | $2,195 | $1.49 | 44d | 1 | 0.45mi |
| 117 S Arsenal Ave Indianapolis, IN | 3.0 | 2.0 | 2592 | $1,800 | $0.69 | 43d | 1 | 0.52mi |
| 1153 Villa Ave Indianapolis, IN | 4.0 | 2.0 | 2880 | $2,100 | $0.73 | 23d | 1 | 0.55mi |
| 1123 Churchman Ave Indianapolis, IN | 3.0 | 1.5 | 1472 | $1,360 | $0.92 | 14d | 1 | 0.57mi |
| 1012 Hosbrook St Indianapolis, IN | 2.0 | 2.5 | 1728 | $2,400 | $1.39 | 23d | 1 | 0.58mi |
| 1230 Harlan St Indianapolis, IN | 3.0 | 3.5 | 2167 | $2,600 | $1.20 | 1d | 1 | 0.62mi |
| 1330 Laurel St Indianapolis, IN | 3.0 | 2.0 | 1911 | $2,250 | $1.18 | 20d | 1 | 0.66mi |
| 12 N Randolph St Indianapolis, IN | 3.0 | 1.0 | 1485 | $1,650 | $1.11 | 43d | 1 | 0.70mi |
| 29 N Walcott St Indianapolis, IN | 4.0 | 3.0 | 2200 | $2,400 | $1.09 | 43d | 1 | 0.71mi |
| 17 N Randolph St Indianapolis, IN | 3.0 | 2.0 | 1822 | $2,075 | $1.14 | 4d | 1 | 0.71mi |
| 22 Parkview Ave Indianapolis, IN | 3.0 | 1.5 | 1728 | $1,450 | $0.84 | 7d | 1 | 0.73mi |
| 17 E Parkview Ave Unit 19 Indianapolis, IN | 3.0 | 1.0 | 1530 | $1,650 | $1.08 | 43d | 1 | 0.73mi |
| 17 E Parkview Ave Unit 17 Indianapolis, IN | 3.0 | 1.5 | 1530 | $1,650 | $1.08 | 43d | 1 | 0.73mi |
| 22 Hendricks Pl Unit 22 Indianapolis, IN | 3.0 | 1.5 | 1730 | $1,600 | $0.92 | 17d | 1 | 0.74mi |
| 1541 E Ohio St Indianapolis, IN | 3.0 | 1.0 | 1400 | $1,399 | $1.00 | 43d | 1 | 0.76mi |
| 932 E Morris St Indianapolis, IN | 2.0 | 2.0 | 1483 | $1,900 | $1.28 | 3d | 1 | 0.76mi |
| 1035 Sanders St Unit 163 Indianapolis, IN | 2.0 | 1.0 | 1481 | $1,921 | $1.30 | 43d | 1 | 0.76mi |
| 1301 Ringgold Ave Unit 1303750P Indianapolis, IN | 3.0 | 3.0 | 2884 | $6,514 | $2.26 | 43d | 1 | 0.80mi |
| 1337 Barth Ave Unit NA Indianapolis, IN | 3.0 | 1.0 | 2468 | $1,700 | $0.69 | 4d | 1 | 0.81mi |
| 1337 Barth Ave Indianapolis, IN | 3.0 | 1.0 | 2468 | $1,700 | $0.69 | 7d | 1 | 0.81mi |
| 1337 Barth Ave Indianapolis, IN | 3.0 | 1.0 | 2468 | $1,700 | $0.69 | 16d | 1 | 0.81mi |
| 1337 Barth Ave Indianapolis, IN | 3.0 | 1.0 | 2468 | $1,700 | $0.69 | 10d | 1 | 0.81mi |
| 1430 E Ohio St Indianapolis, IN | 3.0 | 1.5 | 2174 | $1,745 | $0.80 | 43d | 1 | 0.83mi |
| 1205 Cottage Ave Unit 1372938P Indianapolis, IN | 4.0 | 3.5 | 2680 | $6,638 | $2.48 | 43d | 1 | 0.83mi |
| 1619 S Randolph St Indianapolis, IN | 3.0 | 1.0 | 2016 | $1,195 | $0.59 | 23d | 1 | 0.87mi |
| 303 N State Ave Indianapolis, IN | 3.0 | 1.0 | 1700 | $1,275 | $0.75 | 23d | 1 | 0.87mi |
| 322 N Summit St Unit 4 Indianapolis, IN | 3.0 | 3.5 | 2546 | $3,100 | $1.22 | 7d | 1 | 0.90mi |
| 41 Keystone Ave Indianapolis, IN | 3.0 | 2.5 | 1600 | $2,500 | $1.56 | 43d | 1 | 0.93mi |
| 43 Keystone Ave Indianapolis, IN | 3.0 | 2.5 | 1600 | $2,291 | $1.43 | 16d | 1 | 0.93mi |
| 736 E Morris St Indianapolis, IN | 2.0 | 1.5 | 1500 | $1,195 | $0.80 | 4d | 1 | 0.93mi |
Listing history 23 events
-
2026-06-02statusdays on market $309,900 Pending 48 DOM
-
2026-06-01days on market $309,900 Active 47 DOM
-
2026-05-31days on market $309,900 Active 46 DOM
-
2026-05-06status Active 861-char remark
Show marketing remark (861 chars)
Nestled in the thriving heart of Fountain Square, this fully renovated triplex at 1701 Fletcher Avenue is a rare investment opportunity you don't want to miss. Located just moments from the vibrant Fountain Square district, this property offers the perfect blend of justified urban rents and long-term growth potential. Each of the three units has been recently updated (2018-2019), making this a true turnkey investment. Whether you're looking to expand your portfolio or start fresh in real estate investing, the cash flow potential is here. With Fountain Square continuing to grow as one of the city's most desirable neighborhoods which should afford continued rent and value appreciation with an already 7% cap rate, which is excellent for a prime area. Don't let this opportunity slip away-multi family in prime locations like this are few and far between!
-
2026-04-15status Pending 861-char remark
Show marketing remark (861 chars)
Nestled in the thriving heart of Fountain Square, this fully renovated triplex at 1701 Fletcher Avenue is a rare investment opportunity you don't want to miss. Located just moments from the vibrant Fountain Square district, this property offers the perfect blend of justified urban rents and long-term growth potential. Each of the three units has been recently updated (2018-2019), making this a true turnkey investment. Whether you're looking to expand your portfolio or start fresh in real estate investing, the cash flow potential is here. With Fountain Square continuing to grow as one of the city's most desirable neighborhoods which should afford continued rent and value appreciation with an already 7% cap rate, which is excellent for a prime area. Don't let this opportunity slip away-multi family in prime locations like this are few and far between!
-
2026-03-26$334,900 Active 861-char remark
Show marketing remark (861 chars)
Nestled in the thriving heart of Fountain Square, this fully renovated triplex at 1701 Fletcher Avenue is a rare investment opportunity you don't want to miss. Located just moments from the vibrant Fountain Square district, this property offers the perfect blend of justified urban rents and long-term growth potential. Each of the three units has been recently updated (2018-2019), making this a true turnkey investment. Whether you're looking to expand your portfolio or start fresh in real estate investing, the cash flow potential is here. With Fountain Square continuing to grow as one of the city's most desirable neighborhoods which should afford continued rent and value appreciation with an already 7% cap rate, which is excellent for a prime area. Don't let this opportunity slip away-multi family in prime locations like this are few and far between!
-
2023-08-23soldstatus $271,420 Closed 528-char remark
Show marketing remark (528 chars)
Triplex located a short distance from everything Fountain Square has to offer! This home boasts three separate units, including a common area with laundry. Each unit has been renovated, Unit A in Dec 2018, Unit B in July 2019 and Unit C in Dec 2019. All three units are currently leased, with great paying tenants. Fantastic Investment Opportunity! No showings without accepted offer. Video walkthrough available upon request. Lease information available upon request. All tenants have recently renewed. Do not disturb tenants.
-
2023-07-17status Pending 528-char remark
Show marketing remark (528 chars)
Triplex located a short distance from everything Fountain Square has to offer! This home boasts three separate units, including a common area with laundry. Each unit has been renovated, Unit A in Dec 2018, Unit B in July 2019 and Unit C in Dec 2019. All three units are currently leased, with great paying tenants. Fantastic Investment Opportunity! No showings without accepted offer. Video walkthrough available upon request. Lease information available upon request. All tenants have recently renewed. Do not disturb tenants.
-
2023-07-06$295,000 Active 528-char remark
Show marketing remark (528 chars)
Triplex located a short distance from everything Fountain Square has to offer! This home boasts three separate units, including a common area with laundry. Each unit has been renovated, Unit A in Dec 2018, Unit B in July 2019 and Unit C in Dec 2019. All three units are currently leased, with great paying tenants. Fantastic Investment Opportunity! No showings without accepted offer. Video walkthrough available upon request. Lease information available upon request. All tenants have recently renewed. Do not disturb tenants.
-
2020-09-14historical
-
2020-09-10soldstatus $175,000 Sold
-
2020-08-21status Pending
-
2020-07-30status Pending
-
2020-07-30$200,000 Active
-
2014-10-01historical
-
2014-09-30soldstatus $24,500
-
2014-05-12$34,900
-
2006-06-23historical
-
2005-12-23$115,000
-
2003-08-29soldstatus $11,000
-
2003-06-11$9,900
-
2003-06-03historical
-
2002-11-24$15,500
ⓘ Source: listings_history table (triggers on properties + properties_extension) + one-shot
backfill from property_details.listing_events for pre-trigger history.
Tax reassessment forecast IN · Partial reset (capped growth)
- Current annual tax
- $6,732 · $561/mo
- Projected year-2 tax
- $6,732 · $561/mo
- Expected delta
- $0/yr ($0/mo · 0.0%)
ⓘ Screening estimate from a state-policy table — verify with the county assessor before closing.
Climate risk First Street
- Flood 1/10 Low FEMA zone X (unshaded) · 0% chance over 30 yrs
- Wildfire 1/10 Low
- Heat 4/10 Moderate 7 d/yr ≥101°F today · 19 d/yr by 30 yrs out
- Wind 2/10 Low 100% chance of damaging wind over 30 yrs
- Air quality 4/10 Moderate 5 unhealthy d/yr today · 7 by 30 yrs out
Nearby sold comps map
Loading sold comps map…
Walkable amenities ~0.75 mi
Loading nearby amenities…
Taxation est. · year 1
- Rental income
- $64,188
- − Mortgage interest
- −$17,359
- − Property taxes
- −$6,732
- − Insurance
- −$1,550
- − Repairs & maintenance
- −$5,135
- − Management
- −$5,135
- − Depreciation
- −$9,015
- Taxable income
- $19,261
- Est. tax owed @ 24.0%
- −$4,623
- After-tax cash flow
- $18,302/yr
For passive investors: Depreciation is non-cash, so a rental often shows a tax loss while cash-flowing — sheltering income. Rental losses are passive: they offset passive income freely, and up to $25,000/yr can offset ordinary (W-2) income if you actively participate and your MAGI is under $100k (phasing out to $0 by $150k); unused losses carry forward. On sale, claimed depreciation is recaptured at up to 25%, and gains may owe capital-gains tax (a 1031 exchange can defer both). Figures are a year-1 estimate at your 24.0% rate — not tax advice; consult a CPA.
Schools (NCES district)
- District
- Indianapolis Public Schools
- NCES district ID
- 1804770
- Math proficiency
- 14% ▼ -7.00%
- Reading proficiency
- 20% ▼ -3.00%
- Median HH income
- $32,034
- Composite
- 13.69/100
- National rank
- #9499
- State rank
- #286 of 301 in IN
Livability — Indianapolis city (balance)
No livability data for this city. (Only ~50 U.S. cities are tracked.)
Census & demographics
- Census place
- Indianapolis city (balance), IN
- County
- Marion County · 998,460 people
- City population
- 881,119
- Metro
- Indianapolis-Carmel-Anderson, IN
- Population (ZIP)
- 37,758
- Household income
- $57,393
- Rent vs Own
- Severe rent burden
- 1499.0
Population outlook (Marion County) Hauer SSP2
- Today (2025)
- 1,025,572 people
- By 2030
- 1,065,727 · +3.9%
- By 2040
- 1,141,577 · +11.3%
- By 2050
- 1,208,920 · +17.9%
- By 2075
- 1,367,288 · +33.3%
- By 2100
- 1,438,201 · +40.2%
Race, ethnicity, and origin ACS 2023
- Neighborhood character
- Predominantly White (69%)
- Race & ethnicity
- White 69% Hispanic / Latino 14% Black 12% Two or more races 8% Asian 2% Native American 1%
- Hispanic origin (detail)
- Mexican 12% Puerto Rican 1%
- Common ancestry
- Slovak 2% Lithuanian 2% Italian 1%
- Foreign-born
- 8% · Canada
- Languages at home
- 88% English-only · Spanish 10% Other Indo-European 1%
Political lean MEDSL · Marion
- 2024 margin
- Strong D (+27.7) · D 63.0% · R 35.3% · Other 1.7%
- 2008→2024 swing
- -0.7pp no change · 2008: 28.4pp · 2024: 27.7pp
- All cycles
- 2024: D+27.7 2020: D+29.1 2016: D+22.8 2012: D+22.2 2008: D+28.4
Not yet ingested
- Civics
- —
Market trends
- HPI YoY
- ▼ -127.37%
- Current HPI
- 349.579
- Rent YoY
- ▲ 2.88%
- Metro
- Indianapolis-Carmel-Anderson, IN
- State GDP YoY
- ▲ 2.90%
- F500 in state
- 18
Industry mix (Fortune 500 HQ in IN)
| Industry | F500 HQs | Revenue |
|---|---|---|
| Industrial Machinery | 2 | $37B |
|
||
| Healthcare | 1 | $177B |
|
||
| Pharmaceuticals | 1 | $45B |
|
||
| Metals / Steel | 1 | $18B |
|
||
| Agriculture | 1 | $17B |
|
||
| Packaging | 1 | $12B |
|
||
Price history
+2060.6% since first listed20 events — show timeline
- 2026-05-06 Relisted — MIBOR as Distributed by MLS Grid
- 2026-04-15 Pending — MIBOR as Distributed by MLS Grid
- 2026-03-26 Listed $334,900 MIBOR as Distributed by MLS Grid
- 2023-08-23 Sold (MLS) $271,420 MIBOR as Distributed by MLS Grid
- 2023-07-17 Pending — MIBOR as Distributed by MLS Grid
- 2023-07-06 Listed $295,000 MIBOR as Distributed by MLS Grid
- 2020-09-14 Listing Removed — MIBOR as Distributed by MLS Grid
- 2020-09-10 Sold (MLS) $175,000 MIBOR as Distributed by MLS Grid
- 2020-08-21 Pending — MIBOR as Distributed by MLS Grid
- 2020-07-30 Pending — MIBOR as Distributed by MLS Grid
- 2020-07-30 Listed $200,000 MIBOR as Distributed by MLS Grid
- 2014-10-01 Listing Removed — MIBOR as Distributed by MLS Grid
- 2014-09-30 Sold (MLS) $24,500 MIBOR as Distributed by MLS Grid
- 2014-05-12 Listed $34,900 MIBOR as Distributed by MLS Grid
- 2006-06-23 Listing Removed — MIBOR as Distributed by MLS Grid
- 2005-12-23 Listed $115,000 MIBOR as Distributed by MLS Grid
- 2003-08-29 Sold (MLS) $11,000 MIBOR as Distributed by MLS Grid
- 2003-06-11 Listed $9,900 MIBOR as Distributed by MLS Grid
- 2003-06-03 Listing Removed — MIBOR as Distributed by MLS Grid
- 2002-11-24 Listed $15,500 MIBOR as Distributed by MLS Grid
Property tax history
+15.7%/yrLatest (2025): $6,732 · +7.4% YoY. Source: county tax records.
Cash-flow waterfall
monthlySold comps — $/sqft
last 12 mo · ≤1 miLoading sold comps…