 🌊 Lakefront
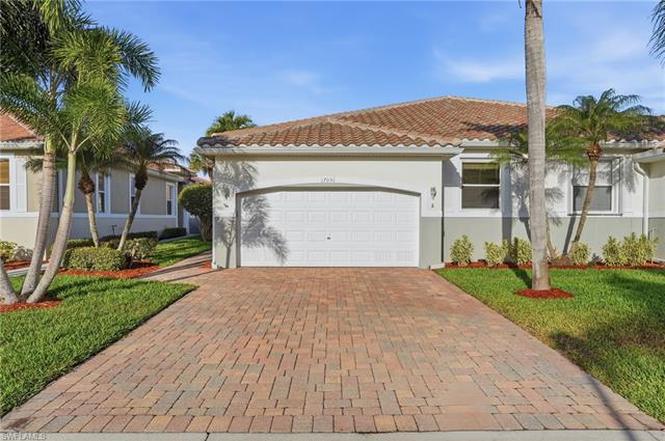
17051 Colony Lakes Blvd · Cypress Lake, FL
Flood risk 9/10 · Severe
- FEMA flood zone
- AE
- Chance of flooding over 30 yrs
- 0.99%
- Est. flood insurance / yr
- $1,737 – $8,500
Fire risk 1/10 · Minimal
- Est. fire insurance / yr
- $947 – $1,759
Heat risk 10/10 · Severe
- Hot days now (above 107°F)
- 7 days/yr
- Hot days in 30 yrs
- 32 days/yr
Wind risk 10/10 · Severe
- Chance of severe wind over 30 yrs
- 99.0%
Air-quality risk 2/10 · Minimal
- Unhealthy air days now
- 1 days/yr
- Unhealthy air days in 30 yrs
- 1 days/yr
Risk factors via First Street. Map © Google.
Why this score? — see what drove the D+ grade
The composite is a weighted blend of 9 inputs, each scored 0–100. Each bar is that input's sub-score; the figure is the points it added to the 100-point composite (weight × sub-score).
- Cash flow +18.3/30.0
- ARV discount +7.5/15.0
- DSCR +5.7/10.0
- 1% rule +5.1/10.0
- Schools +4.1/10.0
- Livability +3.8/5.0
- Condition / age +2.5/5.0
- Rent growth +2.2/5.0
- Appreciation +0.0/10.0
$342,000
🖨 Deal sheet 📄 Offer letter ✓ Due diligence
Listing remarks
Welcome to 17051 Colony Lakes Blvd — a beautifully maintained home offering comfort, functionality, and peaceful lakefront living in Fort Myers. This well-appointed 2-bedroom plus den, 2-bath residence features a spacious and thoughtfully designed floor plan highlighted by a large kitchen with abundant counter space, generous cabinetry, and plenty of room to gather. The home has been thoughtfully updated with impact windows throughout, a new roof, new water heater, new washer and dryer, and a newer A/C unit, providing both efficiency and peace of mind. Inside, custom built-in cabinetry adds style and functionality throughout the home. The primary suite serves as a comfortable retreat,
Key facts
- Lakefront living
- New washer and dryer
- New water heater
Tags
Property features AI
Finance
- Financial info: Property is part of a multi-unit complex with 175 units total; 2 units in the building; 1 unit per floor
- HOA & community: Mandatory HOA; Quarterly HOA fee of $950; Master HOA fee of $1 annually; Total annual recurring fees approximately $3,801; Total one-time fees approximately $400; Professional management; Community amenities include clubhouse, community pool, community spa/hot tub and play area; HOA covers lawn/land maintenance, exterior pest control, recreation facilities and trash removal; Non-gated community
Exterior
- Parking: Attached 2-car garage
- Security: Security system; Smoke detectors
- Utilities: Water assessments paid; Sewer assessments paid; Cable available; Electric service for heating and cooling (central)
- Home design: Residential villa attached (duplex end-unit); Single-story (1 floor); Rear exposure to the west; Located in the Colony Lakes community
- Construction: Concrete block construction; Built in 2001; Tile roof; Stucco exterior
- Exterior features: Pond on property; Lake waterfront; Landscaped areas and water views; Above-ground screened private spa; Impact-resistant windows; Manual shutters and fabric/screen shutters; Stucco exterior finish; Tile roof
Interior
- Kitchen: Electric cooktop; Range; Microwave; Dishwasher; Refrigerator/Freezer
- Bedrooms: 3 bedrooms
- Flooring: Tile flooring
- Bathrooms: 2 full bathrooms; Master bath with separate tub and shower
- Heating & cooling: Central electric heat; Central electric cooling; Ceiling fans
- Interior features: Built-in cabinets; Cable prewire; High-speed internet available; Smoke detectors; Great room floor plan; Dining area combined with living room; Den/Study; Screened lanai/porch; Partially furnished
- Laundry & utility: Washer and dryer in residence; Auto garage door; Security system; Satellite dish
Neighborhood map
What this means for you Summary
Snapshot
- This is a 3-bed/2.0-bath condo listed at $342k.
Deal economics
- At list price, monthly cash flow is $-116 ($-1k/yr) — negative.
- To cash-flow at today's rent, offer at most $321k (6.0% below list).
- Meets the 1% rule at list price ($3k rent vs $342k).
- Recommended offer: $311k (9.0% below list) — sets the bar for market timing.
- Cap rate 7.4% vs local median 1.8% in Cypress Lake — top-decile yield for the area; either an underpriced asset or a hidden risk that comps aren't pricing in. Stress-test before assuming the spread holds.
Location & tenants
- Location reads 75/100 on livability (#257 in FL, #4,125 nationally) — a middle-class / working-renter tenant base. Strengths: schools A+, cost of living A+, housing A+; Watch: amenities F, commute F.
- Lee (suburban): math 47% / reading 50% proficiency, ranked #42 of 73 in FL (top 58%) — families likely to look elsewhere, expect single-tenant / working-renter base with shorter leases.
- Market conditions: Rents soft (-1.2%/yr); 1244 active listings in the ZIP; 35 comparable units currently listed for rent nearby; rentals at typical pace (median 15d on market — plan ~3-4 weeks tenant-placement turnaround); solid renter incomes; 15,411 units permitted in Lee County in 2024 (4,686 in 5+ unit buildings).
- At $3,449/mo this rent would consume 55% of the median local household income ($75k/yr) (locally 1944% of renters already pay >50% of income on rent) — very limited rent-growth headroom before tenants either downsize or default.
Forward outlook
- Local home prices are declining (-3.0%/yr); year-one equity from $2k of loan paydown is wiped out by about $10k of value loss. Plan a longer hold.
- Lee County population projected at +44% by 2050 — long-run rental-demand tailwind backs the buy-and-hold thesis.
Negotiation context
- It's been on market 94 days — a 9% lower offer ($311k) is reasonable based on typical stale-listing flexibility.
Risks & watch-outs
- Watch-outs: flood insurance adds $427/mo.
- Climate carrying-cost: in FEMA flood zone AE (mandatory federal flood insurance); severe wind risk, 99% chance of damaging wind over 30y; extreme-heat days projected 7→32/yr by 2055 (HVAC capex compounding) — expect insurance premiums to compound above CPI over the hold.
Questions for the listing agent
- What do current leases actually rent for vs. the listed asking? Can we see a recent rent roll and the last 12 months of T-12 income?
- It's been on market 94 days. Have you received any prior offers? Is the seller open to a 9% concession, seller financing, or rate buy-down credit?
- What's the actual annual flood-insurance premium (NFIP or private), and is the property in a SFHA with mandatory coverage?
- What does the HOA fee cover, when was the last increase, and are there any pending special assessments or reserve-fund shortfalls?
- Any open or pending special assessments — roof, HVAC, plumbing, elevator, façade? What's the per-unit balance and payoff schedule, and is the seller paying it off at close or rolling it to the buyer?
- Why hasn't it sold? Are there any deal-killer items the seller is aware of (foundation, flood, title, zoning, code violations)?
- Is there a deadline driving the sale (1031 exchange, divorce, estate, relocation)? That informs how much negotiation room exists.
- Schools are A-rated — typically a magnet for longer-tenancy family renters. What's the average tenant stay here, and is there a school-zone premium baked into asking?
- The area grade is low — what's the realistic commute time and amenity access for the typical tenant pool here? Any planned neighborhood developments (good or bad) we should know about?
- This sits on a lake — are riparian / water-frontage rights deeded with the parcel? Any dock permits, shoreline easements, or HOA water-use restrictions?
- What's the documented flood / surge / shoreline-erosion history here (FEMA AND non-FEMA — e.g., storm surge, creek backup, septic-field saturation)?
- Any water-quality or seasonal algae-bloom issues that affect tenant satisfaction or short-term-rental demand?
- What's the average days-on-market for RENTAL listings here right now (not sales)? A rising rental-DOM trend means longer vacancies and softer asking-rent achievability than the comps imply.
- What's the recent tenant-quality profile in this submarket — average credit score on applications, eviction rate, late-payment / NSF rate, and stable-employment percentage? A property-management company in the area should have these aggregated.
- How much new apartment / multifamily construction is in the pipeline within 1–3 miles? Heavy new supply (>2% of stock underway) typically softens rents 12–24 months out; light construction supports rent growth.
Investment metrics
- 1% rule
- 1.01% ✓
- Cap rate
- 7.38%
- Cash-on-cash
- 3.89%
- DSCR
- 1.17
- GRM
- 8.3
CMA / ARV
No comps found within radius.
Projected returns pro-forma
-3.0% appreciation · 0.0% rent growth · sell at horizon
- IRR
- -22.8%
- Equity multiple
- 0.24×
- Total profit
- $-72,599
- Equity at exit
- $50,993
- IRR
- -30.8%
- Equity multiple
- -0.15×
- Total profit
- $-110,426
- Equity at exit
- $29,570
Cash invested: $95,760 (down + closing). Projections, not guarantees.
Landlord ↔ Tenant lean methodology
- Overall (STATE)
- 87 Strongly Landlord-Friendly
- State Florida
- 87 Strongly Landlord-Friendly · R+3
- County
- — inherits STATE
- City
- — inherits STATE
ZIP-level market 33908
- Home prices YoY
- -32.8%
- Rents YoY
- -1.2%
- Active inventory
- 1244
- Price-to-rent
- 8.3×
Monthly cashflow live
- Estimated rent
- $3,449 high interval (Pro) →
- Mortgage (P&I)
- −$1,793
- Tax from tax record
- −$162 /mo · $1,948/yr
- Insurance
- −$142
- Flood insurance flood zone
- −$427 /mo · $5,118/yr
- HOA
- −$316
- Vacancy / Maint / Mgmt
- −$724
- Net cashflow
- $-116
Break-even live
UW: 25.0% down · 7.5% · 30yr · 1.5% tax · 5.0% vac · 8.0% maint · 8.0% mgmt
Financing live
Cash to close
- Down payment
- $85,500
- Closing costs
- $10,260
- Reserves months
- —
- Total cash needed
- —
Loan-product check · same deal, 3 products live
Conventional
25% down · 7.5% · 30yr
- Down + closing
- —
- Monthly P&I
- —
- Monthly cashflow
- —
- DSCR
- —
- Eligible?
- —
Personal DTI + credit; lowest rate.
DSCR
20% down · 8.5% · 30yr
- Down + closing
- —
- Monthly P&I
- —
- Monthly cashflow
- —
- DSCR
- —
- Eligible?
- —
No personal income docs; deal must DSCR.
Hard money
10% down · 12.0% · 12mo
- Down + closing
- —
- Monthly P&I
- —
- Monthly cashflow
- —
- DSCR
- —
- Eligible?
- —
Short-term bridge; refi at stabilization.
Rent comps 35 comps
| Address | Beds | Baths | Sqft | Rent | $/sqft | DOM | Units | Dist |
|---|---|---|---|---|---|---|---|---|
| 16320 Willowcrest Way Fort Myers, FL | 2.0 | 2.0 | 1751 | $8,700 | $4.97 | 14d | 1 | 0.50mi |
| 17006 Middlebrook Ct Fort Myers, FL | 2.0 | 2.0 | 1498 | $6,300 | $4.21 | 16d | 1 | 0.50mi |
| 17006 Middlebrook Ct Fort Myers, FL | 2.0 | 2.0 | 1247 | $6,300 | $5.05 | 14d | 1 | 0.50mi |
| 8549 S Lake Cir Fort Myers, FL | 3.0 | 2.0 | 2091 | $3,500 | $1.67 | 23d | 1 | 0.50mi |
| 9250 Bayberry Bnd #202 Fort Myers, FL | 2.0 | 2.0 | 1669 | $4,950 | $2.97 | 14d | 1 | 0.54mi |
| 9240 Bayberry Bnd #103 Fort Myers, FL | 3.0 | 2.0 | 1584 | $6,600 | $4.17 | 23d | 1 | 0.55mi |
| 9241 Bayberry Bnd #103 Fort Myers, FL | 3.0 | 2.0 | 1584 | $4,725 | $2.98 | 14d | 1 | 0.59mi |
| 9240 Willowcrest Ct Fort Myers, FL | 2.0 | 2.0 | 1752 | $8,500 | $4.85 | 14d | 1 | 0.64mi |
| 9201 Bayberry Bnd #103 Fort Myers, FL | 2.0 | 2.0 | 1724 | $3,500 | $2.03 | 23d | 1 | 0.66mi |
| 16421 Millstone Cir Fort Myers, FL | 2.0 | 2.0 | 1068 | $4,400 | $4.12 | 16d | 2 | 0.66mi |
| 11848 Bayport Ln #2002 Fort Myers, FL | 3.0 | 2.0 | 1661 | $2,200 | $1.32 | 23d | 1 | 0.66mi |
| 16430 Millstone Cir #103 Fort Myers, FL | 2.0 | 2.0 | 1067 | $6,300 | $5.90 | 14d | 1 | 0.74mi |
| 16440 Millstone Cir #203 Fort Myers, FL | 2.0 | 2.0 | 1067 | $6,300 | $5.90 | 14d | 1 | 0.76mi |
| 9190 Southmont Cv #309 Fort Myers, FL | 3.0 | 2.0 | 1331 | $6,500 | $4.88 | 2d | 1 | 0.76mi |
| 16471 Millstone Cir #303 Fort Myers, FL | 2.0 | 2.0 | 1068 | $6,100 | $5.71 | 14d | 1 | 0.78mi |
| 17020 Willowcrest Way Fort Myers, FL | 2.0–3.0 | 2.0 | 1344 | $6,300 | $4.69 | 16d | 2 | 0.78mi |
| 16491 Millstone Cir #207 Fort Myers, FL | 2.0 | 2.0 | 1348 | $2,000 | $1.48 | 14d | 1 | 0.80mi |
| 16481 Millstone Cir #207 Fort Myers, FL | 3.0 | 2.0 | 1348 | $2,700 | $2.00 | 23d | 1 | 0.80mi |
| 8986 Greenwich Hills Way #201 Fort Myers, FL | 2.0 | 2.0 | 2040 | $5,200 | $2.55 | 23d | 1 | 0.82mi |
| 9170 Southmont Cv Fort Myers, FL | 2.0–3.0 | 2.0 | 1358 | $6,300 | $4.64 | 14d | 1 | 0.82mi |
| 8837 E Bay Cir Fort Myers, FL | 2.0 | 2.0 | 1156 | $2,600 | $2.25 | 23d | 1 | 0.86mi |
| 9140 Southmont Cv #102 Fort Myers, FL | 3.0 | 2.0 | 1331 | $2,500 | $1.88 | 14d | 1 | 0.95mi |
| 15250 Sonoma Dr Fort Myers, FL | 1.0–3.0 | 1.0–2.0 | 1252 | $2,365 | $1.89 | 3d | 31 | 1.00mi |
| 17100 Bridgestone Ct #303 Fort Myers, FL | 2.0 | 2.0 | 1175 | $4,575 | $3.89 | 14d | 1 | 1.03mi |
| 3705 Stoneridge Ct Fort Myers, FL | 3.0 | 2.0 | 2200 | $3,500 | $1.59 | 19d | 1 | 1.12mi |
| 17120 Bridgestone Ct #104 Fort Myers, FL | 2.0 | 2.0 | 1282 | $2,400 | $1.87 | 23d | 1 | 1.13mi |
| 17120 Bridgestone Ct #104 Fort Myers, FL | 2.0 | 2.0 | 1175 | $2,400 | $2.04 | 3d | 1 | 1.13mi |
| 15800 Portofino Springs Blvd #102 Fort Myers, FL | 3.0 | 2.5 | 1761 | $2,500 | $1.42 | 23d | 1 | 1.17mi |
| 9470 Sardinia Way #107 Fort Myers, FL | 3.0 | 2.5 | 1761 | $2,300 | $1.31 | 3d | 1 | 1.23mi |
| 16214 Via Solera Cir #5 Fort Myers, FL | 2.0 | 2.5 | 1300 | $1,750 | $1.35 | 23d | 1 | 1.26mi |
| 8995 Spring Mountain Way Fort Myers, FL | 4.0 | 3.5 | 2136 | $2,895 | $1.36 | 3d | 1 | 1.42mi |
| 9813 Quinta Artesa Way #103 Fort Myers, FL | 3.0 | 2.5 | 1819 | $2,250 | $1.24 | 14d | 1 | 1.45mi |
| 9813 Quinta Artesa Way #104 Fort Myers, FL | 3.0 | 2.5 | 1819 | $1,850 | $1.02 | 23d | 1 | 1.45mi |
| 9814 Quinta Artesa Way #102 Fort Myers, FL | 2.0 | 2.5 | 1756 | $4,250 | $2.42 | 23d | 1 | 1.47mi |
| 16114 Via Solera Cir #105 Fort Myers, FL | 2.0 | 2.5 | 1819 | $2,200 | $1.21 | 23d | 1 | 1.49mi |
HOA detail condo
- Monthly dues
- $316 · $3,792/yr
- Likely covers
- water
- Assessments
- None detected in remarks — confirm with the listing agent.
Listing history 16 events
-
2026-06-17days on market $342,000 Active 94 DOM
-
2026-06-16pricedays on market $342,000 Active 93 DOM
-
2026-06-15days on market $352,500 Active 92 DOM
-
2026-06-13days on market $352,500 Active 90 DOM
-
2026-06-10days on market $352,500 Active 87 DOM
-
2026-06-09days on market $352,500 Active 86 DOM
-
2026-06-07days on market $352,500 Active 84 DOM
-
2026-06-03days on market $352,500 Active 80 DOM
-
2026-06-02days on market $352,500 Active 79 DOM
-
2026-06-01days on market $352,500 Active 78 DOM
-
2026-06-01days on market $352,500 Active 77 DOM
-
2026-04-02price $352,500
-
2026-03-15$362,500 Active
-
2025-05-01soldstatus $345,000
-
2001-01-23soldstatus $100,000
-
2000-09-29soldstatus $1,300,000
ⓘ Source: listings_history table (triggers on properties + properties_extension) + one-shot
backfill from property_details.listing_events for pre-trigger history.
Tax reassessment forecast FL · Resets to sale price
- Current annual tax
- $1,948 · $162/mo
- Projected year-2 tax
- $2,839 · $237/mo
- Expected delta
- +$891/yr (+$74/mo · 45.7%)
ⓘ Screening estimate from a state-policy table — verify with the county assessor before closing.
Climate risk First Street
- Flood 9/10 Extreme FEMA zone AE · 99% chance over 30 yrs
- Wildfire 1/10 Low
- Heat 10/10 Extreme 7 d/yr ≥107°F today · 32 d/yr by 30 yrs out
- Wind 10/10 Extreme 99% chance of damaging wind over 30 yrs
- Air quality 2/10 Low 1 unhealthy d/yr today · 1 by 30 yrs out
Nearby sold comps map
Loading sold comps map…
Walkable amenities ~0.75 mi
Loading nearby amenities…
Taxation est. · year 1
- Rental income
- $41,383
- − Mortgage interest
- −$19,157
- − Property taxes
- −$1,948
- − Insurance
- −$6,829
- − Repairs & maintenance
- −$3,311
- − Management
- −$3,311
- − HOA
- −$3,792
- − Depreciation
- −$9,949
- Taxable loss
- −$6,913
- Est. tax savings @ 24.0%
- +$1,659
- After-tax cash flow
- $261/yr
For passive investors: Depreciation is non-cash, so a rental often shows a tax loss while cash-flowing — sheltering income. Rental losses are passive: they offset passive income freely, and up to $25,000/yr can offset ordinary (W-2) income if you actively participate and your MAGI is under $100k (phasing out to $0 by $150k); unused losses carry forward. On sale, claimed depreciation is recaptured at up to 25%, and gains may owe capital-gains tax (a 1031 exchange can defer both). Figures are a year-1 estimate at your 24.0% rate — not tax advice; consult a CPA.
Schools (NCES district)
- District
- Lee
- NCES district ID
- 1201080
- Math proficiency
- 47% ▼ -11.00%
- Reading proficiency
- 50% ▼ -4.00%
- Median HH income
- $49,518
- Composite
- 41.49/100
- National rank
- #3458
- State rank
- #42 of 73 in FL
Livability — Cypress Lake
- Score
- 75/100
- State rank
- #257
- US rank
- #4125
Category grades
Schools grade is shown separately in the Schools card above.
Census & demographics
- County
- Lee County · 788,662 people
- Metro
- Cape Coral-Fort Myers, FL
- Population (ZIP)
- 37,423
- Household income
- $75,396
- Rent vs Own
- Severe rent burden
- 1944.0
Population outlook (Lee County) Hauer SSP2
- Today (2025)
- 871,946 people
- By 2030
- 955,468 · +9.6%
- By 2040
- 1,113,587 · +27.7%
- By 2050
- 1,256,891 · +44.1%
- By 2075
- 1,560,270 · +78.9%
- By 2100
- 1,726,848 · +98.0%
Race, ethnicity, and origin ACS 2023
- Neighborhood character
- Predominantly White (88%)
- Race & ethnicity
- White 88% Hispanic / Latino 6% Two or more races 5% Black 3% Asian 1%
- Hispanic origin (detail)
- Mexican 1% Puerto Rican 2%
- Common ancestry
- Romanian 5% Lithuanian 4% Slovak 3%
- Foreign-born
- 10% · Canada, Jamaica
- Languages at home
- 90% English-only · Spanish 4% Russian/Polish/Slavic 1% Other Indo-European 1%
Political lean MEDSL · Lee
- 2024 margin
- Strong R (+28.4) · D 35.5% · R 63.9%
- 2008→2024 swing
- -18.0pp toward R · 2008: -10.4pp · 2024: -28.4pp
- All cycles
- 2024: R+28.4 2020: R+19.2 2016: R+20.4 2012: R+16.6 2008: R+10.4
Not yet ingested
- Civics
- —
Market trends
- HPI YoY
- ▼ -102.22%
- Current HPI
- 209.7595
- Rent YoY
- ▼ -1.18%
- Metro
- Cape Coral-Fort Myers, FL
- State GDP YoY
- ▲ 3.28%
- F500 in state
- 36
Industry mix (Fortune 500 HQ in FL)
| Industry | F500 HQs | Revenue |
|---|---|---|
| Industrial Technology | 2 | $29B |
|
||
| Insurance | 2 | $17B |
|
||
| Retail | 1 | $60B |
|
||
| Technology Distribution | 1 | $58B |
|
||
| Homebuilding | 1 | $35B |
|
||
| Technology Manufacturing | 1 | $35B |
|
||
Price history
-72.9% since first listed5 events — show timeline
- 2026-04-02 Price Changed $352,500 BEARMLS
- 2026-03-15 Listed $362,500 BEARMLS
- 2025-05-01 Sold (Public Records) $345,000 Public Records
- 2001-01-23 Sold (Public Records) $100,000 Public Records
- 2000-09-29 Sold (Public Records) $1,300,000 Public Records
Property tax history
+1.1%/yrLatest (2025): $1,948 · +5.0% YoY. Source: county tax records.
Cash-flow waterfall
monthlySold comps — $/sqft
last 12 mo · ≤1 miLoading sold comps…