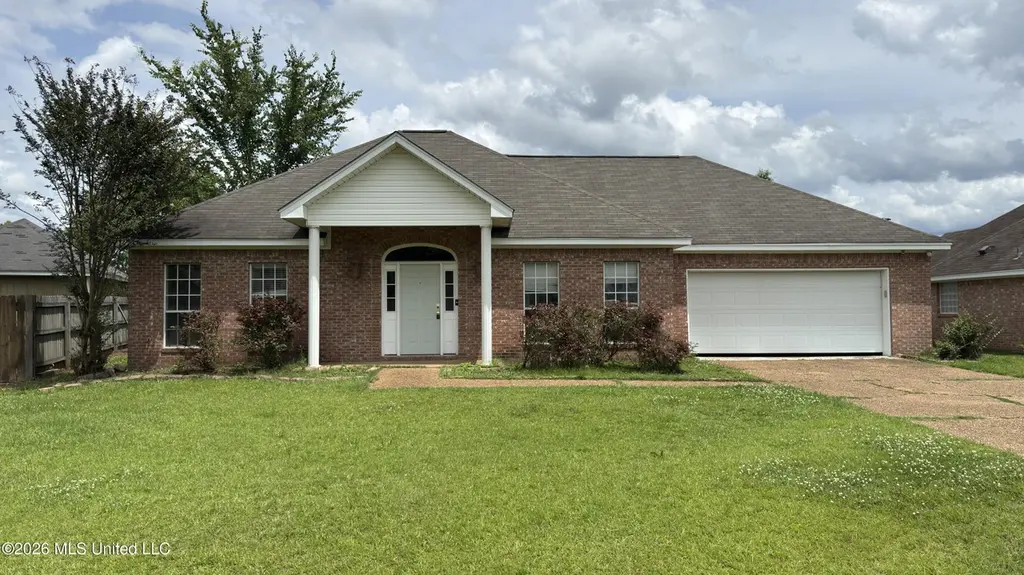
218 Holmar Dr · Flowood, MS
Flood risk 1/10 · Minimal
- FEMA flood zone
- X (unshaded)
- Chance of flooding over 30 yrs
- 0.0%
- Est. flood insurance / yr
- $507 – $1,088
Fire risk 4/10 · Minor
- Est. fire insurance / yr
- $1,241 – $2,305
Heat risk 8/10 · Major
- Hot days now (above 108°F)
- 7 days/yr
- Hot days in 30 yrs
- 21 days/yr
Wind risk 7/10 · Major
- Chance of severe wind over 30 yrs
- 78.0%
Air-quality risk 1/10 · Minimal
- Unhealthy air days now
- 0 days/yr
- Unhealthy air days in 30 yrs
- 0 days/yr
Risk factors via First Street. Map © Google.
Why this score? — see what drove the C grade
The composite is a weighted blend of 9 inputs, each scored 0–100. Each bar is that input's sub-score; the figure is the points it added to the 100-point composite (weight × sub-score).
- Cash flow +21.1/30.0
- ARV discount +13.0/15.0
- DSCR +6.7/10.0
- 1% rule +4.7/10.0
- Schools +4.6/10.0
- Livability +3.9/5.0
- Rent growth +3.2/5.0
- Condition / age +2.5/5.0
- Appreciation +0.0/10.0
$219,900
🖨 Deal sheet (PDF) 📄 Offer letter ✓ Due diligence
Listing remarks
This house located at 218 Holmar Drive in Reservoir East Subdivision of Brandon, MS has both desirable interior features and a fenced in backyard with a covered back porch. Space inside of the house includes 3 bedrooms * * * 2 full baths * * * Foyer * * * Living Room with Fireplace * * * Kitchen with Eat In area * * * Dining Room with Built In Shelving * * * Laundry Room * * * approximately +/- 1577 square feet and a 2-car garage. This house may be shown by a licensed Mississippi Real Estate Agent so reach out to your Agent to schedule your showing and make sure to click on the photos to preview more inside and outside pictures.
Key facts
- Laundry room
- Fenced in backyard
- Covered back porch
Tags
Property features AI
Exterior
- Parking: Attached garage facing front; 2-car garage
- Utilities: Public water; Public sewer
- Home design: Single family residence (house); One level
- Construction: Vinyl and brick exterior; Asphalt shingle roof; Slab foundation; Built in public-records year
- Exterior features: Back yard fencing (privacy, wood); City lot; Fenced
Interior
- Kitchen: Free-standing electric range; Microwave; Eat-in kitchen
- Flooring: Ceramic tile; Wood
- Bathrooms: 2 full bathrooms
- Heating & cooling: Central heating (natural gas); Fireplace heating; Central air; Ceiling fan(s); Electric cooling
- Interior features: Bookcases; Built-in features; Ceiling fan(s); Double vanity; Eat-in kitchen; Walk-in closet(s); Blinds; Has fireplace (gas log in living room)
- Laundry & utility: Laundry room
Neighborhood map
What this means for you Summary
Snapshot
- This is a 3-bed/2.0-bath single-family listed at $220k.
Deal economics
- At list price, monthly cash flow is $312 ($4k/yr) — positive.
- The deal already cash-flows at list — no discount required.
- To meet the 1% rule (rent ≥ 1% of price), the offer needs to be $213k (2.9% below list).
- Recommended offer: $213k (2.9% below list) — sets the bar for 1% rule.
- Cap rate 8.0% vs local median 4.3% in Flowood — top-decile yield for the area; either an underpriced asset or a hidden risk that comps aren't pricing in. Stress-test before assuming the spread holds.
Location & tenants
- Location reads 77/100 on livability (#10 in MS, #3,075 nationally) — a middle-class / working-renter tenant base. Strengths: crime A+, cost of living A+, housing A+; Watch: amenities F, commute F.
- Rankin County School District (rural): math 56% / reading 48% proficiency, ranked #6 of 130 in MS (top 5%) — acceptable for families but not a draw, mixed tenant base, ~2y average lease.
- Zoned schools: Oakdale Elementary (math 57% / reading 50%, grade C, #49 of 375 statewide, top 13%, 532 students, 99% FRL); Northwest Rankin Middle School (math 63% / reading 51%, grade B, #13 of 179 statewide, top 7%, 1,374 students, 100% FRL); Northwest Rankin High School (math 48% / reading 42%, grade D-, #34 of 197 statewide, top 17%, 1,898 students, 100% FRL) — zoned schools average 100% FRL vs 35% district-wide (65 pts higher); higher-poverty schools than district average — tighter screening recommended.
- Market conditions: Rents rising (+2.9%/yr); 433 active listings in the ZIP; 1 comparable units currently listed for rent nearby; solid renter incomes; 343 units permitted in Rankin County in 2024 (0 in 5+ unit buildings).
Forward outlook
- Local home prices are declining (-3.0%/yr); year-one equity from $2k of loan paydown is wiped out by about $7k of value loss. Plan a longer hold.
- Rankin County population projected at +17% by 2050 — long-run rental-demand tailwind backs the buy-and-hold thesis.
Negotiation context
- It's been on market 24 days — a 2% lower offer ($217k) is reasonable based on typical stale-listing flexibility.
- 8 sale attempts since 22y ago with the ask held roughly flat each time — persistent listings suggest the price (not the market) is what's stuck; bring a comps-based counter.
Risks & watch-outs
- Climate carrying-cost: major wind risk, 78% chance of damaging wind over 30y; extreme-heat days projected 7→21/yr by 2055 (HVAC capex compounding) — expect insurance premiums to compound above CPI over the hold.
Questions for the listing agent
- Is there a deadline driving the sale (1031 exchange, divorce, estate, relocation)? That informs how much negotiation room exists.
- Schools are B-rated — typically a magnet for longer-tenancy family renters. What's the average tenant stay here, and is there a school-zone premium baked into asking?
- What's the average days-on-market for RENTAL listings here right now (not sales)? A rising rental-DOM trend means longer vacancies and softer asking-rent achievability than the comps imply.
- What's the recent tenant-quality profile in this submarket — average credit score on applications, eviction rate, late-payment / NSF rate, and stable-employment percentage? A property-management company in the area should have these aggregated.
- How much new for-sale + rental construction is in the pipeline within 1–3 miles? Heavy new supply typically softens prices + rents 12–24 months out; constrained supply supports both.
Investment metrics
- 1% rule
- 0.97% ✗
- Cap rate
- 8.00%
- Cash-on-cash
- 6.09%
- DSCR
- 1.27
- GRM
- 8.6
CMA / ARV
- ARV (on-the-fly)
- $250,743
- Comps found
- 12
Show comp detail 12 sales within ~0.75 mi
| Address | Dist | Beds/Ba | Sqft | Sold | Price | $/sf | Match |
|---|---|---|---|---|---|---|---|
| 204 Holmar Dr | 0.09mi | 3/2.0 | 1,599 (+1%) | 5mo | $229,900 | $144 | 89 |
| 202 Cherry Bark Dr | 0.19mi | 3/2.0 | 1,555 (-1%) | 4mo | $248,900 | $160 | 86 |
| 504 Kate Lofton Dr | 0.32mi | 3/2.0 | 1,566 (-1%) | 3mo | $262,900 | $168 | 82 |
| 306 Red Cedar Dr | 0.20mi | 4/2.0 (+1) | 1,547 (-2%) | 2mo | $249,900 | $162 | 81 |
| 313 Red Cedar Dr | 0.17mi | 3/2.0 | 1,687 (+7%) | 5mo | $259,900 | $154 | 76 |
| 812 Jason Cv | 0.36mi | 3/2.0 | 1,531 (-3%) | 2mo | $239,000 | $156 | 76 |
| 168 Blackstone Cir | 0.46mi | 3/2.0 | 1,545 (-2%) | 2mo | $244,900 | $159 | 74 |
| 221 Cherry Bark Dr | 0.10mi | 3/2.0 | 1,400 (-11%) | 4mo | $248,000 | $177 | 73 |
| 328 Red Cedar Dr | 0.24mi | 3/2.0 | 1,748 (+11%) | 2mo | $265,000 | $152 | 70 |
| 116 Holmar Dr | 0.39mi | 3/2.0 | 1,477 (-6%) | 5mo | $242,900 | $164 | 67 |
| 114 Sara Fox Dr | 0.23mi | 4/2.0 (+1) | 1,740 (+10%) | 1mo | $269,900 | $155 | 66 |
| 918 Frisky Dr | 0.42mi | 3/2.0 | 1,741 (+10%) | 0mo | $259,900 | $149 | 63 |
Match score weights: distance 35% · size 25% · config 20% · recency 20%. Top-matched comps best support the ARV.
Projected returns pro-forma
-3.0% appreciation · 2.9% rent growth · sell at horizon
- IRR
- -7.0%
- Equity multiple
- 0.74×
- Total profit
- $-16,004
- Equity at exit
- $32,788
- IRR
- 2.4%
- Equity multiple
- 1.17×
- Total profit
- $10,578
- Equity at exit
- $19,013
Cash invested: $61,572 (down + closing). Projections, not guarantees.
Landlord ↔ Tenant lean methodology
- Overall (STATE)
- 90 Strongly Landlord-Friendly
- State Mississippi
- 90 Strongly Landlord-Friendly · R+11
- County
- — inherits STATE
- City
- — inherits STATE
ZIP-level market 39047
- Home prices YoY
- -32.6%
- Rents YoY
- 2.9%
- Active inventory
- 433
- Price-to-rent
- 8.6×
Monthly cashflow live
- Estimated rent
- $2,134 medium interval (Pro) →
- Mortgage (P&I)
- −$1,153
- Tax from tax record
- −$129 /mo · $1,546/yr
- Insurance
- −$92
- HOA
- −$0
- Vacancy / Maint / Mgmt
- −$448
- Net cashflow
- $312
Break-even live
Sensitivity live
| Price | -10% $437 | -5% $375 | +0% $312 | +5% $250 | +10% $188 |
|---|---|---|---|---|---|
| Rent | -10% $144 | -5% $228 | +0% $312 | +5% $397 | +10% $481 |
| Rate | -1.0pp $423 | -0.5pp $368 | base $312 | +0.5pp $255 | +1.0pp $198 |
UW: 25.0% down · 7.5% · 30yr · 1.5% tax · 5.0% vac · 8.0% maint · 8.0% mgmt
Financing live
Cash to close
- Down payment
- $54,975
- Closing costs
- $6,597
- Reserves months
- —
- Total cash needed
- —
Loan-product check · same deal, 3 products live
Conventional
25% down · 7.5% · 30yr
- Down + closing
- —
- Monthly P&I
- —
- Monthly cashflow
- —
- DSCR
- —
- Eligible?
- —
Personal DTI + credit; lowest rate.
DSCR
20% down · 8.5% · 30yr
- Down + closing
- —
- Monthly P&I
- —
- Monthly cashflow
- —
- DSCR
- —
- Eligible?
- —
No personal income docs; deal must DSCR.
Hard money
10% down · 12.0% · 12mo
- Down + closing
- —
- Monthly P&I
- —
- Monthly cashflow
- —
- DSCR
- —
- Eligible?
- —
Short-term bridge; refi at stabilization.
Rent comps 1 comps
| Address | Beds | Baths | Sqft | Rent | $/sqft | DOM | Units | Dist |
|---|---|---|---|---|---|---|---|---|
| 913 Caitlin Cv Brandon, MS | 3.0 | 2.0 | 1636 | $2,100 | $1.28 | 14d | 1 | 0.24mi |
Listing history 32 events
-
2026-06-18days on market $219,900 Active 24 DOM
-
2026-06-17days on market $219,900 Active 23 DOM
-
2026-06-16days on market $219,900 Active 22 DOM
-
2026-06-15days on market $219,900 Active 21 DOM
-
2026-06-14days on market $219,900 Active 19 DOM
-
2026-06-13days on market $219,900 Active 18 DOM
-
2026-06-10days on market $219,900 Active 16 DOM
-
2026-06-09days on market $219,900 Active 15 DOM
-
2026-06-08days on market $219,900 Active 14 DOM
-
2026-06-07days on market $219,900 Active 13 DOM
-
2026-06-03days on market $219,900 Active 9 DOM
-
2026-06-02days on market $219,900 Active 8 DOM
-
2026-06-01days on market $219,900 Active 7 DOM
-
2026-05-31days on market $219,900 Active 6 DOM
-
2026-05-30days on market $219,900 Active 5 DOM
-
2026-05-25$219,900 Active
-
2025-06-20status Pending
-
2025-06-20historical
-
2025-06-16$225,000 Active
-
2021-10-08historical
-
2021-10-08historical
-
2020-10-07soldstatus
-
2020-07-16$174,800
-
2014-04-20soldstatus
-
2013-10-14$149,900
-
2009-04-23$162,500
-
2006-08-03$161,500
-
2006-05-02historical
-
2004-11-24soldstatus
-
2004-11-19soldstatus
-
2004-05-10$143,000
-
2004-05-01$146,900
ⓘ Source: listings_history table (triggers on properties + properties_extension) + one-shot
backfill from property_details.listing_events for pre-trigger history.
Tax reassessment forecast MS · Resets to sale price
- Current annual tax
- $1,546 · $129/mo
- Projected year-2 tax
- $1,737 · $145/mo
- Expected delta
- +$191/yr (+$16/mo · 12.4%)
ⓘ Screening estimate from a state-policy table — verify with the county assessor before closing.
Climate risk First Street
- Flood 1/10 Low FEMA zone X (unshaded) · 0% chance over 30 yrs
- Wildfire 4/10 Moderate
- Heat 8/10 Severe 7 d/yr ≥108°F today · 21 d/yr by 30 yrs out
- Wind 7/10 Severe 78% chance of damaging wind over 30 yrs
- Air quality 1/10 Low 0 unhealthy d/yr today · 0 by 30 yrs out
Nearby sold comps map
Loading sold comps map…
Walkable amenities ~0.75 mi
Loading nearby amenities…
Taxation est. · year 1
- Rental income
- $25,612
- − Mortgage interest
- −$12,318
- − Property taxes
- −$1,546
- − Insurance
- −$1,100
- − Repairs & maintenance
- −$2,049
- − Management
- −$2,049
- − Depreciation
- −$6,397
- Taxable income
- $154
- Est. tax owed @ 24.0%
- −$37
- After-tax cash flow
- $3,713/yr
For passive investors: Depreciation is non-cash, so a rental often shows a tax loss while cash-flowing — sheltering income. Rental losses are passive: they offset passive income freely, and up to $25,000/yr can offset ordinary (W-2) income if you actively participate and your MAGI is under $100k (phasing out to $0 by $150k); unused losses carry forward. On sale, claimed depreciation is recaptured at up to 25%, and gains may owe capital-gains tax (a 1031 exchange can defer both). Figures are a year-1 estimate at your 24.0% rate — not tax advice; consult a CPA.
Schools (NCES district)
- District
- Rankin County School District
- NCES district ID
- 2803830
- Math proficiency
- 56% ▼ -4.00%
- Reading proficiency
- 48% ▼ -6.00%
- Median HH income
- $61,867
- Composite
- 45.62/100
- National rank
- #2587
- State rank
- #6 of 130 in MS
Livability — Flowood
- Score
- 77/100
- State rank
- #10
- US rank
- #3075
Category grades
Schools grade is shown separately in the Schools card above.
Census & demographics
- County
- Rankin County · 123,614 people
- City population
- 9,222
- Metro
- Jackson, MS
- Population (ZIP)
- 40,808
- Household income
- $100,347
- Rent vs Own
- Severe rent burden
- 551.0
Population outlook (Rankin County) Hauer SSP2
- Today (2025)
- 164,317 people
- By 2030
- 171,013 · +4.1%
- By 2040
- 182,723 · +11.2%
- By 2050
- 192,376 · +17.1%
- By 2075
- 209,535 · +27.5%
- By 2100
- 209,534 · +27.5%
Race, ethnicity, and origin ACS 2023
- Neighborhood character
- Predominantly White (77%)
- Race & ethnicity
- White 77% Black 16% Two or more races 4% Hispanic / Latino 2% Asian 1%
- Common ancestry
- Italian 4% Slovak 3% Serbian 3%
- Foreign-born
- 3% · Canada
- Languages at home
- 95% English-only · Spanish 3% Other Indo-European 1% Other Asian/Pacific 1%
Political lean MEDSL · Rankin
- 2024 margin
- Solid R (+47.1) · D 25.9% · R 73.0% · Other 1.0%
- 2008→2024 swing
- +6.4pp toward D · 2008: -53.5pp · 2024: -47.1pp
- All cycles
- 2024: R+47.1 2020: R+45.4 2016: R+52.9 2012: R+51.9 2008: R+53.5
Not yet ingested
- Civics
- —
Market trends
- HPI YoY
- ▼ -79.01%
- Current HPI
- 162.9709
- Rent YoY
- ▲ 2.90%
- Metro
- Jackson, MS
- State GDP YoY
- —
- F500 in state
- 0
Price history
+49.7% since first listed17 events — show timeline
- 2026-05-25 Listed $219,900 MLSU
- 2025-06-20 Pending — MLSU
- 2025-06-20 Listing Removed — MLSU
- 2025-06-16 Listed $225,000 MLSU
- 2021-10-08 Listing Removed — MLSU
- 2021-10-08 Listing Removed — MLSU
- 2020-10-07 Sold (MLS) — MLSU
- 2020-07-16 Listed $174,800 MLSU
- 2014-04-20 Sold (MLS) — MLSU
- 2013-10-14 Listed $149,900 MLSU
- 2009-04-23 Listed $162,500 MLSU
- 2006-08-03 Listed $161,500 MLSU
- 2006-05-02 Listing Removed — MLSU
- 2004-11-24 Sold (Public Records) — Public Records
- 2004-11-19 Sold (MLS) — MLSU
- 2004-05-10 Listed $143,000 MLSU
- 2004-05-01 Listed $146,900 MLSU
Property tax history
+4.1%/yrLatest (2025): $1,546 · +6.5% YoY. Source: county tax records.
Cash-flow waterfall
monthlySold comps — $/sqft
last 12 mo · ≤1 miLoading sold comps…