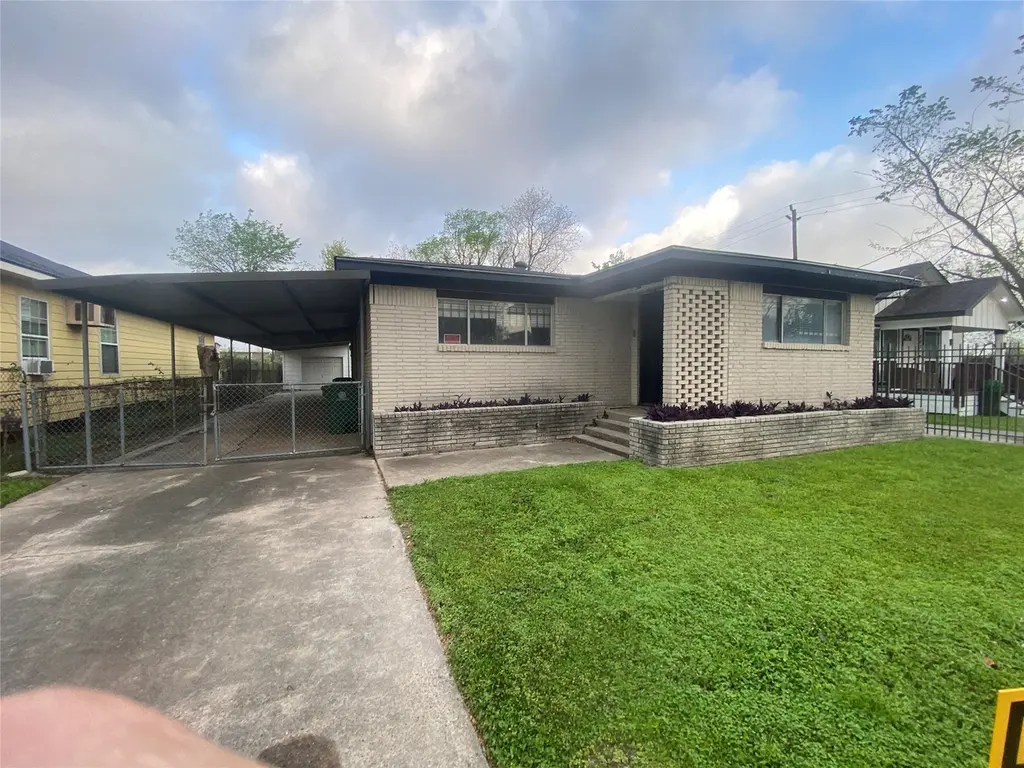
2627 Stevens St · Houston, TX
Flood risk 1/10 · Minimal
- FEMA flood zone
- X (unshaded)
- Chance of flooding over 30 yrs
- 0.0%
- Est. flood insurance / yr
- $507 – $1,088
Fire risk 1/10 · Minimal
- Est. fire insurance / yr
- $1,222 – $2,270
Heat risk 9/10 · Severe
- Hot days now (above 109°F)
- 7 days/yr
- Hot days in 30 yrs
- 24 days/yr
Wind risk 9/10 · Severe
- Chance of severe wind over 30 yrs
- 99.0%
Air-quality risk 3/10 · Minor
- Unhealthy air days now
- 2 days/yr
- Unhealthy air days in 30 yrs
- 3 days/yr
Risk factors via First Street. Map © Google.
Why this score? — see what drove the B- grade
The composite is a weighted blend of 9 inputs, each scored 0–100. Each bar is that input's sub-score; the figure is the points it added to the 100-point composite (weight × sub-score).
- Cash flow +20.0/30.0
- ARV discount +15.0/15.0
- Appreciation +6.9/10.0
- DSCR +6.3/10.0
- 1% rule +6.0/10.0
- Livability +3.7/5.0
- Rent growth +3.3/5.0
- Schools +2.7/10.0
- Condition / age +2.5/5.0
$199,999
🖨 Deal sheet (PDF) 📄 Offer letter ✓ Due diligence
Listing remarks MLS
NICE BRICK HOME! Welcome to this charming brick home brimming with potential, situated on a spacious 5,950 sq. ft. lot in a tranquil North Houston neighborhood. With its vintage charm and ample space for renovation and updating, this property offers the perfect canvas for creating your dream home. Enjoy the peace and quiet of the neighborhood while still being just a short drive away from downtown Houston, where you can indulge in all the city has to offer. Don't miss out on the opportunity to make this delightful residence your own oasis in the heart of Houston. WE MAKE IT EASY TO OWN. This is a great opportunity! Don't wait, call us today to get more information on the owner's easy terms and smooth process that may be able to put the deed in your name and make this your dream home.
Key facts
- Vintage charm
- Spacious lot
- Brick home
Tags
Neighborhood map
What this means for you Summary
Snapshot
- This is a 3-bed/2.5-bath single-family listed at $200k.
Deal economics
- At list price, monthly cash flow is $244 ($3k/yr) — positive.
- The deal already cash-flows at list — no discount required.
- Meets the 1% rule at list price ($2k rent vs $200k).
- Recommended offer: $176k (12.0% below list) — sets the bar for market timing.
- Cap rate 7.8% vs local median 3.2% in Houston — top-decile yield for the area; either an underpriced asset or a hidden risk that comps aren't pricing in. Stress-test before assuming the spread holds.
Location & tenants
- Location reads 74/100 on livability (#184 in TX, #4,771 nationally) — a middle-class / working-renter tenant base. Strengths: amenities A+, cost of living A+, housing A+; Watch: crime F.
- Houston ISD (urban): math 27% / reading 35% proficiency, ranked #593 of 826 in TX (top 72%) — families likely to look elsewhere, expect single-tenant / working-renter base with shorter leases; 71% free/reduced lunch — lower-income household profile, screen leases tightly.
- Zoned schools: Sherman El (math 22% / reading 22%, grade F, #3,333 of 4,322 statewide, top 80%, 528 students, 99% FRL); Fleming Middle (math 10% / reading 15%, grade F, #1,616 of 1,662 statewide, top 97%, 384 students, 97% FRL); Northside H S (math 15% / reading 26%, grade F, #1,389 of 1,632 statewide, top 86%, 1,168 students, 94% FRL) — zoned schools average 97% FRL vs 71% district-wide (26 pts higher); higher-poverty schools than district average — tighter screening recommended.
- Zoned-school proficiency averages 18% at this address vs 31% district-wide (-13 pts) — the specific schools serving this property underperform the Houston ISD average; the district grade overstates school quality for this exact location.
- Market conditions: Rents rising (+3.1%/yr); 449 active listings in the ZIP; 27 comparable units currently listed for rent nearby; rentals lingering (median 46d on market — plan ~5-8 weeks vacancy on turnover, expect pricing pressure); 56% of comp listings sitting > 30 days — soft ceiling on asking rent; lower-income renter base — watch delinquency; 29,883 units permitted in Harris County in 2024 (8,621 in 5+ unit buildings).
Forward outlook
- In year one you build about $9k of equity ($1k loan paydown + $8k appreciation (3.9% local appreciation)).
- Harris County population projected at +47% by 2050 — long-run rental-demand tailwind backs the buy-and-hold thesis.
- At projected returns (3.9% appreciation + 3.1% rent growth), your $56k cash investment doubles in ~5 years — after that, you're playing with house money.
- By year 4, paydown + projected appreciation supports a ~$31k cash-out refi (75% LTV) — recoverable capital for the next deal without selling this one.
Negotiation context
- It's been on market 342 days — a 12% lower offer ($176k) is reasonable based on typical stale-listing flexibility.
Risks & watch-outs
- Watch-outs: built in 1940 — expect roof / HVAC / electrical / plumbing capex.
- Climate carrying-cost: severe wind risk, 99% chance of damaging wind over 30y; extreme-heat days projected 7→24/yr by 2055 (HVAC capex compounding) — expect insurance premiums to compound above CPI over the hold.
Questions for the listing agent
- It's been on market 342 days. Have you received any prior offers? Is the seller open to a 12% concession, seller financing, or rate buy-down credit?
- Built in 1940 — when were the roof, HVAC, electrical panel, plumbing, and water heater last replaced?
- Why hasn't it sold? Are there any deal-killer items the seller is aware of (foundation, flood, title, zoning, code violations)?
- Is there a deadline driving the sale (1031 exchange, divorce, estate, relocation)? That informs how much negotiation room exists.
- Schools are D-rated, which usually means shorter tenancies and higher turnover. Who's the typical renter profile here, and what's been the actual vacancy rate?
- Crime grade is F in this area — have there been break-ins, vandalism, or insurance claims at this property in the last 3 years? What carrier currently insures it and at what premium?
- What's the average days-on-market for RENTAL listings here right now (not sales)? A rising rental-DOM trend means longer vacancies and softer asking-rent achievability than the comps imply.
- What's the recent tenant-quality profile in this submarket — average credit score on applications, eviction rate, late-payment / NSF rate, and stable-employment percentage? A property-management company in the area should have these aggregated.
- How much new for-sale + rental construction is in the pipeline within 1–3 miles? Heavy new supply typically softens prices + rents 12–24 months out; constrained supply supports both.
Investment metrics
- 1% rule
- 1.10% ✓
- Cap rate
- 7.76%
- Cash-on-cash
- 5.23%
- DSCR
- 1.23
- GRM
- 7.6
CMA / ARV
- ARV (median comp)
- $299,302
- List price
- $199,999
- Delta
- -33.18%
- Verdict
- UNDERPRICED
- Comps
- 20 within 1.0 mi
Show comp detail 12 sales within ~0.75 mi
| Address | Dist | Beds/Ba | Sqft | Sold | Price | $/sf | Match |
|---|---|---|---|---|---|---|---|
| 2814 Elysian St | 0.39mi | 4/2.0 (+1) | 1,800 (-2%) | 0mo | $195,000 | $108 | 72 |
| 1913 West St | 0.52mi | 3/2.5 | 1,750 (-4%) | 0mo | $387,000 | $221 | 68 |
| 2906 Brackenridge St | 0.22mi | 3/2.0 | 1,600 (-13%) | 2mo | $245,000 | $153 | 65 |
| 2704 Jensen Creek Ln | 0.26mi | 3/2.5 | 1,586 (-13%) | 3mo | $299,900 | $189 | 63 |
| 3109 Jensen Dr Unit A | 0.28mi | 3/2.5 | 1,560 (-15%) | 0mo | $319,900 | $205 | 62 |
| 3202 Quitman St | 0.46mi | 3/3.5 | 1,700 (-7%) | 3mo | $355,000 | $209 | 60 |
| 1715 Mary St | 0.68mi | 3/3.5 | 1,877 (+3%) | 2mo | $369,900 | $197 | 58 |
| 1717 Mary St | 0.68mi | 3/3.5 | 1,877 (+3%) | 3mo | $369,900 | $197 | 58 |
| 2814 Mills St | 0.65mi | 3/3.5 | 1,972 (+8%) | 1mo | $389,900 | $198 | 52 |
| 2812 Mills St | 0.66mi | 3/3.5 | 1,972 (+8%) | 1mo | $369,900 | $188 | 51 |
| 2804 Mills St | 0.65mi | 3/3.5 | 2,039 (+11%) | 1mo | $379,000 | $186 | 46 |
| 2808 Mills St | 0.66mi | 3/3.5 | 2,039 (+11%) | 1mo | $359,000 | $176 | 45 |
Match score weights: distance 35% · size 25% · config 20% · recency 20%. Top-matched comps best support the ARV.
Projected returns pro-forma
3.89% appreciation · 3.08% rent growth · sell at horizon
- IRR
- 14.7%
- Equity multiple
- 1.88×
- Total profit
- $49,535
- Equity at exit
- $100,151
- IRR
- 16.0%
- Equity multiple
- 3.56×
- Total profit
- $143,511
- Equity at exit
- $162,815
Cash invested: $56,000 (down + closing). Projections, not guarantees.
Landlord ↔ Tenant lean methodology
- Overall (STATE)
- 87 Strongly Landlord-Friendly
- State Texas
- 87 Strongly Landlord-Friendly · R+5
- County
- — inherits STATE
- City
- — inherits STATE
ZIP-level market 77026
- Home prices YoY
- 1.5%
- Rents YoY
- 3.1%
- Active inventory
- 449
- Price-to-rent
- 7.6×
Monthly cashflow live
- Estimated rent
- $2,191 high interval (Pro) →
- Mortgage (P&I)
- −$1,049
- Tax from tax record
- −$354 /mo · $4,250/yr
- Insurance
- −$83
- HOA
- −$0
- Lot rent
- −$0
- Vacancy / Maint / Mgmt
- −$460
- Net cashflow
- $244
Break-even live
Sensitivity live
| Price | -10% $357 | -5% $301 | +0% $244 | +5% $188 | +10% $131 |
|---|---|---|---|---|---|
| Rent | -10% $71 | -5% $158 | +0% $244 | +5% $331 | +10% $417 |
| Rate | -1.0pp $345 | -0.5pp $295 | base $244 | +0.5pp $192 | +1.0pp $140 |
UW: 25.0% down · 7.5% · 30yr · 1.5% tax · 5.0% vac · 8.0% maint · 8.0% mgmt
Financing live
Cash to close
- Down payment
- $50,000
- Closing costs
- $6,000
- Reserves months
- —
- Total cash needed
- —
Loan-product check · same deal, 3 products live
Conventional
25% down · 7.5% · 30yr
- Down + closing
- —
- Monthly P&I
- —
- Monthly cashflow
- —
- DSCR
- —
- Eligible?
- —
Personal DTI + credit; lowest rate.
DSCR
20% down · 8.5% · 30yr
- Down + closing
- —
- Monthly P&I
- —
- Monthly cashflow
- —
- DSCR
- —
- Eligible?
- —
No personal income docs; deal must DSCR.
Hard money
10% down · 12.0% · 12mo
- Down + closing
- —
- Monthly P&I
- —
- Monthly cashflow
- —
- DSCR
- —
- Eligible?
- —
Short-term bridge; refi at stabilization.
Rent comps 27 comps
| Address | Beds | Baths | Sqft | Rent | $/sqft | DOM | Units | Dist |
|---|---|---|---|---|---|---|---|---|
| 2706 Cochran St Houston, TX | 3.0 | 3.5 | 1791 | $2,700 | $1.51 | 22d | 1 | 0.72mi |
| 2013 Cochran St Houston, TX | 3.0 | 4.0 | 1888 | $2,600 | $1.38 | 0d | 1 | 0.88mi |
| 3300 Lyons Ave Unit 304 Houston, TX | 4.0 | 2.0 | 1393 | $1,460 | $1.05 | 46d | 1 | 0.91mi |
| 914 Bunton St Houston, TX | 3.0 | 2.0 | 1389 | $1,950 | $1.40 | 46d | 1 | 0.98mi |
| 1513 Cage St Houston, TX | 3.0 | 2.0 | 1467 | $1,550 | $1.06 | 46d | 1 | 0.99mi |
| 1307 Bayou St Unit B Houston, TX | 3.0 | 3.0 | 1814 | $2,400 | $1.32 | 10d | 1 | 1.04mi |
| 1303 Bayou St Unit C Houston, TX | 3.0 | 3.0 | 1869 | $3,200 | $1.71 | 46d | 1 | 1.05mi |
| 4509 Courtney St Houston, TX | 4.0 | 1.0 | 1456 | $1,150 | $0.79 | 24d | 1 | 1.17mi |
| 1524 Evelyn St Houston, TX | 3.0 | 2.5 | 1804 | $2,800 | $1.55 | 46d | 1 | 1.18mi |
| 1250 Leona St Houston, TX | 2.0 | 1.0–2.0 | 885 | $1,990 | $2.25 | 1d | 15 | 1.19mi |
| 2403 Everett St Unit A Houston, TX | 3.0 | 3.5 | 2093 | $2,800 | $1.34 | 46d | 1 | 1.19mi |
| 1039 Hillstar St Houston, TX | 3.0 | 2.5 | 1780 | $2,750 | $1.54 | 14d | 1 | 1.21mi |
| 4300 Lyons Ave Unit 304 Houston, TX | 4.0 | 2.0 | 1393 | $1,460 | $1.05 | 46d | 1 | 1.28mi |
| 2905 Baer St Unit 1047953P Houston, TX | 3.0 | 2.5 | 1991 | $2,922 | $1.47 | 1d | 1 | 1.32mi |
| 1625 N Main St Houston, TX | 3.0 | 1.0–3.0 | 994 | $2,354 | $2.37 | 0d | 40 | 1.35mi |
| 410 James St Unit 1031793P Houston, TX | 3.0 | 2.0 | 1593 | $5,668 | $3.56 | 1d | 1 | 1.36mi |
| 410 James St Houston, TX | 3.0 | 2.0 | 1602 | $6,750 | $4.21 | 46d | 1 | 1.36mi |
| 611 Sydnor St Houston, TX | 3.0 | 4.0 | 2157 | $2,400 | $1.11 | 46d | 1 | 1.37mi |
| 4712 Rawley St Unit a Houston, TX | 3.0 | 2.0 | 1501 | $2,070 | $1.38 | 23d | 1 | 1.42mi |
| 4712 Rawley St Unit B Houston, TX | 3.0 | 2.5 | 1501 | $2,045 | $1.36 | 23d | 1 | 1.42mi |
| 5124 Gold St Unit B Houston, TX | 3.0 | 2.5 | 1650 | $1,895 | $1.15 | 46d | 1 | 1.42mi |
| 3410 Baer St Houston, TX | 3.0 | 4.0 | 2040 | $3,500 | $1.72 | 46d | 1 | 1.43mi |
| 207 Carl St Houston, TX | 2.0 | 2.0 | 1230 | $2,250 | $1.83 | 46d | 1 | 1.45mi |
| 4706 Hershe St Houston, TX | 3.0 | 2.5 | 2283 | $3,300 | $1.45 | 46d | 1 | 1.45mi |
| 3419 Gillespie St Houston, TX | 3.0 | 3.5 | 2168 | $2,300 | $1.06 | 46d | 1 | 1.45mi |
| 4109 Hare St Unit A Houston, TX | 4.0 | 2.5 | 1913 | $6,950 | $3.63 | 46d | 1 | 1.47mi |
| 4109 Hare St Unit 1019559P Houston, TX | 4.0 | 2.5 | 1905 | $6,852 | $3.60 | 10d | 1 | 1.47mi |
Listing history 14 events
-
2026-06-21days on market $199,999 Active 342 DOM
-
2026-06-18days on market $199,999 Active 339 DOM
-
2026-06-17days on market $199,999 Active 338 DOM
-
2026-06-16days on market $199,999 Active 337 DOM
-
2026-06-15days on market $199,999 Active 336 DOM
-
2026-06-13days on market $199,999 Active 334 DOM
-
2026-06-10days on market $199,999 Active 330 DOM
-
2026-06-08days on market $199,999 Active 329 DOM
-
2026-06-07days on market $199,999 Active 328 DOM
-
2026-06-04days on market $199,999 Active 325 DOM
-
2026-06-01days on market $199,999 Active 322 DOM
-
2026-05-31days on market $199,999 Active 321 DOM
-
2025-07-14$199,999 Active 794-char remark
Show marketing remark (794 chars)
NICE BRICK HOME! Welcome to this charming brick home brimming with potential, situated on a spacious 5,950 sq. ft. lot in a tranquil North Houston neighborhood. With its vintage charm and ample space for renovation and updating, this property offers the perfect canvas for creating your dream home. Enjoy the peace and quiet of the neighborhood while still being just a short drive away from downtown Houston, where you can indulge in all the city has to offer. Don't miss out on the opportunity to make this delightful residence your own oasis in the heart of Houston. WE MAKE IT EASY TO OWN. This is a great opportunity! Don't wait, call us today to get more information on the owner's easy terms and smooth process that may be able to put the deed in your name and make this your dream home.
-
1988-01-02soldstatus
ⓘ Source: listings_history table (triggers on properties + properties_extension) + one-shot
backfill from property_details.listing_events for pre-trigger history.
Tax reassessment forecast TX · Resets to sale price
- Current annual tax
- $4,250 · $354/mo
- Projected year-2 tax
- $4,250 · $354/mo
- Expected delta
- $0/yr ($0/mo · 0.0%)
ⓘ Screening estimate from a state-policy table — verify with the county assessor before closing.
Climate risk First Street
- Flood 1/10 Low FEMA zone X (unshaded) · 0% chance over 30 yrs
- Wildfire 1/10 Low
- Heat 9/10 Extreme 7 d/yr ≥109°F today · 24 d/yr by 30 yrs out
- Wind 9/10 Extreme 99% chance of damaging wind over 30 yrs
- Air quality 3/10 Moderate 2 unhealthy d/yr today · 3 by 30 yrs out
Nearby sold comps map
Loading sold comps map…
Walkable amenities ~0.75 mi
Loading nearby amenities…
Taxation est. · year 1
- Rental income
- $26,288
- − Mortgage interest
- −$11,203
- − Property taxes
- −$4,250
- − Insurance
- −$1,000
- − Repairs & maintenance
- −$2,103
- − Management
- −$2,103
- − Depreciation
- −$5,818
- Taxable loss
- −$190
- Est. tax savings @ 24.0%
- +$46
- After-tax cash flow
- $2,977/yr
For passive investors: Depreciation is non-cash, so a rental often shows a tax loss while cash-flowing — sheltering income. Rental losses are passive: they offset passive income freely, and up to $25,000/yr can offset ordinary (W-2) income if you actively participate and your MAGI is under $100k (phasing out to $0 by $150k); unused losses carry forward. On sale, claimed depreciation is recaptured at up to 25%, and gains may owe capital-gains tax (a 1031 exchange can defer both). Figures are a year-1 estimate at your 24.0% rate — not tax advice; consult a CPA.
Schools (NCES district)
- District
- Houston ISD
- NCES district ID
- 4823640
- Math proficiency
- 27% ▼ -18.00%
- Reading proficiency
- 35% ▼ -6.00%
- Median HH income
- $46,054
- Composite
- 26.63/100
- National rank
- #7173
- State rank
- #593 of 826 in TX
Livability — Houston
- Score
- 74/100
- State rank
- #184
- US rank
- #4771
Category grades
Schools grade is shown separately in the Schools card above.
Census & demographics
- Census place
- Houston, TX
- County
- Harris County · 4,702,590 people
- City population
- 3,226,434
- Metro
- Houston-The Woodlands-Sugar Land, TX
- Population (ZIP)
- 21,981
- Household income
- $39,211
- Rent vs Own
- Severe rent burden
- 1531.0
Population outlook (Harris County) Hauer SSP2
- Today (2025)
- 5,571,493 people
- By 2030
- 6,089,821 · +9.3%
- By 2040
- 7,142,806 · +28.2%
- By 2050
- 8,185,864 · +46.9%
- By 2075
- 10,574,329 · +89.8%
- By 2100
- 12,109,958 · +117.4%
Race, ethnicity, and origin ACS 2023
- Neighborhood character
- Diverse neighborhood (Simpson 0.56)
- Race & ethnicity
- Black 49% Hispanic / Latino 44% Two or more races 18% White 5% Native American 1%
- Hispanic origin (detail)
- Mexican 34%
- Common ancestry
- Lithuanian 1%
- Foreign-born
- 15% · Canada
- Languages at home
- 61% English-only · Spanish 39%
Political lean MEDSL · Harris
- 2024 margin
- Lean D (+5.5) · D 52.0% · R 46.4% · Other 1.6%
- 2008→2024 swing
- +3.9pp toward D · 2008: 1.6pp · 2024: 5.5pp
- All cycles
- 2024: D+5.5 2020: D+13.3 2016: D+12.4 2012: D+0.1 2008: D+1.6
Not yet ingested
- Civics
- —
Market trends
- HPI YoY
- ▲ 3.89%
- Current HPI
- 267.5995
- Rent YoY
- ▲ 3.08%
- Metro
- Houston-The Woodlands-Sugar Land, TX
- State GDP YoY
- ▲ 3.95%
- F500 in state
- 110
Industry mix (Fortune 500 HQ in TX)
| Industry | F500 HQs | Revenue |
|---|---|---|
| Energy | 16 | $1,198B |
|
||
| Technology | 5 | $198B |
|
||
| Engineering / Construction | 4 | $72B |
|
||
| Energy Services | 3 | $60B |
|
||
| Utilities | 3 | $41B |
|
||
| Healthcare | 2 | $330B |
|
||
Price history
2 events — show timeline
- 2025-07-14 Listed $199,999 HARMLS
- 1988-01-02 Sold (Public Records) — Public Records
Property tax history
+7.7%/yrLatest (2025): $4,250 · +41.0% YoY. Source: county tax records.
Cash-flow waterfall
monthlySold comps — $/sqft
last 12 mo · ≤1 miLoading sold comps…