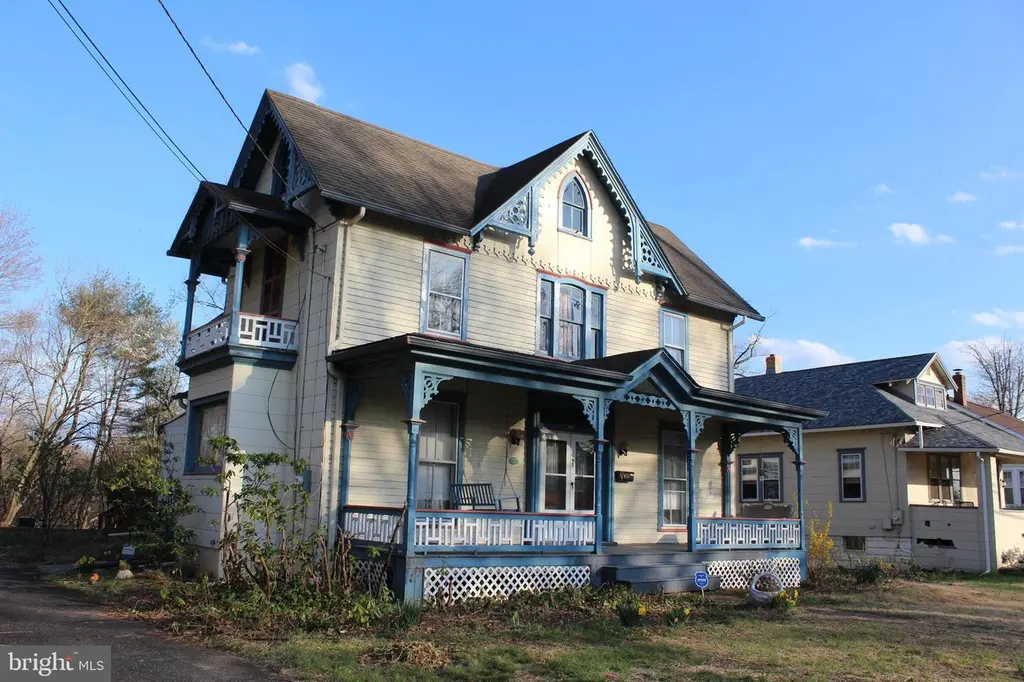
97 Madison Ave · Vincentown, NJ
Flood risk 1/10 · Minimal
- FEMA flood zone
- X (unshaded)
- Chance of flooding over 30 yrs
- 0.0%
- Est. flood insurance / yr
- $507 – $1,088
Fire risk 2/10 · Minimal
- Est. fire insurance / yr
- $526 – $976
Heat risk 6/10 · Moderate
- Hot days now (above 104°F)
- 7 days/yr
- Hot days in 30 yrs
- 15 days/yr
Wind risk 6/10 · Moderate
- Chance of severe wind over 30 yrs
- 47.0%
Air-quality risk 4/10 · Minor
- Unhealthy air days now
- 5 days/yr
- Unhealthy air days in 30 yrs
- 7 days/yr
Risk factors via First Street. Map © Google.
Why this score? — see what drove the C grade
The composite is a weighted blend of 9 inputs, each scored 0–100. Each bar is that input's sub-score; the figure is the points it added to the 100-point composite (weight × sub-score).
- Cash flow +20.3/30.0
- ARV discount +15.0/15.0
- DSCR +6.5/10.0
- 1% rule +6.2/10.0
- Schools +3.4/10.0
- Rent growth +2.9/5.0
- Livability +2.5/5.0
- Condition / age +2.5/5.0
- Appreciation +0.0/10.0
$399,000
🖨 Deal sheet 📄 Offer letter ✓ Due diligence
Listing remarks
Built in 1860 and officially recognized for its restoration by Mount Holly Historical, this distinctive home offers a rare chance to own a true piece of history—set on an exceptional 103x305 (. 72 acre) lot that is nearly impossible to replicate in today’s market. Inside, you’ll find 4 bedrooms and 2 full baths, anchored by an over-sized eat-in kitchen—a standout space featuring a wood-burning stove that creates warmth, character, and a natural gathering place. There is a 5th bedroom which is accessible from the back staircase that leads to and from the kitchen. This room was used as a "Maid" quarters when the home was initially built. Original windows and
Key facts
- 4 parking spots
- Built 1860
- Listed 59 days
Property features AI
Exterior
- Parking: Four total garage and parking spaces; Driveway with four spaces; Asphalt driveway
- Utilities: Public water; Public sewer; Utilities include above-ground services and other utilities
- Home design: Detached single-family home; Average condition; Fee simple ownership
- Construction: Foundation of block and brick/mortar; Above-grade structures; Below-grade structures; Year built per assessor
- Exterior features: Lot dimensions approximately 103' frontage; Not tidal waterfront
Interior
- Kitchen: Eat-in kitchen
- Bedrooms: Four bedrooms on the upper level; One bedroom on the main level
- Flooring: Carpet
- Bathrooms: Two full bathrooms (one on main level, one on upper level)
- Heating & cooling: Wood-burning stove; Radiator heat; Natural gas heating fuel; Natural gas hot water
- Interior features: Additional stairway; Carpeted areas; Eat-in kitchen; Wood-burning stove; Attic; Unfinished basement with interior access and a combination layout
- Laundry & utility: Laundry on the main floor
Neighborhood map
What this means for you Summary
Snapshot
- This is a 5-bed/2.0-bath single-family listed at $399k.
Deal economics
- At list price, monthly cash flow is $514 ($6k/yr) — positive.
- The deal already cash-flows at list — no discount required.
- Meets the 1% rule at list price ($4k rent vs $399k).
- Recommended offer: $387k (3.0% below list) — sets the bar for market timing.
- Cap rate 7.8% vs local median 4.5% in Vincentown — top-decile yield for the area; either an underpriced asset or a hidden risk that comps aren't pricing in. Stress-test before assuming the spread holds.
Location & tenants
- Location reads: area grade C — affects rentability + tenant quality, not the cash-flow math above.
- Rancocas Valley Regional High School District (suburban): math 29% / reading 49% proficiency, ranked #236 of 472 in NJ (top 50%) — families likely to look elsewhere, expect single-tenant / working-renter base with shorter leases.
- Zoned schools: Rancocas Valley Regional High School (math 29% / reading 49%, grade F, #197 of 399 statewide, top 51%, 1,981 students, 25% FRL).
- Market conditions: Rents rising (+1.4%/yr); 134 active listings in the ZIP; 3 comparable units currently listed for rent nearby; rentals at typical pace (median 17d on market — plan ~3-4 weeks tenant-placement turnaround); solid renter incomes; 2,161 units permitted in Burlington County in 2024 (988 in 5+ unit buildings).
- At $4,481/mo this rent would consume 49% of the median local household income ($109k/yr) (locally 562% of renters already pay >50% of income on rent) — very limited rent-growth headroom before tenants either downsize or default.
Forward outlook
- Local home prices are declining (-3.0%/yr); year-one equity from $3k of loan paydown is wiped out by about $12k of value loss. Plan a longer hold.
- Burlington County population projected to shrink 5% by 2050 — rents likely to lag national; underwrite the cash flow, not the appreciation.
Negotiation context
- It's been on market 60 days — a 3% lower offer ($387k) is reasonable based on typical stale-listing flexibility.
Risks & watch-outs
- Watch-outs: built in 1860 — expect roof / HVAC / electrical / plumbing capex.
- Climate carrying-cost: major wind risk, 47% chance of damaging wind over 30y; extreme-heat days projected 7→15/yr by 2055 (HVAC capex compounding) — expect insurance premiums to compound above CPI over the hold.
Questions for the listing agent
- It's been on market 60 days. Have you received any prior offers? Is the seller open to a 3% concession, seller financing, or rate buy-down credit?
- Built in 1860 — when were the roof, HVAC, electrical panel, plumbing, and water heater last replaced?
- Is there a deadline driving the sale (1031 exchange, divorce, estate, relocation)? That informs how much negotiation room exists.
- What's the average days-on-market for RENTAL listings here right now (not sales)? A rising rental-DOM trend means longer vacancies and softer asking-rent achievability than the comps imply.
- What's the recent tenant-quality profile in this submarket — average credit score on applications, eviction rate, late-payment / NSF rate, and stable-employment percentage? A property-management company in the area should have these aggregated.
- How much new for-sale + rental construction is in the pipeline within 1–3 miles? Heavy new supply typically softens prices + rents 12–24 months out; constrained supply supports both.
Investment metrics
- 1% rule
- 1.12% ✓
- Cap rate
- 7.84%
- Cash-on-cash
- 5.52%
- DSCR
- 1.25
- GRM
- 7.4
CMA / ARV
- ARV (on-the-fly)
- $525,280
- Comps found
- 8
Show comp detail 8 sales within ~0.75 mi
| Address | Dist | Beds/Ba | Sqft | Sold | Price | $/sf | Match |
|---|---|---|---|---|---|---|---|
| 220 Washington St | 0.23mi | 4/2.5 (-1) | 2,600 (-3%) | 18mo | $510,000 | $196 | 62 |
| 118 Mill St | 0.70mi | 4/2.5 (-1) | 2,741 (+2%) | 3mo | $390,000 | $142 | 54 |
| 29 Grant St | 0.60mi | 5/2.0 | 2,968 (+11%) | 3mo | $460,000 | $155 | 52 |
| 248 Randall Ave | 0.50mi | 4/2.5 (-1) | 2,576 (-4%) | 17mo | $520,000 | $202 | 49 |
| 37 Union St | 0.72mi | 6/2.5 (+1) | 2,774 (+4%) | 12mo | $570,000 | $205 | 44 |
| 14 Church St | 0.44mi | 6/1.5 (+1) | 2,897 (+8%) | 22mo | $564,525 | $195 | 41 |
| 38 Broad St | 0.74mi | 6/2.5 (+1) | 2,826 (+5%) | 17mo | $565,000 | $200 | 35 |
| 245 Harrison Ave | 0.57mi | 4/2.5 (-1) | 2,400 (-10%) | 21mo | $470,000 | $196 | 32 |
Match score weights: distance 35% · size 25% · config 20% · recency 20%. Top-matched comps best support the ARV.
Projected returns pro-forma
-3.0% appreciation · 1.42% rent growth · sell at horizon
- IRR
- -9.6%
- Equity multiple
- 0.65×
- Total profit
- $-38,718
- Equity at exit
- $59,492
- IRR
- -2.7%
- Equity multiple
- 0.83×
- Total profit
- $-18,520
- Equity at exit
- $34,498
Cash invested: $111,720 (down + closing). Projections, not guarantees.
Landlord ↔ Tenant lean methodology
- Overall (STATE)
- 21 Tenant-Leaning
- State New Jersey
- 21 Tenant-Leaning · D+6
- County
- — inherits STATE
- City
- — inherits STATE
ZIP-level market 08060
- Home prices YoY
- -34.5%
- Rents YoY
- 1.4%
- Active inventory
- 134
- Price-to-rent
- 7.4×
Monthly cashflow live
- Estimated rent
- $4,481 medium interval (Pro) →
- Mortgage (P&I)
- −$2,092
- Tax from tax record
- −$768 /mo · $9,215/yr
- Insurance
- −$166
- HOA
- −$0
- Vacancy / Maint / Mgmt
- −$941
- Net cashflow
- $514
Break-even live
UW: 25.0% down · 7.5% · 30yr · 1.5% tax · 5.0% vac · 8.0% maint · 8.0% mgmt
Financing live
Cash to close
- Down payment
- $99,750
- Closing costs
- $11,970
- Reserves months
- —
- Total cash needed
- —
Loan-product check · same deal, 3 products live
Conventional
25% down · 7.5% · 30yr
- Down + closing
- —
- Monthly P&I
- —
- Monthly cashflow
- —
- DSCR
- —
- Eligible?
- —
Personal DTI + credit; lowest rate.
DSCR
20% down · 8.5% · 30yr
- Down + closing
- —
- Monthly P&I
- —
- Monthly cashflow
- —
- DSCR
- —
- Eligible?
- —
No personal income docs; deal must DSCR.
Hard money
10% down · 12.0% · 12mo
- Down + closing
- —
- Monthly P&I
- —
- Monthly cashflow
- —
- DSCR
- —
- Eligible?
- —
Short-term bridge; refi at stabilization.
Rent comps 3 comps
| Address | Beds | Baths | Sqft | Rent | $/sqft | DOM | Units | Dist |
|---|---|---|---|---|---|---|---|---|
| 151 Rambling Rd Lumberton, NJ | 4.0 | 2.5 | 3000 | $5,495 | $1.83 | 17d | 1 | 0.80mi |
| 610 Ogden Dr Westampton, NJ | 4.0 | 2.0 | 2370 | $4,200 | $1.77 | 22d | 1 | 1.02mi |
| 501 Bloomfield Dr Westampton, NJ | 4.0 | 2.0 | 1975 | $4,950 | $2.51 | 1d | 1 | 1.27mi |
Listing history 16 events
-
2026-06-18days on market $399,000 Active 60 DOM
-
2026-06-17days on market $399,000 Active 59 DOM
-
2026-06-16days on market $399,000 Active 58 DOM
-
2026-06-15days on market $399,000 Active 57 DOM
-
2026-06-13days on market $399,000 Active 55 DOM
-
2026-06-13days on market $399,000 Active 54 DOM
-
2026-06-09days on market $399,000 Active 51 DOM
-
2026-06-08days on market $399,000 Active 50 DOM
-
2026-06-07days on market $399,000 Active 49 DOM
-
2026-06-04days on market $399,000 Active 46 DOM
-
2026-06-03days on market $399,000 Active 45 DOM
-
2026-06-02days on market $399,000 Active 44 DOM
-
2026-06-01days on market $399,000 Active 43 DOM
-
2026-05-31days on market $399,000 Active 42 DOM
-
2026-04-20$399,000 Active
-
2026-04-02historical $399,000
ⓘ Source: listings_history table (triggers on properties + properties_extension) + one-shot
backfill from property_details.listing_events for pre-trigger history.
Tax reassessment forecast NJ · Partial reset (capped growth)
- Current annual tax
- $9,215 · $768/mo
- Projected year-2 tax
- $9,575 · $798/mo
- Expected delta
- +$360/yr (+$30/mo · 3.9%)
ⓘ Screening estimate from a state-policy table — verify with the county assessor before closing.
Climate risk First Street
- Flood 1/10 Low FEMA zone X (unshaded) · 0% chance over 30 yrs
- Wildfire 2/10 Low
- Heat 6/10 Major 7 d/yr ≥104°F today · 15 d/yr by 30 yrs out
- Wind 6/10 Major 47% chance of damaging wind over 30 yrs
- Air quality 4/10 Moderate 5 unhealthy d/yr today · 7 by 30 yrs out
Nearby sold comps map
Loading sold comps map…
Walkable amenities ~0.75 mi
Loading nearby amenities…
Taxation est. · year 1
- Rental income
- $53,777
- − Mortgage interest
- −$22,350
- − Property taxes
- −$9,215
- − Insurance
- −$1,995
- − Repairs & maintenance
- −$4,302
- − Management
- −$4,302
- − Depreciation
- −$11,607
- Taxable income
- $5
- Est. tax owed @ 24.0%
- −$1
- After-tax cash flow
- $6,163/yr
For passive investors: Depreciation is non-cash, so a rental often shows a tax loss while cash-flowing — sheltering income. Rental losses are passive: they offset passive income freely, and up to $25,000/yr can offset ordinary (W-2) income if you actively participate and your MAGI is under $100k (phasing out to $0 by $150k); unused losses carry forward. On sale, claimed depreciation is recaptured at up to 25%, and gains may owe capital-gains tax (a 1031 exchange can defer both). Figures are a year-1 estimate at your 24.0% rate — not tax advice; consult a CPA.
Schools (NCES district)
- District
- Rancocas Valley Regional High School District
- NCES district ID
- 3413620
- Math proficiency
- 29% ▼ -18.00%
- Reading proficiency
- 49% ▼ -4.00%
- Median HH income
- $58,992
- Composite
- 34.45/100
- National rank
- #5195
- State rank
- #236 of 472 in NJ
Livability — Vincentown
No livability data for this city. (Only ~50 U.S. cities are tracked.)
Census & demographics
- County
- Burlington County · 323,710 people
- Metro
- Philadelphia-Camden-Wilmington, PA-NJ-DE-MD
- Population (ZIP)
- 25,835
- Household income
- $109,292
- Rent vs Own
- Severe rent burden
- 562.0
Population outlook (Burlington County) Hauer SSP2
- Today (2025)
- 453,425 people
- By 2030
- 452,359 · -0.2%
- By 2040
- 445,033 · -1.9%
- By 2050
- 431,760 · -4.8%
- By 2075
- 406,277 · -10.4%
- By 2100
- 364,732 · -19.6%
Race, ethnicity, and origin ACS 2023
- Neighborhood character
- Diverse neighborhood (Simpson 0.68)
- Race & ethnicity
- White 49% Black 25% Two or more races 15% Hispanic / Latino 13% Asian 4%
- Hispanic origin (detail)
- Mexican 2% Puerto Rican 7%
- Common ancestry
- Romanian 4% Lithuanian 2% Italian 1%
- Foreign-born
- 11% · Canada, Dominican Republic, China
- Languages at home
- 87% English-only · Spanish 7% Other Indo-European 2% French/Haitian/Cajun 1%
Political lean MEDSL · Burlington
- 2024 margin
- D (+16.6) · D 57.6% · R 41.0% · Other 1.3%
- 2008→2024 swing
- -2.0pp toward R · 2008: 18.6pp · 2024: 16.6pp
- All cycles
- 2024: D+16.6 2020: D+19.5 2016: D+14.8 2012: D+18.7 2008: D+18.6
Not yet ingested
- Civics
- —
Market trends
- HPI YoY
- ▼ -156.50%
- Current HPI
- 296.564
- Rent YoY
- ▲ 1.42%
- Metro
- Philadelphia-Camden-Wilmington, PA-NJ-DE-MD
- State GDP YoY
- ▲ 2.05%
- F500 in state
- 34
Industry mix (Fortune 500 HQ in NJ)
| Industry | F500 HQs | Revenue |
|---|---|---|
| Consumer Goods | 3 | $31B |
|
||
| Pharmaceuticals | 2 | $153B |
|
||
| Technology | 2 | $21B |
|
||
| Insurance | 2 | $20B |
|
||
| Healthcare | 2 | $19B |
|
||
| Financial Services | 1 | $70B |
|
||
Price history
+0.0% since first listed2 events — show timeline
- 2026-04-20 Listed $399,000 BRIGHT MLS
- 2026-04-02 Coming Soon $399,000 BRIGHT MLS
Property tax history
+1.5%/yrLatest (2025): $9,215 · +6.6% YoY. Source: county tax records.
Cash-flow waterfall
monthlySold comps — $/sqft
last 12 mo · ≤1 miLoading sold comps…