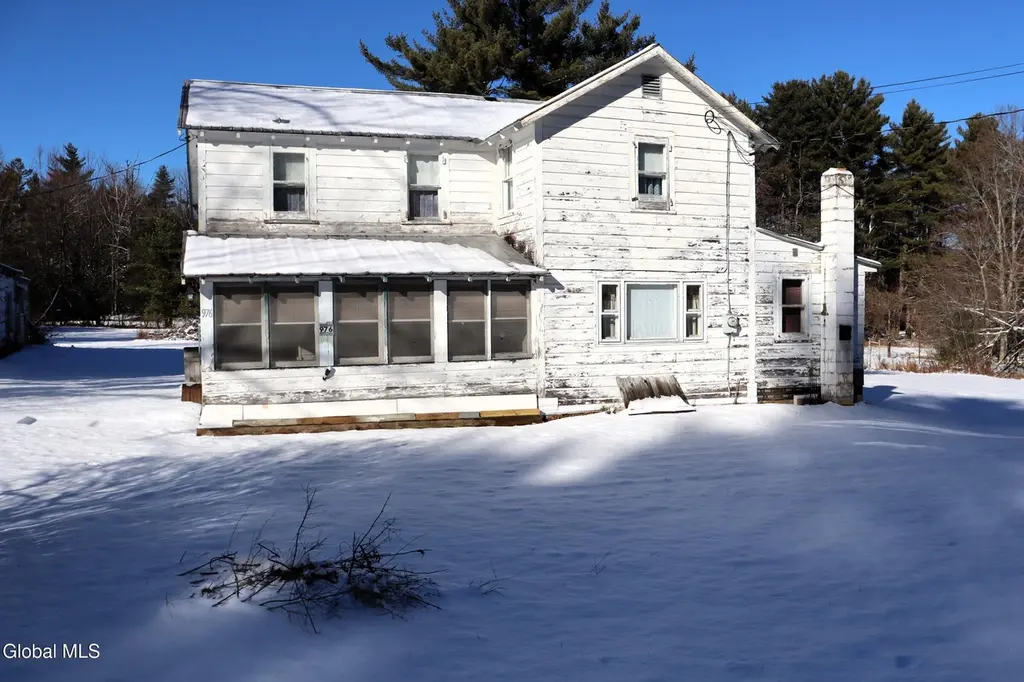
976 High St · Warrensburg, NY
Flood risk 1/10 · Minimal
- FEMA flood zone
- X
- Chance of flooding over 30 yrs
- 0.0%
- Est. flood insurance / yr
- $473 – $860
Fire risk 4/10 · Minor
- Est. fire insurance / yr
- $691 – $1,283
Heat risk 1/10 · Minimal
- Hot days now (above 89°F)
- 7 days/yr
- Hot days in 30 yrs
- 17 days/yr
Wind risk 2/10 · Minimal
- Chance of severe wind over 30 yrs
- 1.0%
Air-quality risk 1/10 · Minimal
- Unhealthy air days now
- 0 days/yr
- Unhealthy air days in 30 yrs
- 0 days/yr
Risk factors via First Street. Map © Google.
Why this score? — see what drove the C- grade
The composite is a weighted blend of 9 inputs, each scored 0–100. Each bar is that input's sub-score; the figure is the points it added to the 100-point composite (weight × sub-score).
- Cash flow +15.3/30.0
- Appreciation +8.6/10.0
- ARV discount +7.5/15.0
- DSCR +4.7/10.0
- 1% rule +4.5/10.0
- Schools +4.1/10.0
- Livability +3.2/5.0
- Rent growth +2.5/5.0
- Condition / age +2.5/5.0
$147,650
🖨 Deal sheet 📄 Offer letter ✓ Due diligence
Listing remarks MLS
Searching for a great income property or your own residence in the Adirondack region? This charming home is located on a quiet road with 1.1 acres so you can create your own rural tranquility. With some updates and personal touch, there's ample opportunity to create what you want. This is a solid home with plenty of storage inside and out. Oil tank, furnace and water heater are new. Flooring in most rooms is new as well. Enjoy the great outdoors with snowmobile trails in close proximity, and multiple options for skiing/ snowboarding around the area. Plenty of locations for fishing, hiking & swimming. Located less than a half hour from Lake George for shopping, dining & entertainment. Open House from 12-2 pm on Sunday 12/7/25.
Key facts
- New furnace
- Plenty of storage
- New flooring
Tags
Neighborhood map
What this means for you Summary
Snapshot
- This is a 3-bed/1.0-bath single-family listed at $148k.
Deal economics
- At list price, monthly cash flow is $54 ($653/yr) — positive.
- The deal already cash-flows at list — no discount required.
- To meet the 1% rule (rent ≥ 1% of price), the offer needs to be $141k (4.6% below list).
- Recommended offer: $130k (12.0% below list) — sets the bar for market timing.
- Cap rate 6.7% vs local median 2.6% in Warrensburg — top-decile yield for the area; either an underpriced asset or a hidden risk that comps aren't pricing in. Stress-test before assuming the spread holds.
Location & tenants
- Location reads 63/100 on livability (#823 in NY) — a middle-class / working-renter tenant base. Strengths: housing A+, cost of living B+, crime B; Watch: schools D, amenities F, commute F.
- Warrensburg Central School District (town): math 47% / reading 44% proficiency, ranked #552 of 755 in NY (top 73%) — families likely to look elsewhere, expect single-tenant / working-renter base with shorter leases.
- Market conditions: 4 active listings in the ZIP; 180 units permitted in Warren County in 2024 (40 in 5+ unit buildings).
Forward outlook
- In year one you build about $12k of equity ($1k loan paydown + $11k appreciation (7.1% local appreciation)).
- Warren County population projected at -19% by 2050 — secular population decline; favor cash flow + early exit over multi-decade hold.
- At projected returns (7.1% appreciation + 3.0% rent growth), your $41k cash investment doubles in ~4 years — after that, you're playing with house money.
- By year 4, paydown + projected appreciation supports a ~$40k cash-out refi (75% LTV) — recoverable capital for the next deal without selling this one.
Negotiation context
- It's been on market 183 days — a 12% lower offer ($130k) is reasonable based on typical stale-listing flexibility.
- 3 sale attempts since 3y ago with the ask held roughly flat each time — persistent listings suggest the price (not the market) is what's stuck; bring a comps-based counter.
Risks & watch-outs
- Watch-outs: built in 1949 — expect roof / HVAC / electrical / plumbing capex.
Questions for the listing agent
- It's been on market 183 days. Have you received any prior offers? Is the seller open to a 12% concession, seller financing, or rate buy-down credit?
- Built in 1949 — when were the roof, HVAC, electrical panel, plumbing, and water heater last replaced?
- Why hasn't it sold? Are there any deal-killer items the seller is aware of (foundation, flood, title, zoning, code violations)?
- Is there a deadline driving the sale (1031 exchange, divorce, estate, relocation)? That informs how much negotiation room exists.
- Schools are D-rated, which usually means shorter tenancies and higher turnover. Who's the typical renter profile here, and what's been the actual vacancy rate?
- What's the average days-on-market for RENTAL listings here right now (not sales)? A rising rental-DOM trend means longer vacancies and softer asking-rent achievability than the comps imply.
- What's the recent tenant-quality profile in this submarket — average credit score on applications, eviction rate, late-payment / NSF rate, and stable-employment percentage? A property-management company in the area should have these aggregated.
- How much new for-sale + rental construction is in the pipeline within 1–3 miles? Heavy new supply typically softens prices + rents 12–24 months out; constrained supply supports both.
Investment metrics
- 1% rule
- 0.95% ✗
- Cap rate
- 6.73%
- Cash-on-cash
- 1.58%
- DSCR
- 1.07
- GRM
- 8.7
CMA / ARV
- ARV (median comp)
- $330,609
- List price
- $147,650
- Delta
- -55.34%
- Verdict
- UNDERPRICED
- Comps
- 5 within 1.0 mi
Show comp detail 1 sale within ~0.75 mi
| Address | Dist | Beds/Ba | Sqft | Sold | Price | $/sf | Match |
|---|---|---|---|---|---|---|---|
| 1143 Dartmouth Rd | 0.75mi | 4/1.5 (+1) | 1,840 (+11%) | 11mo | $280,000 | $152 | 30 |
Match score weights: distance 35% · size 25% · config 20% · recency 20%. Top-matched comps best support the ARV.
Projected returns pro-forma
7.13% appreciation · 3.0% rent growth · sell at horizon
- IRR
- 19.3%
- Equity multiple
- 2.36×
- Total profit
- $56,278
- Equity at exit
- $103,606
- IRR
- 18.3%
- Equity multiple
- 4.89×
- Total profit
- $160,966
- Equity at exit
- $197,982
Cash invested: $41,342 (down + closing). Projections, not guarantees.
Landlord ↔ Tenant lean methodology
- Overall (STATE)
- 15 Strongly Tenant-Friendly
- State New York
- 15 Strongly Tenant-Friendly · D+10
- County
- — inherits STATE
- City
- — inherits STATE
ZIP-level market 12810
- Home prices YoY
- 2.5%
- Active inventory
- 4
- Price-to-rent
- 8.7×
Monthly cashflow live
- Estimated rent
- $1,409 medium interval (Pro) →
- Mortgage (P&I)
- −$774
- Tax from tax record
- −$223 /mo · $2,675/yr
- Insurance
- −$62
- HOA
- −$0
- Vacancy / Maint / Mgmt
- −$296
- Net cashflow
- $54
Break-even live
UW: 25.0% down · 7.5% · 30yr · 1.5% tax · 5.0% vac · 8.0% maint · 8.0% mgmt
Financing live
Cash to close
- Down payment
- $36,912
- Closing costs
- $4,430
- Reserves months
- —
- Total cash needed
- —
Loan-product check · same deal, 3 products live
Conventional
25% down · 7.5% · 30yr
- Down + closing
- —
- Monthly P&I
- —
- Monthly cashflow
- —
- DSCR
- —
- Eligible?
- —
Personal DTI + credit; lowest rate.
DSCR
20% down · 8.5% · 30yr
- Down + closing
- —
- Monthly P&I
- —
- Monthly cashflow
- —
- DSCR
- —
- Eligible?
- —
No personal income docs; deal must DSCR.
Hard money
10% down · 12.0% · 12mo
- Down + closing
- —
- Monthly P&I
- —
- Monthly cashflow
- —
- DSCR
- —
- Eligible?
- —
Short-term bridge; refi at stabilization.
Listing history 18 events
-
2026-06-18days on market $147,650 Active 183 DOM
-
2026-06-17days on market $147,650 Active 182 DOM
-
2026-06-16days on market $147,650 Active 181 DOM
-
2026-06-15days on market $147,650 Active 180 DOM
-
2026-06-13days on market $147,650 Active 178 DOM
-
2026-06-12days on market $147,650 Active 177 DOM
-
2026-06-09days on market $147,650 Active 174 DOM
-
2026-06-08days on market $147,650 Active 173 DOM
-
2026-06-07days on market $147,650 Active 172 DOM
-
2026-06-07statusdays on market $147,650 Active 171 DOM
-
2025-12-04$147,650 Active 744-char remark
Show marketing remark (744 chars)
Searching for a great income property or your own residence in the Adirondack region? This charming home is located on a quiet road with 1.1 acres so you can create your own rural tranquility. With some updates and personal touch, there's ample opportunity to create what you want. This is a solid home with plenty of storage inside and out. Oil tank, furnace and water heater are new. Flooring in most rooms is new as well. Enjoy the great outdoors with snowmobile trails in close proximity, and multiple options for skiing/ snowboarding around the area. Plenty of locations for fishing, hiking & swimming. Located less than a half hour from Lake George for shopping, dining & entertainment. Open House from 12-2 pm on Sunday 12/7/25.
-
2024-01-31price $145,900
-
2023-11-28price $149,900
-
2023-11-08status Active
-
2023-11-08price $150,000
-
2023-10-06historical Contingent
-
2023-10-06historical
-
2023-09-21$164,900 Active
ⓘ Source: listings_history table (triggers on properties + properties_extension) + one-shot
backfill from property_details.listing_events for pre-trigger history.
Tax reassessment forecast NY · Partial reset (capped growth)
- Current annual tax
- $2,675 · $223/mo
- Projected year-2 tax
- $2,675 · $223/mo
- Expected delta
- $0/yr ($0/mo · 0.0%)
ⓘ Screening estimate from a state-policy table — verify with the county assessor before closing.
Climate risk First Street
- Flood 1/10 Low FEMA zone X · 0% chance over 30 yrs
- Wildfire 4/10 Moderate
- Heat 1/10 Low 7 d/yr ≥89°F today · 17 d/yr by 30 yrs out
- Wind 2/10 Low 100% chance of damaging wind over 30 yrs
- Air quality 1/10 Low 0 unhealthy d/yr today · 0 by 30 yrs out
Nearby sold comps map
Loading sold comps map…
Walkable amenities ~0.75 mi
Loading nearby amenities…
Taxation est. · year 1
- Rental income
- $16,908
- − Mortgage interest
- −$8,271
- − Property taxes
- −$2,675
- − Insurance
- −$738
- − Repairs & maintenance
- −$1,353
- − Management
- −$1,353
- − Depreciation
- −$4,295
- Taxable loss
- −$1,777
- Est. tax savings @ 24.0%
- +$426
- After-tax cash flow
- $1,079/yr
For passive investors: Depreciation is non-cash, so a rental often shows a tax loss while cash-flowing — sheltering income. Rental losses are passive: they offset passive income freely, and up to $25,000/yr can offset ordinary (W-2) income if you actively participate and your MAGI is under $100k (phasing out to $0 by $150k); unused losses carry forward. On sale, claimed depreciation is recaptured at up to 25%, and gains may owe capital-gains tax (a 1031 exchange can defer both). Figures are a year-1 estimate at your 24.0% rate — not tax advice; consult a CPA.
Schools (NCES district)
- District
- Warrensburg Central School District
- NCES district ID
- 3629910
- Math proficiency
- 47% ▲ 4.00%
- Reading proficiency
- 44% ▼ -2.00%
- Median HH income
- $48,828
- Composite
- 41.15/100
- National rank
- #7424
- State rank
- #552 of 755 in NY
Livability — Warrensburg
- Score
- 63/100
- State rank
- #823
- US rank
- #15925
Category grades
Schools grade is shown separately in the Schools card above.
Census & demographics
- Population (ZIP)
- 488
Population outlook (Warren County) Hauer SSP2
- Today (2025)
- 62,372 people
- By 2030
- 60,491 · -3.0%
- By 2040
- 55,616 · -10.8%
- By 2050
- 50,437 · -19.1%
- By 2075
- 40,843 · -34.5%
- By 2100
- 31,159 · -50.0%
Race, ethnicity, and origin ACS 2023
- Neighborhood character
- Predominantly White (92%)
- Race & ethnicity
- White 92% Two or more races 7% Hispanic / Latino 3%
- Common ancestry
- Lithuanian 12% Romanian 5% Scotch-Irish 4%
- Foreign-born
- 0%
- Languages at home
- 98% English-only · Spanish 1% Russian/Polish/Slavic 1%
Political lean MEDSL · Warren
- 2024 margin
- Toss-up / Even · D 47.9% · R 52.1%
- 2008→2024 swing
- -6.9pp toward R · 2008: 2.6pp · 2024: -4.2pp
- All cycles
- 2024: R+4.2 2020: R+0.2 2016: R+10.6 2012: D+2.1 2008: D+2.6
Not yet ingested
- Civics
- —
Market trends
- HPI YoY
- ▲ 7.13%
- Current HPI
- 294.2107
- Rent YoY
- —
- Metro
- —
- State GDP YoY
- ▲ 2.60%
- F500 in state
- 92
Industry mix (Fortune 500 HQ in NY)
| Industry | F500 HQs | Revenue |
|---|---|---|
| Financial Services | 10 | $950B |
|
||
| Consumer Goods | 9 | $162B |
|
||
| Insurance | 4 | $225B |
|
||
| Telecommunications | 2 | $144B |
|
||
| Pharmaceuticals | 2 | $112B |
|
||
| Media / Entertainment | 2 | $69B |
|
||
Price history
-10.5% since first listed8 events — show timeline
- 2025-12-04 Listed $147,650 Global MLS
- 2024-01-31 Price Changed $145,900 Global MLS
- 2023-11-28 Price Changed $149,900 Global MLS
- 2023-11-08 Relisted — Global MLS
- 2023-11-08 Price Changed $150,000 Global MLS
- 2023-10-06 Contingent — Global MLS
- 2023-10-06 Listing Removed — Global MLS
- 2023-09-21 Listed $164,900 Global MLS
Property tax history
+3.2%/yrLatest (2025): $2,675 · +6.3% YoY. Source: county tax records.
Cash-flow waterfall
monthlySold comps — $/sqft
last 12 mo · ≤1 miLoading sold comps…