1671 Cass Lake Rd Unit C · Keego Harbor, MI
Flood risk 3/10 · Minor
- FEMA flood zone
- X (unshaded)
- Chance of flooding over 30 yrs
- 0.18%
- Est. flood insurance / yr
- $473 – $860
Fire risk 1/10 · Minimal
- Est. fire insurance / yr
- $784 – $1,456
Heat risk 2/10 · Minimal
- Hot days now (above 96°F)
- 7 days/yr
- Hot days in 30 yrs
- 15 days/yr
Wind risk 2/10 · Minimal
- Chance of severe wind over 30 yrs
- —
Air-quality risk 3/10 · Minor
- Unhealthy air days now
- 2 days/yr
- Unhealthy air days in 30 yrs
- 4 days/yr
Risk factors via First Street. Map © Google.
Why this score? — see what drove the D- grade
The composite is a weighted blend of 9 inputs, each scored 0–100. Each bar is that input's sub-score; the figure is the points it added to the 100-point composite (weight × sub-score).
- Cash flow +7.9/30.0
- ARV discount +7.5/15.0
- 1% rule +4.7/10.0
- Schools +4.5/10.0
- Livability +3.9/5.0
- Rent growth +2.5/5.0
- Condition / age +2.5/5.0
- DSCR +2.0/10.0
- Appreciation +0.0/10.0
$119,900
🖨 Deal sheet (PDF) 📄 Offer letter ✓ Due diligence
Listing remarks MLS
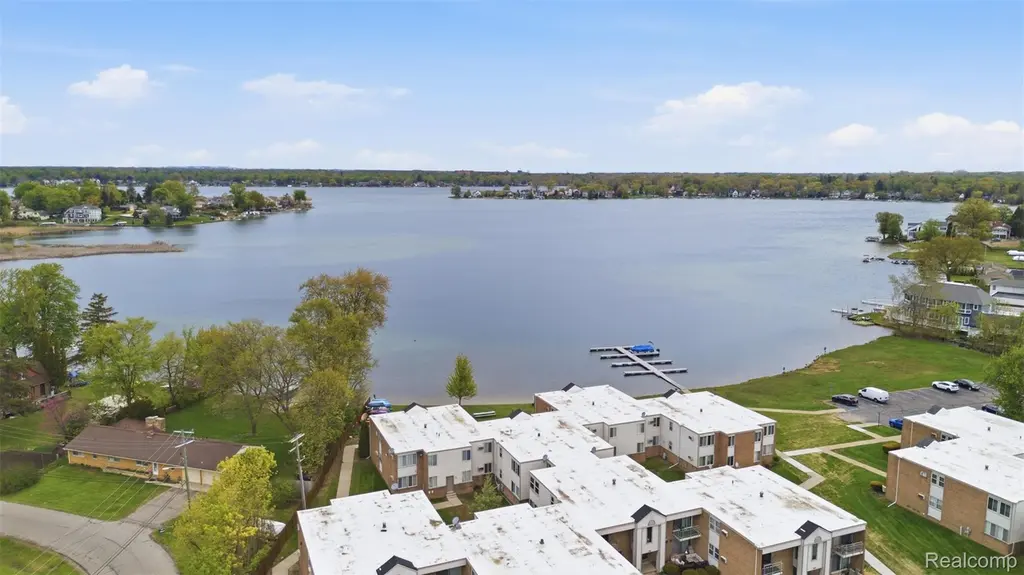
Affordable lake living! Charming 1-bedroom, 1-bath condo with private sandy beach access to beautiful Sylvan Lake and lake privileges on Cass Lake. Enjoy summer days at the beach, boating, and all-sports lake recreation. Great opportunity to own in a desirable lake community with endless potential. Sold AS-IS. Buyer and/or Buyer's Agent to verify all information. Seller will make no repairs. Seller's representative has limited knowledge of the property. Non-warrantable condo; specific financing required.
Key facts
- Lake privileges
- $295 HOA
- Built 1966
Tags
Property features AI
Finance
- HOA & community: Homeowners association with monthly fee of $295; HOA covers structure maintenance, sewer, snow removal, trash and water
Exterior
- Parking: No garage
- Utilities: Public water; Public sewer
- Home design: Condominium; Single-story
- Construction: Brick construction; Slab foundation; Built as a condominium (year built not provided)
- Exterior features: Beach access and lake privileges to Sylvan Lake/Cass Lake; Paved road access; Pets allowed
Interior
- Bathrooms: One full bathroom
- Heating & cooling: Baseboard heating; Hot water heating; Natural gas supply; No cooling
- Interior features: Ground-level entry; One total room
Neighborhood map
What this means for you Summary
Snapshot
- This is a 1-bed/1.0-bath condo listed at $120k.
Deal economics
- At list price, monthly cash flow is $-128 ($-2k/yr) — negative.
- To cash-flow at today's rent, offer at most $97k (18.9% below list).
- To meet the 1% rule (rent ≥ 1% of price), the offer needs to be $117k (2.7% below list).
- Recommended offer: $97k (18.9% below list) — sets the bar for cash-flow.
- Cap rate 5.0% vs local median 3.8% in Keego Harbor — top-decile yield for the area; either an underpriced asset or a hidden risk that comps aren't pricing in. Stress-test before assuming the spread holds.
Location & tenants
- Location reads 78/100 on livability (#110 in MI, #2,643 nationally) — a middle-class / working-renter tenant base. Strengths: crime A+, cost of living A+, housing A+; Watch: amenities D-, commute F.
- West Bloomfield School District (suburban): math 42% / reading 55% proficiency, ranked #83 of 540 in MI (top 15%) — families likely to look elsewhere, expect single-tenant / working-renter base with shorter leases.
- Zoned schools: Roosevelt Elementary School (math 48% / reading 61%, grade C, #276 of 1,397 statewide, top 22%, 356 students, 49% FRL); West Bloomfield Middle School (math 46% / reading 55%, grade C, #110 of 493 statewide, top 23%, 941 students, 42% FRL); West Bloomfield High School (math 40% / reading 61%, grade D+, #146 of 713 statewide, top 21%, 1,652 students, 34% FRL) — zoned schools average 42% FRL vs 23% district-wide (19 pts higher); higher-poverty schools than district average — tighter screening recommended.
- Market conditions: 26 active listings in the ZIP; 3 comparable units currently listed for rent nearby; rentals lingering (median 46d on market — plan ~5-8 weeks vacancy on turnover, expect pricing pressure); 67% of comp listings sitting > 30 days — soft ceiling on asking rent; 2,614 units permitted in Oakland County in 2024 (721 in 5+ unit buildings).
Forward outlook
- Local home prices are declining (-3.0%/yr); year-one equity from $829 of loan paydown is wiped out by about $4k of value loss. Plan a longer hold.
- Oakland County population projected at +10% by 2050 — modest demand growth; plan on rents tracking national, not racing it.
Negotiation context
- It's been on market 19 days — a 2% lower offer ($118k) is reasonable based on typical stale-listing flexibility.
- 3 sale attempts since 23y ago with the ask held roughly flat each time — persistent listings suggest the price (not the market) is what's stuck; bring a comps-based counter.
Risks & watch-outs
- Watch-outs: HOA is 25% of rent.
Questions for the listing agent
- What do current leases actually rent for vs. the listed asking? Can we see a recent rent roll and the last 12 months of T-12 income?
- Built in 1966 — when were the roof, HVAC, electrical panel, plumbing, and water heater last replaced?
- What does the HOA fee cover, when was the last increase, and are there any pending special assessments or reserve-fund shortfalls?
- Any open or pending special assessments — roof, HVAC, plumbing, elevator, façade? What's the per-unit balance and payoff schedule, and is the seller paying it off at close or rolling it to the buyer?
- Is there a deadline driving the sale (1031 exchange, divorce, estate, relocation)? That informs how much negotiation room exists.
- The area grade is low — what's the realistic commute time and amenity access for the typical tenant pool here? Any planned neighborhood developments (good or bad) we should know about?
- What's the average days-on-market for RENTAL listings here right now (not sales)? A rising rental-DOM trend means longer vacancies and softer asking-rent achievability than the comps imply.
- What's the recent tenant-quality profile in this submarket — average credit score on applications, eviction rate, late-payment / NSF rate, and stable-employment percentage? A property-management company in the area should have these aggregated.
- How much new apartment / multifamily construction is in the pipeline within 1–3 miles? Heavy new supply (>2% of stock underway) typically softens rents 12–24 months out; light construction supports rent growth.
Investment metrics
- 1% rule
- 0.97% ✗
- Cap rate
- 5.01%
- Cash-on-cash
- -4.57%
- DSCR
- 0.80
- GRM
- 8.6
CMA / ARV
No comps found within radius.
Projected returns pro-forma
-3.0% appreciation · 3.0% rent growth · sell at horizon
- IRR
- -23.9%
- Equity multiple
- 0.18×
- Total profit
- $-27,427
- Equity at exit
- $17,877
- IRR
- -18.5%
- Equity multiple
- -0.01×
- Total profit
- $-33,754
- Equity at exit
- $10,367
Cash invested: $33,572 (down + closing). Projections, not guarantees.
Landlord ↔ Tenant lean methodology
- Overall (STATE)
- 62 Landlord-Friendly
- State Michigan
- 62 Landlord-Friendly · EVEN
- County
- — inherits STATE
- City
- — inherits STATE
ZIP-level market 48320
- Active inventory
- 26
- Price-to-rent
- 8.6×
Monthly cashflow live
- Estimated rent
- $1,167 medium interval (Pro) →
- Mortgage (P&I)
- −$629
- Tax from tax record
- −$76 /mo · $916/yr
- Insurance
- −$50
- HOA
- −$295
- Vacancy / Maint / Mgmt
- −$245
- Net cashflow
- $-128
Break-even live
Sensitivity live
| Price | -10% $-60 | -5% $-94 | +0% $-128 | +5% $-162 | +10% $-196 |
|---|---|---|---|---|---|
| Rent | -10% $-220 | -5% $-174 | +0% $-128 | +5% $-82 | +10% $-36 |
| Rate | -1.0pp $-68 | -0.5pp $-97 | base $-128 | +0.5pp $-159 | +1.0pp $-191 |
UW: 25.0% down · 7.5% · 30yr · 1.5% tax · 5.0% vac · 8.0% maint · 8.0% mgmt
Financing live
Cash to close
- Down payment
- $29,975
- Closing costs
- $3,597
- Reserves months
- —
- Total cash needed
- —
Loan-product check · same deal, 3 products live
Conventional
25% down · 7.5% · 30yr
- Down + closing
- —
- Monthly P&I
- —
- Monthly cashflow
- —
- DSCR
- —
- Eligible?
- —
Personal DTI + credit; lowest rate.
DSCR
20% down · 8.5% · 30yr
- Down + closing
- —
- Monthly P&I
- —
- Monthly cashflow
- —
- DSCR
- —
- Eligible?
- —
No personal income docs; deal must DSCR.
Hard money
10% down · 12.0% · 12mo
- Down + closing
- —
- Monthly P&I
- —
- Monthly cashflow
- —
- DSCR
- —
- Eligible?
- —
Short-term bridge; refi at stabilization.
Rent comps 3 comps
| Address | Beds | Baths | Sqft | Rent | $/sqft | DOM | Units | Dist |
|---|---|---|---|---|---|---|---|---|
| 1671 Cass Lake Rd Keego Harbor, MI | 1.0 | 1.0 | 743 | $1,200 | $1.62 | 45d | 1 | 0.02mi |
| 3530 Denise Ct Waterford Twp, MI | 1.0–2.0 | 1.0–1.5 | 890 | $1,095 | $1.23 | 0d | 15 | 0.76mi |
| 311 S Telegraph Rd Pontiac, MI | 1.0–2.0 | 1.0 | 732 | $800 | $1.09 | 45d | 1 | 1.46mi |
HOA detail condo
- Monthly dues
- $295 · $3,540/yr
- Assessments
- None detected in remarks — confirm with the listing agent.
Listing history 13 events
-
2026-06-04status $119,900 Pending 19 DOM
-
2026-06-03days on market $119,900 Active Under Contract 19 DOM
Show marketing remark (509 chars)
Affordable lake living! Charming 1-bedroom, 1-bath condo with private sandy beach access to beautiful Sylvan Lake and lake privileges on Cass Lake. Enjoy summer days at the beach, boating, and all-sports lake recreation. Great opportunity to own in a desirable lake community with endless potential. Sold AS-IS. Buyer and/or Buyer's Agent to verify all information. Seller will make no repairs. Seller's representative has limited knowledge of the property. Non-warrantable condo; specific financing required.
-
2026-06-02days on market $119,900 Active Under Contract 18 DOM
-
2026-06-01days on market $119,900 Active Under Contract 17 DOM
-
2026-05-31days on market $119,900 Active Under Contract 16 DOM
-
2026-05-15$119,900 Active 521-char remark
Show marketing remark (509 chars)
Affordable lake living! Charming 1-bedroom, 1-bath condo with private sandy beach access to beautiful Sylvan Lake and lake privileges on Cass Lake. Enjoy summer days at the beach, boating, and all-sports lake recreation. Great opportunity to own in a desirable lake community with endless potential. Sold AS-IS. Buyer and/or Buyer's Agent to verify all information. Seller will make no repairs. Seller's representative has limited knowledge of the property. Non-warrantable condo; specific financing required.
-
2026-05-15$119,900 Active 509-char remark
Show marketing remark (509 chars)
Affordable lake living! Charming 1-bedroom, 1-bath condo with private sandy beach access to beautiful Sylvan Lake and lake privileges on Cass Lake. Enjoy summer days at the beach, boating, and all-sports lake recreation. Great opportunity to own in a desirable lake community with endless potential. Sold AS-IS. Buyer and/or Buyer's Agent to verify all information. Seller will make no repairs. Seller's representative has limited knowledge of the property. Non-warrantable condo; specific financing required.
-
2006-08-03soldstatus $105,000
-
2004-12-13soldstatus $110,000
-
2003-07-06historical
-
2003-01-06$113,500
-
2000-09-15soldstatus $93,000
-
1996-08-14soldstatus $49,990
ⓘ Source: listings_history table (triggers on properties + properties_extension) + one-shot
backfill from property_details.listing_events for pre-trigger history.
Tax reassessment forecast MI · Partial reset (capped growth)
- Current annual tax
- $916 · $76/mo
- Projected year-2 tax
- $1,381 · $115/mo
- Expected delta
- +$465/yr (+$39/mo · 50.8%)
ⓘ Screening estimate from a state-policy table — verify with the county assessor before closing.
Climate risk First Street
- Flood 3/10 Moderate FEMA zone X (unshaded) · 18% chance over 30 yrs
- Wildfire 1/10 Low
- Heat 2/10 Low 7 d/yr ≥96°F today · 15 d/yr by 30 yrs out
- Wind 2/10 Low
- Air quality 3/10 Moderate 2 unhealthy d/yr today · 4 by 30 yrs out
Nearby sold comps map
Loading sold comps map…
Walkable amenities ~0.75 mi
Loading nearby amenities…
Taxation est. · year 1
- Rental income
- $14,007
- − Mortgage interest
- −$6,716
- − Property taxes
- −$916
- − Insurance
- −$600
- − Repairs & maintenance
- −$1,121
- − Management
- −$1,121
- − HOA
- −$3,540
- − Depreciation
- −$3,488
- Taxable loss
- −$3,495
- Est. tax savings @ 24.0%
- +$839
- After-tax cash flow
- $-697/yr
For passive investors: Depreciation is non-cash, so a rental often shows a tax loss while cash-flowing — sheltering income. Rental losses are passive: they offset passive income freely, and up to $25,000/yr can offset ordinary (W-2) income if you actively participate and your MAGI is under $100k (phasing out to $0 by $150k); unused losses carry forward. On sale, claimed depreciation is recaptured at up to 25%, and gains may owe capital-gains tax (a 1031 exchange can defer both). Figures are a year-1 estimate at your 24.0% rate — not tax advice; consult a CPA.
Schools (NCES district)
- District
- West Bloomfield School District
- NCES district ID
- 2635820
- Math proficiency
- 42% ▼ -6.00%
- Reading proficiency
- 55% ▼ -2.00%
- Median HH income
- $89,668
- Composite
- 45.28/100
- National rank
- #2653
- State rank
- #83 of 540 in MI
Livability — Keego Harbor
- Score
- 78/100
- State rank
- #110
- US rank
- #2643
Category grades
Schools grade is shown separately in the Schools card above.
Census & demographics
- Census place
- Keego Harbor, MI
- Population (ZIP)
- 4,257
Population outlook (Oakland County) Hauer SSP2
- Today (2025)
- 1,335,747 people
- By 2030
- 1,375,100 · +2.9%
- By 2040
- 1,435,385 · +7.5%
- By 2050
- 1,469,250 · +10.0%
- By 2075
- 1,531,946 · +14.7%
- By 2100
- 1,450,485 · +8.6%
Race, ethnicity, and origin ACS 2023
- Neighborhood character
- Predominantly White (84%)
- Race & ethnicity
- White 84% Two or more races 7% Hispanic / Latino 5% Black 5% Asian 1%
- Hispanic origin (detail)
- Mexican 3%
- Common ancestry
- Romanian 9% Scotch-Irish 3% Iranian 2%
- Foreign-born
- 9% · Canada
- Languages at home
- 89% English-only · Other Indo-European 3% Spanish 2% Arabic 2%
Political lean MEDSL · Oakland
- 2024 margin
- D (+10.6) · D 54.4% · R 43.8% · Other 1.9%
- 2008→2024 swing
- -3.9pp toward R · 2008: 14.5pp · 2024: 10.6pp
- All cycles
- 2024: D+10.6 2020: D+14.1 2016: D+8.1 2012: D+8.1 2008: D+14.5
Not yet ingested
- Civics
- —
Market trends
- HPI YoY
- ▼ -177.64%
- Current HPI
- 201.4886
- Rent YoY
- —
- Metro
- —
- State GDP YoY
- ▲ 1.37%
- F500 in state
- 28
Industry mix (Fortune 500 HQ in MI)
| Industry | F500 HQs | Revenue |
|---|---|---|
| Automotive Parts | 3 | $48B |
|
||
| Automotive | 2 | $372B |
|
||
| Chemicals | 1 | $45B |
|
||
| Automotive Retail | 1 | $29B |
|
||
| Healthcare / Medical Devices | 1 | $23B |
|
||
| Automotive Technology | 1 | $20B |
|
||
Price history
+120.0% since first listed14 events — show timeline
- 2026-06-10 Sold (MLS) $110,000 REALCOMP
- 2026-06-10 Sold (MLS) $110,000 MiRealSource-MiMLS
- 2026-06-03 Pending — REALCOMP
- 2026-06-03 Pending — MiRealSource-MiMLS
- 2026-05-28 Contingent — MiRealSource-MiMLS
- 2026-05-28 Contingent — REALCOMP
- 2026-05-15 Listed $119,900 REALCOMP
- 2026-05-15 Listed $119,900 MiRealSource-MiMLS
- 2006-08-03 Sold (Public Records) $105,000 Public Records
- 2004-12-13 Sold (Public Records) $110,000 Public Records
- 2003-07-06 Listing Removed — REALCOMP
- 2003-01-06 Listed $113,500 REALCOMP
- 2000-09-15 Sold (Public Records) $93,000 Public Records
- 1996-08-14 Sold (Public Records) $49,990 Public Records
Property tax history
+2.2%/yrLatest (2025): $916 · +2.3% YoY. Source: county tax records.
Cash-flow waterfall
monthlySold comps — $/sqft
last 12 mo · ≤1 miLoading sold comps…