 🌊 Lakefront
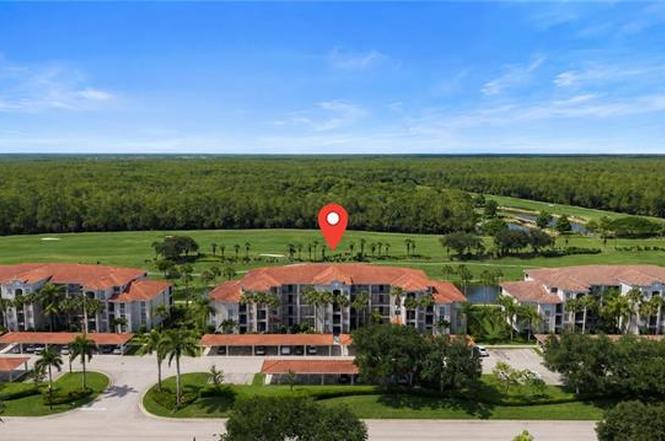
10341 Heritage Bay Blvd #1915 · Heritage Bay, FL
Flood risk 1/10 · Minimal
- FEMA flood zone
- AH
- Chance of flooding over 30 yrs
- 0.0%
- Est. flood insurance / yr
- $1,142 – $2,507
Fire risk 4/10 · Minor
- Est. fire insurance / yr
- $947 – $1,759
Heat risk 10/10 · Severe
- Hot days now (above 108°F)
- 7 days/yr
- Hot days in 30 yrs
- 32 days/yr
Wind risk 10/10 · Severe
- Chance of severe wind over 30 yrs
- 99.0%
Air-quality risk 2/10 · Minimal
- Unhealthy air days now
- 2 days/yr
- Unhealthy air days in 30 yrs
- 2 days/yr
Risk factors via First Street. Map © Google.
Why this score? — see what drove the C+ grade
The composite is a weighted blend of 9 inputs, each scored 0–100. Each bar is that input's sub-score; the figure is the points it added to the 100-point composite (weight × sub-score).
- Cash flow +25.1/30.0
- 1% rule +10.0/10.0
- DSCR +8.2/10.0
- ARV discount +7.5/15.0
- Schools +5.0/10.0
- Livability +2.5/5.0
- Condition / age +2.5/5.0
- Rent growth +2.1/5.0
- Appreciation +0.0/10.0
$307,500
🖨 Deal sheet 📄 Offer letter ✓ Due diligence
Listing remarks
With a tremendous view of water, multiple golf holes, and nature preserve, this Ashbury model condo will be a perfect golf getaway for you and/or your loved ones! FULL golf membership is included with purchase, and this condo is fully TURNKEY, move-in ready as well. Just bring your golf clubs and swim trunks! The Ashbury is a traditional 2 bed, 2 bath design where you will wake up to the golf, water, and preserve view through your bedroom window every morning. Other features include an outside storage locker, hurricane IMPACT windows and sliders, and a screened front entry. Heritage Bay is the absolute best value in Southwest Florida with 27 holes of championship golf & world class, r
Key facts
- Heated spa
- Resort style pool
- Screened front entry
Tags
Property features AI
Finance
- Other: Property located in the Heritage Bay development, Terrace sub-condo; Part of a large complex with many units and building-level units
- Financial info: Total annual recurring fees reported; One-time fees reported
- HOA & community: Mandatory HOA; Master HOA fee paid annually; Quarterly condo fee; HOA maintains cable, golf course, internet/WiFi, reserves, security and water; Condo-managed association; Community amenities include clubhouse, community spa/hot tub, exercise room, extra storage, golf course, pickleball, putting green, restaurant, sauna, tennis courts, bike storage; Community type: gated, golf course, tennis; golf bundled
Exterior
- Parking: 1 assigned covered parking; Guest parking available; Detached 1-car carport
- Security: Gated community with guard at gate and patrolled security
- Utilities: Central water; Central sewer; Cable available
- Home design: Residential mid-rise (4-7 stories); Built in 2010; Stucco exterior; Rear exposure faces north
- Construction: Concrete block construction; Tile roof; Impact resistant windows and doors; Single-hung windows
- Exterior features: Storage; Golf course lot description; Golf, lake, pond and preserve views; Central irrigation
Interior
- Kitchen: Dishwasher; Disposal; Microwave; Range; Refrigerator/Icemaker; Pantry; Breakfast bar; Eat-in kitchen; Dining open to living area
- Bedrooms: 2 bedrooms
- Flooring: Carpet; Tile
- Bathrooms: 2 full bathrooms; Master bathroom with shower only
- Heating & cooling: Central electric heating; Central electric cooling
- Interior features: Pantry; Screened lanai/porch; Turnkey furnished; Great room floor plan; Common elevator
- Laundry & utility: Washer; Dryer
Neighborhood map
What this means for you Summary
Snapshot
- This is a 2-bed/2.0-bath condo listed at $308k.
Deal economics
- At list price, monthly cash flow is $531 ($6k/yr) — positive.
- The deal already cash-flows at list — no discount required.
- Meets the 1% rule at list price ($5k rent vs $308k).
Location & tenants
- Location reads: area grade C — affects rentability + tenant quality, not the cash-flow math above.
- Collier (suburban): math 60% / reading 56% proficiency, ranked #16 of 73 in FL (top 22%) — acceptable for families but not a draw, mixed tenant base, ~2y average lease.
- Zoned schools: Corkscrew Elementary School (math 76% / reading 73%, grade A, #230 of 2,144 statewide, top 12%, 863 students, 35% FRL); Palmetto Ridge High School (math 43% / reading 51%, grade D-, #207 of 667 statewide, top 32%, 2,347 students, 38% FRL) — zoned schools average 37% FRL vs 55% district-wide (18 pts lower); this property's tenant base skews higher-income than the district average.
- Market conditions: Rents soft (-1.6%/yr); 1124 active listings in the ZIP; 17 comparable units currently listed for rent nearby; rentals at typical pace (median 24d on market — plan ~3-4 weeks tenant-placement turnaround); solid renter incomes; 3,520 units permitted in Collier County in 2024 (959 in 5+ unit buildings).
- At $5,055/mo this rent would consume 65% of the median local household income ($94k/yr) (locally 409% of renters already pay >50% of income on rent) — very limited rent-growth headroom before tenants either downsize or default.
Forward outlook
- Local home prices are declining (-3.0%/yr); year-one equity from $2k of loan paydown is wiped out by about $9k of value loss. Plan a longer hold.
- Collier County population projected at +30% by 2050 — long-run rental-demand tailwind backs the buy-and-hold thesis.
Negotiation context
- Only 4 days on market — expect competitive offers; lowballing is unlikely to land.
- 3 sale attempts since 15y ago with the ask held roughly flat each time — persistent listings suggest the price (not the market) is what's stuck; bring a comps-based counter.
Risks & watch-outs
- Watch-outs: flood insurance adds $152/mo; HOA is 25% of rent.
- Climate carrying-cost: in FEMA flood zone AH (mandatory federal flood insurance); severe wind risk, 99% chance of damaging wind over 30y; extreme-heat days projected 7→32/yr by 2055 (HVAC capex compounding) — expect insurance premiums to compound above CPI over the hold.
Questions for the listing agent
- What's the actual annual flood-insurance premium (NFIP or private), and is the property in a SFHA with mandatory coverage?
- What does the HOA fee cover, when was the last increase, and are there any pending special assessments or reserve-fund shortfalls?
- Any open or pending special assessments — roof, HVAC, plumbing, elevator, façade? What's the per-unit balance and payoff schedule, and is the seller paying it off at close or rolling it to the buyer?
- Is there a deadline driving the sale (1031 exchange, divorce, estate, relocation)? That informs how much negotiation room exists.
- This sits on a lake — are riparian / water-frontage rights deeded with the parcel? Any dock permits, shoreline easements, or HOA water-use restrictions?
- What's the documented flood / surge / shoreline-erosion history here (FEMA AND non-FEMA — e.g., storm surge, creek backup, septic-field saturation)?
- Any water-quality or seasonal algae-bloom issues that affect tenant satisfaction or short-term-rental demand?
- What's the average days-on-market for RENTAL listings here right now (not sales)? A rising rental-DOM trend means longer vacancies and softer asking-rent achievability than the comps imply.
- What's the recent tenant-quality profile in this submarket — average credit score on applications, eviction rate, late-payment / NSF rate, and stable-employment percentage? A property-management company in the area should have these aggregated.
- How much new apartment / multifamily construction is in the pipeline within 1–3 miles? Heavy new supply (>2% of stock underway) typically softens rents 12–24 months out; light construction supports rent growth.
Investment metrics
- 1% rule
- 1.64% ✓
- Cap rate
- 8.96%
- Cash-on-cash
- 9.52%
- DSCR
- 1.42
- GRM
- 5.1
CMA / ARV
No comps found within radius.
Projected returns pro-forma
-3.0% appreciation · 0.0% rent growth · sell at horizon
- IRR
- -10.0%
- Equity multiple
- 0.65×
- Total profit
- $-29,931
- Equity at exit
- $45,849
- IRR
- -8.5%
- Equity multiple
- 0.58×
- Total profit
- $-36,128
- Equity at exit
- $26,587
Cash invested: $86,100 (down + closing). Projections, not guarantees.
Landlord ↔ Tenant lean methodology
- Overall (STATE)
- 87 Strongly Landlord-Friendly
- State Florida
- 87 Strongly Landlord-Friendly · R+3
- County
- — inherits STATE
- City
- — inherits STATE
ZIP-level market 34120
- Rents YoY
- -1.6%
- Active inventory
- 1124
- Price-to-rent
- 5.1×
Monthly cashflow live
- Estimated rent
- $5,055 high interval (Pro) →
- Mortgage (P&I)
- −$1,613
- Tax from tax record
- −$319 /mo · $3,829/yr
- Insurance
- −$128
- Flood insurance flood zone
- −$152 /mo · $1,824/yr
- HOA
- −$1,251
- Vacancy / Maint / Mgmt
- −$1,062
- Net cashflow
- $531
Break-even live
UW: 25.0% down · 7.5% · 30yr · 1.5% tax · 5.0% vac · 8.0% maint · 8.0% mgmt
Financing live
Cash to close
- Down payment
- $76,875
- Closing costs
- $9,225
- Reserves months
- —
- Total cash needed
- —
Loan-product check · same deal, 3 products live
Conventional
25% down · 7.5% · 30yr
- Down + closing
- —
- Monthly P&I
- —
- Monthly cashflow
- —
- DSCR
- —
- Eligible?
- —
Personal DTI + credit; lowest rate.
DSCR
20% down · 8.5% · 30yr
- Down + closing
- —
- Monthly P&I
- —
- Monthly cashflow
- —
- DSCR
- —
- Eligible?
- —
No personal income docs; deal must DSCR.
Hard money
10% down · 12.0% · 12mo
- Down + closing
- —
- Monthly P&I
- —
- Monthly cashflow
- —
- DSCR
- —
- Eligible?
- —
Short-term bridge; refi at stabilization.
Rent comps 17 comps
| Address | Beds | Baths | Sqft | Rent | $/sqft | DOM | Units | Dist |
|---|---|---|---|---|---|---|---|---|
| 10345 Heritage Bay Blvd Naples, FL | 2.0 | 2.0 | 1232 | $4,425 | $3.59 | 13d | 2 | 0.04mi |
| 10349 Heritage Bay Blvd #2117 Naples, FL | 2.0 | 2.0 | 1232 | $2,300 | $1.87 | 13d | 1 | 0.07mi |
| 10337 Heritage Bay Blvd Naples, FL | 2.0 | 2.0 | 1213 | $4,400 | $3.63 | 23d | 4 | 0.08mi |
| 10338 Heritage Bay Blvd #2514 Naples, FL | 2.0 | 2.0 | 1414 | $2,500 | $1.77 | 23d | 1 | 0.11mi |
| 10353 Heritage Bay Blvd #2226 Naples, FL | 2.0 | 2.0 | 1232 | $6,500 | $5.28 | 23d | 1 | 0.12mi |
| 10353 Heritage Bay Blvd #2226 Naples, FL | 2.0 | 2.0 | 1232 | $6,500 | $5.28 | 13d | 1 | 0.12mi |
| 10333 Heritage Bay Blvd #1715 Naples, FL | 2.0 | 2.0 | 1194 | $6,000 | $5.03 | 23d | 1 | 0.13mi |
| 10330 Heritage Bay Blvd #2626 Naples, FL | 2.0 | 2.0 | 1414 | $6,900 | $4.88 | 23d | 1 | 0.14mi |
| 10329 Heritage Bay Blvd #1622 Naples, FL | 2.0 | 2.0 | 1232 | $5,500 | $4.46 | 23d | 1 | 0.18mi |
| 10321 Heritage Bay Blvd Naples, FL | 2.0–3.0 | 2.0 | 1320 | $6,500 | $4.92 | 21d | 2 | 0.21mi |
| 10321 Heritage Bay Blvd Naples, FL | 2.0–3.0 | 2.0 | 1301 | $5,400 | $4.15 | 23d | 3 | 0.21mi |
| 10307 Heritage Bay Blvd Naples, FL | 2.0 | 2.0 | 1194 | $2,800 | $2.35 | 13d | 1 | 0.23mi |
| 10317 Heritage Bay Blvd #1416 Naples, FL | 2.0 | 2.0 | 1232 | $7,000 | $5.68 | 23d | 1 | 0.24mi |
| 10313 Heritage Bay Blvd #1342 Naples, FL | 2.0 | 2.0 | 1232 | $6,500 | $5.28 | 23d | 1 | 0.26mi |
| 10270 Heritage Bay Blvd #3422 Naples, FL | 2.0 | 2.0 | 1414 | $6,500 | $4.60 | 23d | 1 | 0.41mi |
| 10275 Heritage Bay Blvd Naples, FL | 2.0 | 2.0 | 1301 | $4,500 | $3.46 | 23d | 2 | 0.45mi |
| 10044 Siesta Bay Dr #9412 Naples, FL | 2.0 | 2.0 | 1414 | $2,500 | $1.77 | 23d | 1 | 1.30mi |
HOA detail condo
- Monthly dues
- $1,251 · $15,012/yr
- Likely covers
- water
- Assessments
- None detected in remarks — confirm with the listing agent.
Listing history 5 events
-
2026-06-18days on market $307,500 Active 4 DOM
-
2026-06-17days on market $307,500 Active 3 DOM
-
2026-06-16days on market $307,500 Active 2 DOM
-
2026-06-15remarks 695-char remark
-
2026-06-15$307,500 Active 1 DOM
ⓘ Source: listings_history table (triggers on properties + properties_extension) + one-shot
backfill from property_details.listing_events for pre-trigger history.
Tax reassessment forecast FL · Resets to sale price
- Current annual tax
- $3,829 · $319/mo
- Projected year-2 tax
- $3,829 · $319/mo
- Expected delta
- $0/yr ($0/mo · 0.0%)
ⓘ Screening estimate from a state-policy table — verify with the county assessor before closing.
Climate risk First Street
- Flood 1/10 Low FEMA zone AH · 0% chance over 30 yrs
- Wildfire 4/10 Moderate
- Heat 10/10 Extreme 7 d/yr ≥108°F today · 32 d/yr by 30 yrs out
- Wind 10/10 Extreme 99% chance of damaging wind over 30 yrs
- Air quality 2/10 Low 2 unhealthy d/yr today · 2 by 30 yrs out
Nearby sold comps map
Loading sold comps map…
Walkable amenities ~0.75 mi
Loading nearby amenities…
Taxation est. · year 1
- Rental income
- $60,665
- − Mortgage interest
- −$17,225
- − Property taxes
- −$3,829
- − Insurance
- −$3,362
- − Repairs & maintenance
- −$4,853
- − Management
- −$4,853
- − HOA
- −$15,012
- − Depreciation
- −$8,945
- Taxable income
- $2,585
- Est. tax owed @ 24.0%
- −$620
- After-tax cash flow
- $5,751/yr
For passive investors: Depreciation is non-cash, so a rental often shows a tax loss while cash-flowing — sheltering income. Rental losses are passive: they offset passive income freely, and up to $25,000/yr can offset ordinary (W-2) income if you actively participate and your MAGI is under $100k (phasing out to $0 by $150k); unused losses carry forward. On sale, claimed depreciation is recaptured at up to 25%, and gains may owe capital-gains tax (a 1031 exchange can defer both). Figures are a year-1 estimate at your 24.0% rate — not tax advice; consult a CPA.
Schools (NCES district)
- District
- Collier
- NCES district ID
- 1200330
- Math proficiency
- 60% ▼ -4.00%
- Reading proficiency
- 56% ▼ -2.00%
- Median HH income
- $58,275
- Composite
- 50.23/100
- National rank
- #1892
- State rank
- #16 of 73 in FL
Livability — Heritage Bay
No livability data for this city. (Only ~50 U.S. cities are tracked.)
Census & demographics
- Census place
- Heritage Bay, FL
- County
- Collier County · 396,295 people
- Metro
- Naples-Marco Island, FL
- Population (ZIP)
- 42,345
- Household income
- $93,861
- Rent vs Own
- Severe rent burden
- 409.0
Population outlook (Collier County) Hauer SSP2
- Today (2025)
- 420,858 people
- By 2030
- 450,054 · +6.9%
- By 2040
- 502,232 · +19.3%
- By 2050
- 544,932 · +29.5%
- By 2075
- 627,203 · +49.0%
- By 2100
- 659,015 · +56.6%
Race, ethnicity, and origin ACS 2023
- Neighborhood character
- Diverse neighborhood (Simpson 0.58)
- Race & ethnicity
- White 56% Hispanic / Latino 32% Two or more races 23% Black 8% Asian 2%
- Hispanic origin (detail)
- Mexican 8% Puerto Rican 2% Cuban 13%
- Common ancestry
- Hispanic 4% Romanian 3% Italian 2%
- Foreign-born
- 28% · Canada, Jamaica, China
- Languages at home
- 62% English-only · Spanish 28% French/Haitian/Cajun 5% Other Indo-European 3%
Political lean MEDSL · Collier
- 2024 margin
- Solid R (+33.1) · D 33.1% · R 66.2%
- 2008→2024 swing
- -10.6pp toward R · 2008: -22.5pp · 2024: -33.1pp
- All cycles
- 2024: R+33.1 2020: R+24.7 2016: R+26.0 2012: R+30.1 2008: R+22.5
Not yet ingested
- Civics
- —
Market trends
- HPI YoY
- ▼ -223.18%
- Current HPI
- 316.2474
- Rent YoY
- ▼ -1.65%
- Metro
- Naples-Marco Island, FL
- State GDP YoY
- ▲ 3.28%
- F500 in state
- 36
Industry mix (Fortune 500 HQ in FL)
| Industry | F500 HQs | Revenue |
|---|---|---|
| Industrial Technology | 2 | $29B |
|
||
| Insurance | 2 | $17B |
|
||
| Retail | 1 | $60B |
|
||
| Technology Distribution | 1 | $58B |
|
||
| Homebuilding | 1 | $35B |
|
||
| Technology Manufacturing | 1 | $35B |
|
||
Price history
+113.5% since first listed10 events — show timeline
- 2026-06-14 Listed $307,500 NAPLESMLS
- 2026-04-17 Listing Removed — NAPLESMLS
- 2026-03-16 Price Changed $324,900 NAPLESMLS
- 2026-03-11 Price Changed $330,900 NAPLESMLS
- 2026-03-05 Price Changed $331,400 NAPLESMLS
- 2026-02-25 Price Changed $331,900 NAPLESMLS
- 2026-02-18 Price Changed $332,400 NAPLESMLS
- 2026-02-12 Price Changed $332,900 NAPLESMLS
- 2025-11-06 Listed $334,900 NAPLESMLS
- 2011-09-17 Listed $144,000 NAPLESMLS
Property tax history
+9.5%/yrLatest (2025): $3,829 · +1.8% YoY. Source: county tax records.
Cash-flow waterfall
monthlySold comps — $/sqft
last 12 mo · ≤1 miLoading sold comps…