348 Sonny Dr · Fort Worth, TX
Flood risk No data
- FEMA flood zone
- —
- Chance of flooding over 30 yrs
- —
- Est. flood insurance / yr
- —
Fire risk No data
- Est. fire insurance / yr
- —
Heat risk No data
- Hot days now (above threshold)
- —
- Hot days in 30 yrs
- —
Wind risk No data
- Chance of severe wind over 30 yrs
- —
Air-quality risk No data
- Unhealthy air days now
- —
- Unhealthy air days in 30 yrs
- —
Risk factors via First Street. Map © Google.
Why this score? — see what drove the D- grade
The composite is a weighted blend of 9 inputs, each scored 0–100. Each bar is that input's sub-score; the figure is the points it added to the 100-point composite (weight × sub-score).
- Cash flow +13.3/30.0
- ARV discount +7.5/15.0
- DSCR +4.0/10.0
- Livability +4.0/5.0
- 1% rule +2.7/10.0
- Rent growth +2.5/5.0
- Condition / age +2.5/5.0
- Schools +2.3/10.0
- Appreciation +0.0/10.0
$301,999
🖨 Deal sheet 📄 Offer letter ✓ Due diligence
Listing remarks MLS
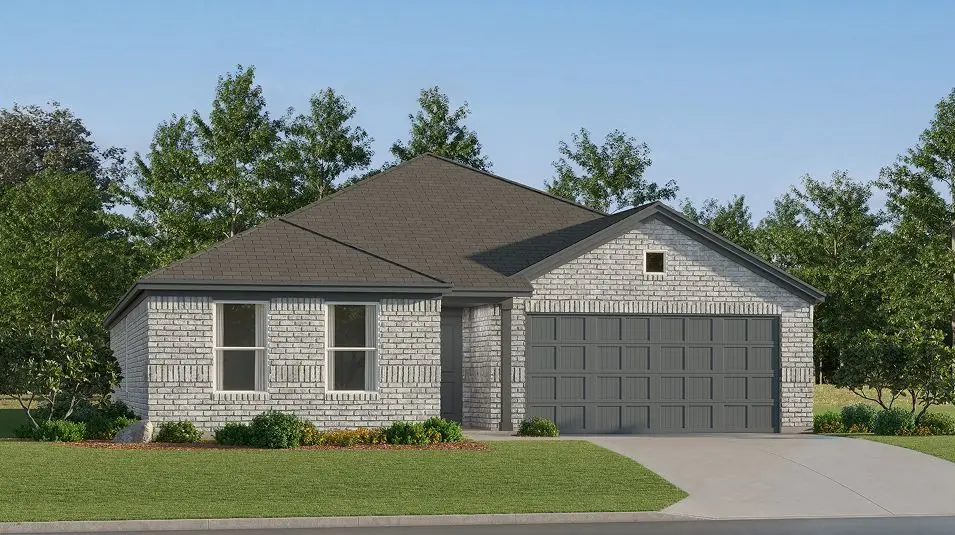
This new single-story home boasts a convenient and low-maintenance layout. Three bedrooms are secluded near the front of the home, leading to a spacious and flexible open-concept layout where the kitchen, dining room and family room meet. Nestled into a private rear corner is the lavish owner's suite, featuring a full bathroom and walk-in closet.
Key facts
- Full bathroom
- Walk-in closet
- Owner's suite
Tags
Property features AI
Finance
- Other: Builder listing / new construction
- Financial info: Listing accepts Cash, Conventional, FHA, and VA loan terms
- HOA & community: Mandatory homeowners association; Annual association fee; Association fee covers full use of facilities, grounds maintenance, and management fees; HOA managed by Legacy
Exterior
- Parking: 2-car attached garage; 2 covered parking spaces; Garage faces front
- Security: Smoke detectors; Carbon monoxide detector(s); Fire alarm
- Utilities: City water; City sewer; Concrete streets, curbs, and sidewalks; Located in a municipal utility district
- Home design: Single family residence; One-story; Attached property
- Construction: Brick exterior; Composition roof; Slab foundation; Built in 2026
- Exterior features: Covered porch(es); Landscaped yard; Sprinkler system; Wood fencing
Interior
- Kitchen: Dishwasher; Disposal; Gas oven; Gas range; Microwave; Vented exhaust fan; Natural stone/granite countertops; Built-in cabinets; Pantry; Walk-in pantry; Water line to refrigerator
- Bedrooms: 4 bedrooms (all on the main level); Primary bedroom on the main level
- Flooring: Carpet; Other flooring
- Bathrooms: 2 full bathrooms
- Heating & cooling: Central heating (electric); Central air conditioning (electric); ENERGY STAR qualified equipment
- Interior features: Open floorplan; Built-in features; Decorative lighting; Cable TV available; High speed internet available; Pantry; Walk-in closet(s); Seven total rooms; One living area; One dining area
- Laundry & utility: Washer/dryer hookups (details not specified)
Neighborhood map
What this means for you Summary
Snapshot
- This is a 4-bed/2.0-bath other listed at $302k.
Deal economics
- At list price, monthly cash flow is $2 ($26/yr) — positive.
- The deal already cash-flows at list — no discount required.
- To meet the 1% rule (rent ≥ 1% of price), the offer needs to be $233k (22.9% below list).
- Recommended offer: $233k (22.9% below list) — sets the bar for 1% rule.
- Cap rate 6.3% vs local median 3.9% in Fort Worth — top-decile yield for the area; either an underpriced asset or a hidden risk that comps aren't pricing in. Stress-test before assuming the spread holds.
Location & tenants
- Location reads 80/100 on livability (#49 in TX, #1,954 nationally) — a professional / high-income tenant draw. Strengths: amenities A+, cost of living A+, housing A+; Watch: crime F.
- Everman ISD (suburban): math 21% / reading 32% proficiency, ranked #691 of 826 in TX (top 84%) — low school quality limits family demand, transient renter base, plan for 1-2y turnover; 77% free/reduced lunch — lower-income household profile, screen leases tightly.
- Zoned schools: John And Polly Townley El (math 15% / reading 21%, grade F, #3,785 of 4,322 statewide, top 88%, 365 students, 95% FRL) — zoned schools average 95% FRL vs 77% district-wide (18 pts higher); higher-poverty schools than district average — tighter screening recommended.
- Market conditions: Rents flat; 374 active listings in the ZIP; 25 comparable units currently listed for rent nearby; rentals at typical pace (median 22d on market — plan ~3-4 weeks tenant-placement turnaround); 40% of comp listings sitting > 30 days — soft ceiling on asking rent; solid renter incomes; 18,938 units permitted in Tarrant County in 2024 (8,336 in 5+ unit buildings).
- This rent runs 37% of the median local income ($76k/yr) — at the standard rent-burdened threshold; future hikes will face affordability resistance.
Forward outlook
- Local home prices are declining (-3.0%/yr); year-one equity from $2k of loan paydown is wiped out by about $9k of value loss. Plan a longer hold.
- Tarrant County population projected at +41% by 2050 — long-run rental-demand tailwind backs the buy-and-hold thesis.
Negotiation context
- Only 13 days on market — expect competitive offers; lowballing is unlikely to land.
- 2 sale attempts with the ask held roughly flat each time — persistent listings suggest the price (not the market) is what's stuck; bring a comps-based counter.
Questions for the listing agent
- What does the HOA fee cover, when was the last increase, and are there any pending special assessments or reserve-fund shortfalls?
- Is there a deadline driving the sale (1031 exchange, divorce, estate, relocation)? That informs how much negotiation room exists.
- Schools are D-rated, which usually means shorter tenancies and higher turnover. Who's the typical renter profile here, and what's been the actual vacancy rate?
- Crime grade is F in this area — have there been break-ins, vandalism, or insurance claims at this property in the last 3 years? What carrier currently insures it and at what premium?
- The area grade is low — what's the realistic commute time and amenity access for the typical tenant pool here? Any planned neighborhood developments (good or bad) we should know about?
- What's the average days-on-market for RENTAL listings here right now (not sales)? A rising rental-DOM trend means longer vacancies and softer asking-rent achievability than the comps imply.
- What's the recent tenant-quality profile in this submarket — average credit score on applications, eviction rate, late-payment / NSF rate, and stable-employment percentage? A property-management company in the area should have these aggregated.
- How much new for-sale + rental construction is in the pipeline within 1–3 miles? Heavy new supply typically softens prices + rents 12–24 months out; constrained supply supports both.
Investment metrics
- 1% rule
- 0.77% ✗
- Cap rate
- 6.30%
- Cash-on-cash
- 0.03%
- DSCR
- 1.00
- GRM
- 10.8
CMA / ARV
No comps found within radius.
Projected returns pro-forma
-3.0% appreciation · 0.11% rent growth · sell at horizon
- IRR
- -19.2%
- Equity multiple
- 0.34×
- Total profit
- $-55,495
- Equity at exit
- $45,029
- IRR
- -18.3%
- Equity multiple
- 0.12×
- Total profit
- $-74,109
- Equity at exit
- $26,111
Cash invested: $84,560 (down + closing). Projections, not guarantees.
Landlord ↔ Tenant lean methodology
- Overall (STATE)
- 87 Strongly Landlord-Friendly
- State Texas
- 87 Strongly Landlord-Friendly · R+5
- County
- — inherits STATE
- City
- — inherits STATE
ZIP-level market 76140
- Home prices YoY
- -21.8%
- Rents YoY
- 0.1%
- Active inventory
- 374
- Price-to-rent
- 10.8×
Monthly cashflow live
- Estimated rent
- $2,328 high interval (Pro) →
- Mortgage (P&I)
- −$1,584
- Tax from tax record
- −$52 /mo · $629/yr
- Insurance
- −$126
- HOA
- −$75
- Vacancy / Maint / Mgmt
- −$489
- Net cashflow
- $2
Break-even live
UW: 25.0% down · 7.5% · 30yr · 1.5% tax · 5.0% vac · 8.0% maint · 8.0% mgmt
Financing live
Cash to close
- Down payment
- $75,500
- Closing costs
- $9,060
- Reserves months
- —
- Total cash needed
- —
Loan-product check · same deal, 3 products live
Conventional
25% down · 7.5% · 30yr
- Down + closing
- —
- Monthly P&I
- —
- Monthly cashflow
- —
- DSCR
- —
- Eligible?
- —
Personal DTI + credit; lowest rate.
DSCR
20% down · 8.5% · 30yr
- Down + closing
- —
- Monthly P&I
- —
- Monthly cashflow
- —
- DSCR
- —
- Eligible?
- —
No personal income docs; deal must DSCR.
Hard money
10% down · 12.0% · 12mo
- Down + closing
- —
- Monthly P&I
- —
- Monthly cashflow
- —
- DSCR
- —
- Eligible?
- —
Short-term bridge; refi at stabilization.
Rent comps 25 comps
| Address | Beds | Baths | Sqft | Rent | $/sqft | DOM | Units | Dist |
|---|---|---|---|---|---|---|---|---|
| 9004 Apple Orchard Ln Fort Worth, TX | 3.0–4.0 | 2.5 | 1514 | $2,719 | $1.80 | 15d | 2 | 0.43mi |
| 9004 Apple Orchard Ln Fort Worth, TX | 3.0–4.0 | 2.5 | 1514 | $2,699 | $1.78 | 1d | 7 | 0.43mi |
| 3137 Pecan Farm Ln Fort Worth, TX | 3.0 | 2.5 | 1592 | $2,200 | $1.38 | 43d | 1 | 0.61mi |
| 9000 Balch St Unit 612 Everman, TX | 3.0 | 2.0 | 1277 | $1,101 | $0.86 | 2d | 1 | 0.79mi |
| 3148 Evangeline Rd Fort Worth, TX | 3.0 | 2.0 | 1703 | $1,974 | $1.16 | 20d | 1 | 0.79mi |
| 3137 Evangeline Rd Fort Worth, TX | 3.0 | 2.0 | 1637 | $1,995 | $1.22 | 43d | 1 | 0.83mi |
| 108 Rosings Pl Fort Worth, TX | 4.0 | 2.5 | 1753 | $2,100 | $1.20 | 43d | 1 | 0.87mi |
| 514 Thompson Pl Fort Worth, TX | 4.0 | 2.5 | 1687 | $2,155 | $1.28 | 43d | 1 | 0.96mi |
| 435 Sussex Dr Fort Worth, TX | 3.0 | 2.0 | 1307 | $1,935 | $1.48 | 43d | 1 | 0.96mi |
| 512 Sussex Dr Fort Worth, TX | 3.0 | 2.0 | 1307 | $1,935 | $1.48 | 43d | 1 | 0.98mi |
| 111 Arango Way Fort Worth, TX | 4.0 | 2.5 | 2039 | $2,445 | $1.20 | 7d | 1 | 1.07mi |
| 1533 Woodwinds Dr Fort Worth, TX | 4.0 | 2.5 | 2131 | $2,519 | $1.18 | 43d | 1 | 1.38mi |
| 1540 Woodwinds Dr Fort Worth, TX | 4.0 | 2.0 | 1600 | $2,280 | $1.43 | 5d | 1 | 1.38mi |
| 1524 Harvester Dr Fort Worth, TX | 4.0 | 2.5 | 2131 | $2,520 | $1.18 | 5d | 1 | 1.39mi |
| 1532 Woodwinds Dr Fort Worth, TX | 5.0 | 2.5 | 2501 | $2,465 | $0.99 | 43d | 1 | 1.40mi |
| 9609 Klondike Dr Fort Worth, TX | 5.0 | 2.5 | 2501 | $2,615 | $1.05 | 22d | 1 | 1.41mi |
| 1508 Harvester Dr Fort Worth, TX | 4.0 | 2.0 | 1724 | $2,328 | $1.35 | 7d | 1 | 1.42mi |
| 1513 Woodwinds Dr Fort Worth, TX | 4.0 | 2.5 | 2131 | $2,519 | $1.18 | 24d | 1 | 1.42mi |
| 1500 Harvester Dr Fort Worth, TX | 4.0 | 2.0 | 1600 | $2,280 | $1.43 | 4d | 1 | 1.43mi |
| 1505 Woodwinds Dr Fort Worth, TX | 4.0 | 2.0 | 1600 | $2,280 | $1.43 | 19d | 1 | 1.44mi |
| 3425 Republic Dr Forest Hill, TX | 3.0 | 2.0 | 1300 | $1,600 | $1.23 | 43d | 1 | 1.46mi |
| 3427 Republic Dr Forest Hill, TX | 3.0 | 2.0 | 1300 | $1,600 | $1.23 | 24d | 1 | 1.46mi |
| 1444 Harvester Dr Fort Worth, TX | 3.0–5.0 | 2.0–2.5 | 1840 | $2,330 | $1.27 | 1d | 1 | 1.46mi |
| 7517 Marlinda Cir Fort Worth, TX | 3.0 | 2.0 | 1314 | $1,820 | $1.39 | 22d | 1 | 1.46mi |
| 3334 Heritage Ln Forest Hill, TX | 3.0 | 2.0 | 1300 | $1,800 | $1.38 | 43d | 1 | 1.49mi |
HOA detail
- Monthly dues
- $75 · $900/yr
Listing history 9 events
-
2026-06-15status $301,999 Pending 13 DOM
-
2026-06-15days on market $301,999 Active 13 DOM
-
2026-06-13days on market $301,999 Active 11 DOM
-
2026-06-09days on market $301,999 Active 7 DOM
-
2026-06-08days on market $301,999 Active 6 DOM
-
2026-06-07days on market $301,999 Active 5 DOM
-
2026-06-04days on market $301,999 Active 2 DOM
-
2026-06-02remarks 447-char remark
Show marketing remark (348 chars)
This new single-story home boasts a convenient and low-maintenance layout. Three bedrooms are secluded near the front of the home, leading to a spacious and flexible open-concept layout where the kitchen, dining room and family room meet. Nestled into a private rear corner is the lavish owner's suite, featuring a full bathroom and walk-in closet.
-
2026-06-02$301,999 Active 1 DOM
Show marketing remark (348 chars)
This new single-story home boasts a convenient and low-maintenance layout. Three bedrooms are secluded near the front of the home, leading to a spacious and flexible open-concept layout where the kitchen, dining room and family room meet. Nestled into a private rear corner is the lavish owner's suite, featuring a full bathroom and walk-in closet.
ⓘ Source: listings_history table (triggers on properties + properties_extension) + one-shot
backfill from property_details.listing_events for pre-trigger history.
Tax reassessment forecast TX · Resets to sale price
- Current annual tax
- $629 · $52/mo
- Projected year-2 tax
- $5,527 · $461/mo
- Expected delta
- +$4,898/yr (+$408/mo · 778.6%)
ⓘ Screening estimate from a state-policy table — verify with the county assessor before closing.
Nearby sold comps map
Loading sold comps map…
Walkable amenities ~0.75 mi
Loading nearby amenities…
Taxation est. · year 1
- Rental income
- $27,937
- − Mortgage interest
- −$16,917
- − Property taxes
- −$629
- − Insurance
- −$1,510
- − Repairs & maintenance
- −$2,235
- − Management
- −$2,235
- − HOA
- −$900
- − Depreciation
- −$8,785
- Taxable loss
- −$5,274
- Est. tax savings @ 24.0%
- +$1,266
- After-tax cash flow
- $1,292/yr
For passive investors: Depreciation is non-cash, so a rental often shows a tax loss while cash-flowing — sheltering income. Rental losses are passive: they offset passive income freely, and up to $25,000/yr can offset ordinary (W-2) income if you actively participate and your MAGI is under $100k (phasing out to $0 by $150k); unused losses carry forward. On sale, claimed depreciation is recaptured at up to 25%, and gains may owe capital-gains tax (a 1031 exchange can defer both). Figures are a year-1 estimate at your 24.0% rate — not tax advice; consult a CPA.
Schools (NCES district)
- District
- Everman ISD
- NCES district ID
- 4818810
- Math proficiency
- 21% ▼ -18.00%
- Reading proficiency
- 32% ▼ -4.00%
- Median HH income
- $44,803
- Composite
- 22.77/100
- National rank
- #8027
- State rank
- #691 of 826 in TX
Livability — Fort Worth
- Score
- 80/100
- State rank
- #49
- US rank
- #1954
Category grades
Schools grade is shown separately in the Schools card above.
Census & demographics
- Census place
- Fort Worth, TX
- County
- Tarrant County · 2,033,669 people
- City population
- 911,619
- Metro
- Dallas-Fort Worth-Arlington, TX
- Population (ZIP)
- 33,321
- Household income
- $75,955
- Rent vs Own
- Severe rent burden
- 1264.0
Population outlook (Tarrant County) Hauer SSP2
- Today (2025)
- 2,380,417 people
- By 2030
- 2,578,900 · +8.3%
- By 2040
- 2,974,995 · +25.0%
- By 2050
- 3,350,489 · +40.8%
- By 2075
- 4,216,909 · +77.2%
- By 2100
- 4,741,527 · +99.2%
Race, ethnicity, and origin ACS 2023
- Neighborhood character
- Diverse neighborhood (Simpson 0.68)
- Race & ethnicity
- Hispanic / Latino 39% Black 35% White 20% Two or more races 14% Asian 3%
- Hispanic origin (detail)
- Mexican 36%
- Common ancestry
- Scotch-Irish 2% Lithuanian 1% Slovak 1%
- Foreign-born
- 18% · Canada, Vietnam, China
- Languages at home
- 64% English-only · Spanish 32% Vietnamese 2% Chinese 1%
Political lean MEDSL · Tarrant
- 2024 margin
- Lean R (+5.1) · D 46.7% · R 51.9% · Other 1.4%
- 2008→2024 swing
- +6.6pp toward D · 2008: -11.7pp · 2024: -5.1pp
- All cycles
- 2024: R+5.1 2020: D+0.2 2016: R+8.7 2012: R+15.7 2008: R+11.7
Not yet ingested
- Civics
- —
Market trends
- HPI YoY
- ▼ -79.54%
- Current HPI
- 285.9894
- Rent YoY
- ▲ 0.11%
- Metro
- Dallas-Fort Worth-Arlington, TX
- State GDP YoY
- ▲ 3.95%
- F500 in state
- 110
Industry mix (Fortune 500 HQ in TX)
| Industry | F500 HQs | Revenue |
|---|---|---|
| Energy | 16 | $1,198B |
|
||
| Technology | 5 | $198B |
|
||
| Engineering / Construction | 4 | $72B |
|
||
| Energy Services | 3 | $60B |
|
||
| Utilities | 3 | $41B |
|
||
| Healthcare | 2 | $330B |
|
||
Price history
+0.0% since first listed2 events — show timeline
- 2026-06-02 Listed $301,999 Zillow
- 2026-06-02 Listed $301,999 NTREIS
Cash-flow waterfall
monthlySold comps — $/sqft
last 12 mo · ≤1 miLoading sold comps…