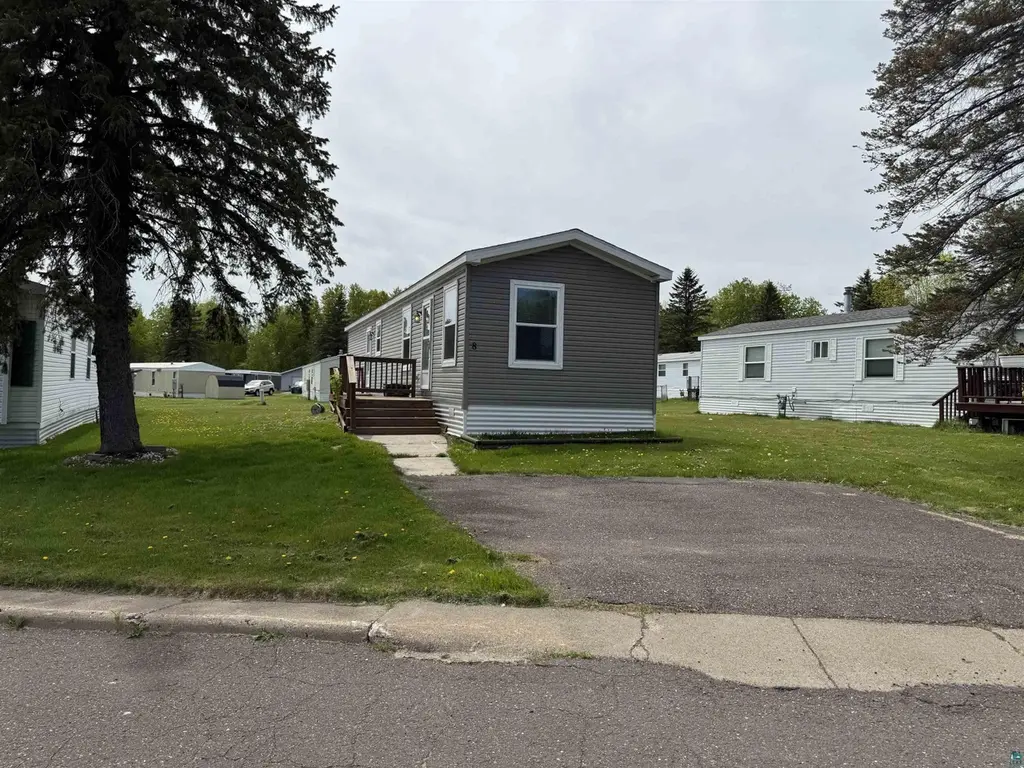
8 Holt Dr · Duluth, MN
Flood risk 1/10 · Minimal
- FEMA flood zone
- X
- Chance of flooding over 30 yrs
- 0.0%
- Est. flood insurance / yr
- $507 – $1,088
Fire risk 3/10 · Minor
- Est. fire insurance / yr
- $888 – $1,650
Heat risk 2/10 · Minimal
- Hot days now (above 90°F)
- 7 days/yr
- Hot days in 30 yrs
- 13 days/yr
Wind risk 1/10 · Minimal
- Chance of severe wind over 30 yrs
- —
Air-quality risk 1/10 · Minimal
- Unhealthy air days now
- 0 days/yr
- Unhealthy air days in 30 yrs
- 0 days/yr
Risk factors via First Street. Map © Google.
Why this score? — see what drove the B grade
The composite is a weighted blend of 9 inputs, each scored 0–100. Each bar is that input's sub-score; the figure is the points it added to the 100-point composite (weight × sub-score).
- Cash flow +30.0/30.0
- 1% rule +10.0/10.0
- DSCR +10.0/10.0
- ARV discount +7.5/15.0
- Schools +4.2/10.0
- Livability +4.1/5.0
- Condition / age +3.8/5.0
- Rent growth +2.5/5.0
- Appreciation +0.0/10.0
$59,900
🖨 Deal sheet 📄 Offer letter ✓ Due diligence
Listing remarks MLS
Welcome to Vintage Acres! This 2017 Mid Country 14 x 60 single-wide offers two bedrooms, a full bath, open living and kitchen area with an electric fireplace in the living room. Eat-in Kitchen with breakfast bar and all stainless steel appliances. Washer and dryer and kitchen appliances will stay with the property. Off street parking on asphalt in front of the house. Lot rent is $576.00 which includes garbage. Water and Sewer billed separately. Street Plowing is done by the management. Owner is responsible for mowing. Buyers must be approved with Vintage Acres.
Key facts
- Off street parking
- Eat-in kitchen
- Electric fireplace
Tags
Property features AI
Finance
- Other: Above grade finished area 696 square feet; Main level finished area 696 square feet
- Financial info: Land lease payment applies
- HOA & community: Land is leased
Exterior
- Parking: Asphalt parking
- Utilities: City water (connected); City sewer (connected); 100 amp electric service (Minnesota Power); Natural gas
- Home design: Residential property; Manufactured home; Single-story (one level); Entry level: Main; Facing direction: Not specified
- Construction: Other construction materials; Asphalt roof (over 8 years old); Foundation: Other (14 x 60)
- Exterior features: Deck; Vinyl exterior; Paved streets and sidewalks; Private maintained road
Interior
- Kitchen: Dishwasher; Range; Microwave; Refrigerator; Stainless steel appliances
- Bedrooms: Main level primary bedroom (12 x 9); Main level second bedroom (10 x 9)
- Bathrooms: Main floor full bath
- Heating & cooling: Forced air heating; Window air conditioning unit(s)
- Interior features: All living facilities on one level; Main floor bedroom; Main floor laundry; Eat-in kitchen; Electric fireplace in living room
- Laundry & utility: Washer hookup; Dryer hookup (electric); Laundry located in hall on main level
Neighborhood map
What this means for you Summary
Snapshot
- This is a 2-bed/1.0-bath single-family listed at $60k. Condition is rated good.
Deal economics
- At list price, monthly cash flow is $353 ($4k/yr) — positive.
- The deal already cash-flows at list — no discount required.
- Meets the 1% rule at list price ($970 rent vs $60k).
- Recommended offer: $59k (1.5% below list) — sets the bar for market timing.
- Cap rate 13.4% vs local median 4.9% in Duluth — top-decile yield for the area; either an underpriced asset or a hidden risk that comps aren't pricing in. Stress-test before assuming the spread holds.
Location & tenants
- Location reads 82/100 on livability (#36 in MN, #1,060 nationally) — a professional / high-income tenant draw. Strengths: commute A+, cost of living A+, housing A+; Watch: amenities F.
- Duluth Public School District (urban): math 44% / reading 55% proficiency, ranked #132 of 301 in MN (top 44%) — families likely to look elsewhere, expect single-tenant / working-renter base with shorter leases.
- Market conditions: 35 active listings in the ZIP; 639 units permitted in St. Louis County in 2024 (338 in 5+ unit buildings).
Forward outlook
- Local home prices are declining (-3.0%/yr); year-one equity from $414 of loan paydown is wiped out by about $2k of value loss. Plan a longer hold.
- At projected returns (-3.0% appreciation + 3.0% rent growth), your $17k cash investment doubles in ~5 years — after that, you're playing with house money.
Negotiation context
- It's been on market 16 days — a 2% lower offer ($59k) is reasonable based on typical stale-listing flexibility.
- 3 sale attempts since 8y ago with the ask held roughly flat each time — persistent listings suggest the price (not the market) is what's stuck; bring a comps-based counter.
- Current owner paid $45k; 33% above their basis — modest negotiation headroom, anchor on the comps not their cost.
Questions for the listing agent
- Is there a deadline driving the sale (1031 exchange, divorce, estate, relocation)? That informs how much negotiation room exists.
- Schools are B-rated — typically a magnet for longer-tenancy family renters. What's the average tenant stay here, and is there a school-zone premium baked into asking?
- What's the average days-on-market for RENTAL listings here right now (not sales)? A rising rental-DOM trend means longer vacancies and softer asking-rent achievability than the comps imply.
- What's the recent tenant-quality profile in this submarket — average credit score on applications, eviction rate, late-payment / NSF rate, and stable-employment percentage? A property-management company in the area should have these aggregated.
- How much new for-sale + rental construction is in the pipeline within 1–3 miles? Heavy new supply typically softens prices + rents 12–24 months out; constrained supply supports both.
Investment metrics
- 1% rule
- 1.62% ✓
- Cap rate
- 13.36%
- Cash-on-cash
- 25.23%
- DSCR
- 2.12
- GRM
- 5.1
CMA / ARV
- ARV (on-the-fly)
- $188,616
- Comps found
- 1
Show comp detail 1 sale within ~0.75 mi
| Address | Dist | Beds/Ba | Sqft | Sold | Price | $/sf | Match |
|---|---|---|---|---|---|---|---|
| 1223 103rd Ave W | 0.52mi | 2/1.0 | 700 (+1%) | 10mo | $190,000 | $271 | 67 |
Match score weights: distance 35% · size 25% · config 20% · recency 20%. Top-matched comps best support the ARV.
Projected returns pro-forma
-3.0% appreciation · 3.0% rent growth · sell at horizon
- IRR
- 18.8%
- Equity multiple
- 1.76×
- Total profit
- $12,768
- Equity at exit
- $8,931
- IRR
- 27.1%
- Equity multiple
- 3.39×
- Total profit
- $40,098
- Equity at exit
- $5,179
Cash invested: $16,772 (down + closing). Projections, not guarantees.
Landlord ↔ Tenant lean methodology
- Overall (STATE)
- 46 Balanced
- State Minnesota
- 46 Balanced · D+2
- County
- — inherits STATE
- City
- — inherits STATE
ZIP-level market 55808
- Home prices YoY
- -29.8%
- Active inventory
- 35
- Price-to-rent
- 5.1×
Monthly cashflow live
- Estimated rent
- $970 medium interval (Pro) →
- Mortgage (P&I)
- −$314
- Tax est. 1.5%
- −$75 /mo · $898/yr
- Insurance
- −$25
- HOA
- −$0
- Vacancy / Maint / Mgmt
- −$204
- Net cashflow
- $353
Break-even live
UW: 25.0% down · 7.5% · 30yr · 1.5% tax · 5.0% vac · 8.0% maint · 8.0% mgmt
Financing live
Cash to close
- Down payment
- $14,975
- Closing costs
- $1,797
- Reserves months
- —
- Total cash needed
- —
Loan-product check · same deal, 3 products live
Conventional
25% down · 7.5% · 30yr
- Down + closing
- —
- Monthly P&I
- —
- Monthly cashflow
- —
- DSCR
- —
- Eligible?
- —
Personal DTI + credit; lowest rate.
DSCR
20% down · 8.5% · 30yr
- Down + closing
- —
- Monthly P&I
- —
- Monthly cashflow
- —
- DSCR
- —
- Eligible?
- —
No personal income docs; deal must DSCR.
Hard money
10% down · 12.0% · 12mo
- Down + closing
- —
- Monthly P&I
- —
- Monthly cashflow
- —
- DSCR
- —
- Eligible?
- —
Short-term bridge; refi at stabilization.
Listing history 13 events
-
2026-06-19days on market $59,900 Active 16 DOM
-
2026-06-18days on market $59,900 Active 15 DOM
-
2026-06-17days on market $59,900 Active 14 DOM
-
2026-06-16days on market $59,900 Active 13 DOM
-
2026-06-15days on market $59,900 Active 12 DOM
-
2026-06-14days on market $59,900 Active 10 DOM
-
2026-06-13days on market $59,900 Active 9 DOM
-
2026-06-10days on market $59,900 Active 7 DOM
-
2026-06-09days on market $59,900 Active 6 DOM
-
2026-06-08days on market $59,900 Active 5 DOM
-
2026-06-07days on market $59,900 Active 4 DOM
-
2026-06-05remarks 569-char remark
-
2026-06-05$59,900 Active 1 DOM
ⓘ Source: listings_history table (triggers on properties + properties_extension) + one-shot
backfill from property_details.listing_events for pre-trigger history.
Climate risk First Street
- Flood 1/10 Low FEMA zone X · 0% chance over 30 yrs
- Wildfire 3/10 Moderate
- Heat 2/10 Low 7 d/yr ≥90°F today · 13 d/yr by 30 yrs out
- Wind 1/10 Low
- Air quality 1/10 Low 0 unhealthy d/yr today · 0 by 30 yrs out
Nearby sold comps map
Loading sold comps map…
Walkable amenities ~0.75 mi
Loading nearby amenities…
Taxation est. · year 1
- Rental income
- $11,644
- − Mortgage interest
- −$3,355
- − Property taxes
- −$898
- − Insurance
- −$300
- − Repairs & maintenance
- −$932
- − Management
- −$932
- − Depreciation
- −$1,743
- Taxable income
- $3,485
- Est. tax owed @ 24.0%
- −$837
- After-tax cash flow
- $3,395/yr
For passive investors: Depreciation is non-cash, so a rental often shows a tax loss while cash-flowing — sheltering income. Rental losses are passive: they offset passive income freely, and up to $25,000/yr can offset ordinary (W-2) income if you actively participate and your MAGI is under $100k (phasing out to $0 by $150k); unused losses carry forward. On sale, claimed depreciation is recaptured at up to 25%, and gains may owe capital-gains tax (a 1031 exchange can defer both). Figures are a year-1 estimate at your 24.0% rate — not tax advice; consult a CPA.
Condition & rehab AI · 12 photos
This 2017 single-wide mobile home in Vintage Acres is in good condition with modern updates and a move-in-ready appearance.
Value-add opportunities
- Both paint exterior — enhances curb appeal and resale value
- Both landscaping — improves curb appeal and rental value
Renovation cost estimate screening
Value-add ROI direction
- Both paint exterior — enhances curb appeal and resale value ↑
- Both landscaping — improves curb appeal and rental value ↑
ⓘ Cost ranges are severity-bucket heuristics (US national rule-of-thumb). Get contractor quotes + a written scope before underwriting a rehab budget.
Schools (NCES district)
- District
- Duluth Public School District
- NCES district ID
- 2711040
- Math proficiency
- 44% ▼ -10.00%
- Reading proficiency
- 55% ▼ -6.00%
- Median HH income
- $45,692
- Composite
- 41.92/100
- National rank
- #3360
- State rank
- #132 of 301 in MN
Livability — Duluth
- Score
- 82/100
- State rank
- #36
- US rank
- #1060
Category grades
Schools grade is shown separately in the Schools card above.
Census & demographics
- Census place
- Duluth, MN
- City population
- 71,097
- Population (ZIP)
- 5,325
Population outlook (St. Louis County) Hauer SSP2
- Today (2025)
- 202,411 people
- By 2030
- 203,234 · +0.4%
- By 2040
- 202,520 · +0.1%
- By 2050
- 200,853 · -0.8%
- By 2075
- 200,943 · -0.7%
- By 2100
- 192,058 · -5.1%
Race, ethnicity, and origin ACS 2023
- Neighborhood character
- Predominantly White (90%)
- Race & ethnicity
- White 90% Two or more races 6% Native American 3% Hispanic / Latino 1%
- Common ancestry
- Portuguese 14% Romanian 8% Lithuanian 5%
- Foreign-born
- 1% · Canada
Political lean MEDSL · St. Louis
- 2024 margin
- D (+13.7) · D 55.9% · R 42.2% · Other 1.8%
- 2008→2024 swing
- -18.8pp toward R · 2008: 32.5pp · 2024: 13.7pp
- All cycles
- 2024: D+13.7 2020: D+15.6 2016: D+11.8 2012: D+29.6 2008: D+32.5
Not yet ingested
- Civics
- —
Market trends
- HPI YoY
- ▼ -100.66%
- Current HPI
- 237.4607
- Rent YoY
- —
- Metro
- —
- State GDP YoY
- ▲ 2.41%
- F500 in state
- 34
Industry mix (Fortune 500 HQ in MN)
| Industry | F500 HQs | Revenue |
|---|---|---|
| Healthcare | 2 | $407B |
|
||
| Retail | 2 | $150B |
|
||
| Consumer Goods | 2 | $32B |
|
||
| Industrial Machinery | 2 | $6B |
|
||
| Agriculture | 1 | $40B |
|
||
| Healthcare / Medical Devices | 1 | $32B |
|
||
Price history
+23.5% since first listed4 events — show timeline
- 2026-06-02 Listed $59,900 NORTHSTARMLS as Distributed by MLS Grid
- 2026-06-02 Listed $59,900 LSAR
- 2018-07-30 Sold (MLS) $45,000 LSAR
- 2018-02-07 Listed $48,500 LSAR
Cash-flow waterfall
monthlySold comps — $/sqft
last 12 mo · ≤1 miLoading sold comps…