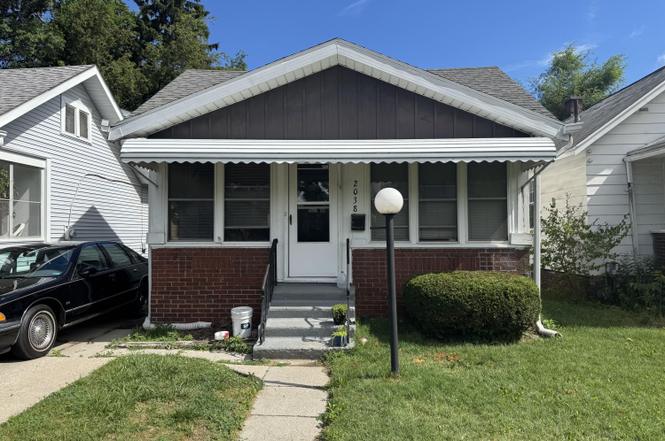
2038 Fairfax Rd · Toledo, OH
Flood risk 1/10 · Minimal
- FEMA flood zone
- X (unshaded)
- Chance of flooding over 30 yrs
- 0.0%
- Est. flood insurance / yr
- $473 – $860
Fire risk 1/10 · Minimal
- Est. fire insurance / yr
- $713 – $1,323
Heat risk 3/10 · Minor
- Hot days now (above 101°F)
- 7 days/yr
- Hot days in 30 yrs
- 16 days/yr
Wind risk 2/10 · Minimal
- Chance of severe wind over 30 yrs
- —
Air-quality risk 2/10 · Minimal
- Unhealthy air days now
- 1 days/yr
- Unhealthy air days in 30 yrs
- 3 days/yr
Risk factors via First Street. Map © Google.
Why this score? — see what drove the B- grade
The composite is a weighted blend of 9 inputs, each scored 0–100. Each bar is that input's sub-score; the figure is the points it added to the 100-point composite (weight × sub-score).
- Cash flow +30.0/30.0
- 1% rule +10.0/10.0
- DSCR +10.0/10.0
- ARV discount +7.5/15.0
- Rent growth +3.3/5.0
- Livability +3.3/5.0
- Condition / age +2.5/5.0
- Schools +1.6/10.0
- Appreciation +0.0/10.0
$59,900
🖨 Deal sheet (PDF) 📄 Offer letter ✓ Due diligence
Listing remarks MLS
SOLD “AS IS”-NO DISCLOSURE-FAX OFFER WITH LENDER APPROVAL LETTER OR VERIFICATION OF FUNDS-ADDENDUM WILL FOLLOW-NO COMMISSION PAYABLE IF BUYER IS LICENSED AGENT-BUYER IS RESPONSIBLE FOR ALL CONVEYANCEAND TITLE CHARGES-DORMER AREA BONUS ROOM ACCESS VIA REAR BED CLOSET.
Key facts
- 3,200 sq ft lot
- Built 1922
Neighborhood map
What this means for you Summary
Snapshot
- This is a 3-bed/1.0-bath single-family listed at $60k.
Deal economics
- At list price, monthly cash flow is $483 ($6k/yr) — positive.
- The deal already cash-flows at list — no discount required.
- Meets the 1% rule at list price ($1k rent vs $60k).
- Cap rate 16.0% vs local median 7.5% in Toledo — top-decile yield for the area; either an underpriced asset or a hidden risk that comps aren't pricing in. Stress-test before assuming the spread holds.
Location & tenants
- Location reads 66/100 on livability (#645 in OH) — a middle-class / working-renter tenant base. Strengths: cost of living A+, housing A+, health & safety A+; Watch: amenities C-, crime F, commute F.
- Toledo City (urban): math 15% / reading 24% proficiency, ranked #634 of 656 in OH (top 97%) — low school quality limits family demand, transient renter base, plan for 1-2y turnover; 72% free/reduced lunch — lower-income household profile, screen leases tightly.
- Zoned schools: Mckinley Stemm Academy (math 2% / reading 12%, grade F, #1,527 of 1,584 statewide, top 98%, 279 students, 0% FRL); Start High School (math 11% / reading 33%, grade F, #672 of 781 statewide, top 86%, 1,242 students, 50% FRL) — zoned schools average 25% FRL vs 72% district-wide (47 pts lower); this property's tenant base skews higher-income than the district average.
- Market conditions: Rents rising (+3.3%/yr); 117 active listings in the ZIP; 40 comparable units currently listed for rent nearby; rentals lingering (median 45d on market — plan ~5-8 weeks vacancy on turnover, expect pricing pressure); 50% of comp listings sitting > 30 days — soft ceiling on asking rent; 415 units permitted in Lucas County in 2024 (122 in 5+ unit buildings).
Forward outlook
- Local home prices are declining (-3.0%/yr); year-one equity from $414 of loan paydown is wiped out by about $2k of value loss. Plan a longer hold.
- Lucas County population projected at -16% by 2050 — secular population decline; favor cash flow + early exit over multi-decade hold.
- At projected returns (-3.0% appreciation + 3.3% rent growth), your $17k cash investment doubles in ~4 years — after that, you're playing with house money.
Negotiation context
- Only 0 days on market — expect competitive offers; lowballing is unlikely to land.
- 6 sale attempts since 25y ago with the ask held roughly flat each time — persistent listings suggest the price (not the market) is what's stuck; bring a comps-based counter.
- Current owner paid $27k; list at $60k implies a 122% gain — meaningful room to come down on a strong offer.
Risks & watch-outs
- Watch-outs: built in 1922 — expect roof / HVAC / electrical / plumbing capex.
Questions for the listing agent
- Built in 1922 — when were the roof, HVAC, electrical panel, plumbing, and water heater last replaced?
- Is there a deadline driving the sale (1031 exchange, divorce, estate, relocation)? That informs how much negotiation room exists.
- Schools are D-rated, which usually means shorter tenancies and higher turnover. Who's the typical renter profile here, and what's been the actual vacancy rate?
- Crime grade is F in this area — have there been break-ins, vandalism, or insurance claims at this property in the last 3 years? What carrier currently insures it and at what premium?
- What's the average days-on-market for RENTAL listings here right now (not sales)? A rising rental-DOM trend means longer vacancies and softer asking-rent achievability than the comps imply.
- What's the recent tenant-quality profile in this submarket — average credit score on applications, eviction rate, late-payment / NSF rate, and stable-employment percentage? A property-management company in the area should have these aggregated.
- How much new for-sale + rental construction is in the pipeline within 1–3 miles? Heavy new supply typically softens prices + rents 12–24 months out; constrained supply supports both.
Investment metrics
- 1% rule
- 1.95% ✓
- Cap rate
- 15.97%
- Cash-on-cash
- 34.55%
- DSCR
- 2.54
- GRM
- 4.3
CMA / ARV
- ARV (on-the-fly)
- $123,600
- Comps found
- 12
Show comp detail 12 sales within ~0.75 mi
| Address | Dist | Beds/Ba | Sqft | Sold | Price | $/sf | Match |
|---|---|---|---|---|---|---|---|
| 1936 Mansfield St | 0.16mi | 3/1.0 | 1,168 (-3%) | 1mo | $79,900 | $68 | 87 |
| 3664 Sherbrooke Rd | 0.25mi | 3/1.0 | 1,255 (+5%) | 0mo | $149,000 | $119 | 80 |
| 3424 Saint Bernard Dr | 0.20mi | 3/1.5 | 1,281 (+7%) | 1mo | $154,400 | $121 | 77 |
| 3621 Sherbrooke Rd | 0.28mi | 3/2.0 | 1,119 (-7%) | 1mo | $92,500 | $83 | 71 |
| 3725 Kershaw Ave | 0.51mi | 3/1.5 | 1,225 (+2%) | 1mo | $145,000 | $118 | 70 |
| 2014 Barrows St | 0.38mi | 3/1.0 | 1,069 (-11%) | 1mo | $110,000 | $103 | 63 |
| 1804 Loxley Rd | 0.34mi | 3/1.5 | 1,056 (-12%) | 1mo | $81,290 | $77 | 61 |
| 1811 Giant St | 0.45mi | 3/1.0 | 1,069 (-11%) | 1mo | $70,000 | $65 | 60 |
| 1805 Tremainsville Rd | 0.73mi | 3/1.5 | 1,152 (-4%) | 1mo | $92,000 | $80 | 57 |
| 3509 Rushland Ave | 0.74mi | 3/2.0 | 1,286 (+7%) | 1mo | $200,000 | $156 | 49 |
| 1827 Jermain Dr | 0.58mi | 3/1.0 | 1,375 (+15%) | 1mo | $95,000 | $69 | 48 |
| 2928 Northwood Ave | 0.60mi | 4/1.5 (+1) | 1,347 (+12%) | 1mo | $214,900 | $160 | 44 |
Match score weights: distance 35% · size 25% · config 20% · recency 20%. Top-matched comps best support the ARV.
Projected returns pro-forma
-3.0% appreciation · 3.3% rent growth · sell at horizon
- IRR
- 30.4%
- Equity multiple
- 2.28×
- Total profit
- $21,433
- Equity at exit
- $8,931
- IRR
- 37.8%
- Equity multiple
- 4.57×
- Total profit
- $59,859
- Equity at exit
- $5,179
Cash invested: $16,772 (down + closing). Projections, not guarantees.
Landlord ↔ Tenant lean methodology
- Overall (STATE)
- 73 Landlord-Friendly
- State Ohio
- 73 Landlord-Friendly · R+6
- County
- — inherits STATE
- City
- — inherits STATE
ZIP-level market 43613
- Home prices YoY
- -20.7%
- Rents YoY
- 3.3%
- Active inventory
- 117
- Price-to-rent
- 4.3×
Monthly cashflow live
- Estimated rent
- $1,168 high interval (Pro) →
- Mortgage (P&I)
- −$314
- Tax from tax record
- −$101 /mo · $1,210/yr
- Insurance
- −$25
- HOA
- −$0
- Vacancy / Maint / Mgmt
- −$245
- Net cashflow
- $483
Break-even live
Sensitivity live
| Price | -10% $517 | -5% $500 | +0% $483 | +5% $466 | +10% $449 |
|---|---|---|---|---|---|
| Rent | -10% $391 | -5% $437 | +0% $483 | +5% $529 | +10% $575 |
| Rate | -1.0pp $513 | -0.5pp $498 | base $483 | +0.5pp $467 | +1.0pp $452 |
UW: 25.0% down · 7.5% · 30yr · 1.5% tax · 5.0% vac · 8.0% maint · 8.0% mgmt
Financing live
Cash to close
- Down payment
- $14,975
- Closing costs
- $1,797
- Reserves months
- —
- Total cash needed
- —
Loan-product check · same deal, 3 products live
Conventional
25% down · 7.5% · 30yr
- Down + closing
- —
- Monthly P&I
- —
- Monthly cashflow
- —
- DSCR
- —
- Eligible?
- —
Personal DTI + credit; lowest rate.
DSCR
20% down · 8.5% · 30yr
- Down + closing
- —
- Monthly P&I
- —
- Monthly cashflow
- —
- DSCR
- —
- Eligible?
- —
No personal income docs; deal must DSCR.
Hard money
10% down · 12.0% · 12mo
- Down + closing
- —
- Monthly P&I
- —
- Monthly cashflow
- —
- DSCR
- —
- Eligible?
- —
Short-term bridge; refi at stabilization.
Rent comps 40 comps
| Address | Beds | Baths | Sqft | Rent | $/sqft | DOM | Units | Dist |
|---|---|---|---|---|---|---|---|---|
| 1951 Loxley Rd Toledo, OH | 2.0 | 1.0 | 804 | $975 | $1.21 | 24d | 1 | 0.18mi |
| 3683 Upton Ave Toledo, OH | 3.0 | 1.0 | 1119 | $1,100 | $0.98 | 44d | 1 | 0.27mi |
| 1846 Loxley Rd Toledo, OH | 2.0 | 1.0 | 876 | $900 | $1.03 | 44d | 1 | 0.28mi |
| 1731 Mansfield Rd Toledo, OH | 3.0 | 1.0 | 1138 | $1,195 | $1.05 | 24d | 1 | 0.37mi |
| 1838 Giant St Toledo, OH | 3.0 | 1.0 | 962 | $1,200 | $1.25 | 15d | 1 | 0.39mi |
| 1705 Marlow Rd Toledo, OH | 2.0 | 1.0 | 738 | $1,000 | $1.36 | 24d | 1 | 0.43mi |
| 1732 Talbot St Toledo, OH | 2.0 | 1.0 | 840 | $995 | $1.18 | 24d | 1 | 0.43mi |
| 1804 Bigelow St Toledo, OH | 3.0 | 1.0 | 995 | $937 | $0.94 | 44d | 1 | 0.47mi |
| 3430 Anderson Pkwy Toledo, OH | 3.0 | 2.0 | 1372 | $1,650 | $1.20 | 24d | 1 | 0.48mi |
| 1718 Giant St Toledo, OH | 3.0 | 1.0 | 1080 | $1,395 | $1.29 | 15d | 1 | 0.50mi |
| 2301 Portsmouth Ave Toledo, OH | 4.0 | 1.0 | 1335 | $1,395 | $1.04 | 24d | 1 | 0.54mi |
| 3644 Harley Rd Toledo, OH | 2.0 | 1.0 | 1025 | $975 | $0.95 | 24d | 1 | 0.63mi |
| 3835 Monroe St Toledo, OH | 2.0 | 1.0 | 1002 | $950 | $0.95 | 44d | 1 | 0.64mi |
| 2244 W Sylvania Ave Unit 6 Toledo, OH | 2.0 | 1.0 | 800 | $795 | $0.99 | 44d | 1 | 0.65mi |
| 3803 Monroe St Toledo, OH | 2.0 | 1.0 | 942 | $850 | $0.90 | 44d | 1 | 0.69mi |
| 2802 Gunckel Blvd Toledo, OH | 2.0 | 1.0 | 860 | $1,100 | $1.28 | 44d | 1 | 0.74mi |
| 3022 Letchworth Pkwy Toledo, OH | 2.0 | 1.0 | 800 | $970 | $1.21 | 44d | 1 | 0.74mi |
| 1573 Jermain Dr Toledo, OH | 3.0 | 1.0 | 1254 | $1,195 | $0.95 | 15d | 1 | 0.74mi |
| 3817 Burton Ave Toledo, OH | 3.0 | 1.0 | 754 | $1,015 | $1.35 | 22d | 1 | 0.76mi |
| 1489 Berdan Ave Toledo, OH | 3.0 | 1.0 | 1068 | $1,250 | $1.17 | 44d | 1 | 0.77mi |
| 2734 Powhattan Pkwy Toledo, OH | 2.0 | 1.0 | 1144 | $900 | $0.79 | 44d | 1 | 0.82mi |
| 3901 Leybourn Ave Toledo, OH | 3.0 | 1.0 | 840 | $1,150 | $1.37 | 24d | 1 | 0.84mi |
| 3606 Revere Dr Toledo, OH | 4.0 | 1.0 | 1320 | $1,500 | $1.14 | 44d | 1 | 0.87mi |
| 3713 Hazelhurst Ave Toledo, OH | 3.0 | 1.5 | 1352 | $1,700 | $1.26 | 44d | 1 | 0.94mi |
| 4038 Lyman Ave Toledo, OH | 3.0 | 1.0 | 1175 | $1,395 | $1.19 | 44d | 1 | 0.95mi |
| 4315 Garden Park Dr Toledo, OH | 3.0 | 1.0 | 1268 | $1,423 | $1.12 | 24d | 1 | 0.96mi |
| 3725 Hoiles Ave Toledo, OH | 3.0 | 1.0 | 1180 | $1,245 | $1.06 | 24d | 1 | 1.02mi |
| 3805 Hoiles Ave Toledo, OH | 3.0 | 1.0 | 1370 | $1,025 | $0.75 | 24d | 1 | 1.02mi |
| 2650 Christie St Toledo, OH | 1.0–2.0 | 1.0 | 800 | $849 | $1.06 | 44d | 1 | 1.04mi |
| 4120 Parrakeet Ave Toledo, OH | 3.0 | 2.0 | 1410 | $1,450 | $1.03 | 44d | 1 | 1.05mi |
| 4435 Jackman Rd Toledo, OH | 1.0–2.0 | 1.0 | 725 | $922 | $1.27 | 15d | 3 | 1.10mi |
| 2356 Torrey Hill Dr Unit 11 Toledo, OH | 2.0 | 1.0 | 1050 | $800 | $0.76 | 44d | 1 | 1.10mi |
| 1919 Ottawa Dr Unit 7 Toledo, OH | 2.0 | 1.0 | 900 | $800 | $0.89 | 44d | 1 | 1.10mi |
| 3541 Willys Pkwy Toledo, OH | 3.0 | 1.0 | 1113 | $1,400 | $1.26 | 44d | 1 | 1.10mi |
| 2322 Upton Ave Toledo, OH | 3.0 | 1.0 | 1000 | $1,300 | $1.30 | 44d | 1 | 1.18mi |
| 4223 Birchall Rd Toledo, OH | 3.0 | 1.0 | 1338 | $1,395 | $1.04 | 24d | 1 | 1.18mi |
| 3915 Willys Pkwy Unit 3915 Toledo, OH | 3.0 | 1.0 | 1080 | $800 | $0.74 | 22d | 1 | 1.18mi |
| 2704 Kenwood Blvd Toledo, OH | 1.0–3.0 | 1.0 | 825 | $1,488 | $1.80 | 15d | 71 | 1.22mi |
| 4030 Elmhurst Rd Apt 2 Toledo, OH | 2.0 | 1.0 | 875 | $900 | $1.03 | 44d | 1 | 1.23mi |
| 4030 Elmhurst Rd Toledo, OH | 2.0 | 1.0 | 800 | $900 | $1.12 | 24d | 1 | 1.23mi |
Listing history 2 events
-
2026-06-15remarks 250-char remark
-
2026-06-15$59,900 Pending
ⓘ Source: listings_history table (triggers on properties + properties_extension) + one-shot
backfill from property_details.listing_events for pre-trigger history.
Tax reassessment forecast OH · Partial reset (capped growth)
- Current annual tax
- $1,210 · $101/mo
- Projected year-2 tax
- $1,210 · $101/mo
- Expected delta
- $0/yr ($0/mo · 0.0%)
ⓘ Screening estimate from a state-policy table — verify with the county assessor before closing.
Climate risk First Street
- Flood 1/10 Low FEMA zone X (unshaded) · 0% chance over 30 yrs
- Wildfire 1/10 Low
- Heat 3/10 Moderate 7 d/yr ≥101°F today · 16 d/yr by 30 yrs out
- Wind 2/10 Low
- Air quality 2/10 Low 1 unhealthy d/yr today · 3 by 30 yrs out
Nearby sold comps map
Loading sold comps map…
Walkable amenities ~0.75 mi
Loading nearby amenities…
Taxation est. · year 1
- Rental income
- $14,017
- − Mortgage interest
- −$3,355
- − Property taxes
- −$1,210
- − Insurance
- −$300
- − Repairs & maintenance
- −$1,121
- − Management
- −$1,121
- − Depreciation
- −$1,743
- Taxable income
- $5,167
- Est. tax owed @ 24.0%
- −$1,240
- After-tax cash flow
- $4,554/yr
For passive investors: Depreciation is non-cash, so a rental often shows a tax loss while cash-flowing — sheltering income. Rental losses are passive: they offset passive income freely, and up to $25,000/yr can offset ordinary (W-2) income if you actively participate and your MAGI is under $100k (phasing out to $0 by $150k); unused losses carry forward. On sale, claimed depreciation is recaptured at up to 25%, and gains may owe capital-gains tax (a 1031 exchange can defer both). Figures are a year-1 estimate at your 24.0% rate — not tax advice; consult a CPA.
Schools (NCES district)
- District
- Toledo City
- NCES district ID
- 3904490
- Math proficiency
- 15% ▼ -16.00%
- Reading proficiency
- 24% ▼ -13.00%
- Median HH income
- $32,137
- Composite
- 15.76/100
- National rank
- #9276
- State rank
- #634 of 656 in OH
Livability — Toledo
- Score
- 66/100
- State rank
- #645
- US rank
- #11442
Category grades
Schools grade is shown separately in the Schools card above.
Census & demographics
- Census place
- Toledo, OH
- County
- Lucas County · 380,724 people
- City population
- 280,811
- Metro
- Toledo, OH
- Population (ZIP)
- 30,780
- Household income
- $64,384
- Rent vs Own
- Severe rent burden
- 917.0
Population outlook (Lucas County) Hauer SSP2
- Today (2025)
- 420,751 people
- By 2030
- 410,187 · -2.5%
- By 2040
- 384,019 · -8.7%
- By 2050
- 355,125 · -15.6%
- By 2075
- 291,683 · -30.7%
- By 2100
- 233,670 · -44.5%
Race, ethnicity, and origin ACS 2023
- Neighborhood character
- Predominantly White (71%)
- Race & ethnicity
- White 71% Black 15% Two or more races 10% Hispanic / Latino 7%
- Hispanic origin (detail)
- Mexican 5%
- Common ancestry
- Romanian 9% Lithuanian 3% Slovak 1%
- Foreign-born
- 2% · Canada
- Languages at home
- 95% English-only · Spanish 3% Arabic 1%
Political lean MEDSL · Lucas
- 2024 margin
- D (+12.6) · D 55.8% · R 43.2%
- 2008→2024 swing
- -18.9pp toward R · 2008: 31.4pp · 2024: 12.6pp
- All cycles
- 2024: D+12.6 2020: D+16.8 2016: D+17.4 2012: D+30.4 2008: D+31.4
Not yet ingested
- Civics
- —
Market trends
- HPI YoY
- ▼ -62.37%
- Current HPI
- 239.1345
- Rent YoY
- ▲ 3.30%
- Metro
- Toledo, OH
- State GDP YoY
- ▲ 1.98%
- F500 in state
- 48
Industry mix (Fortune 500 HQ in OH)
| Industry | F500 HQs | Revenue |
|---|---|---|
| Insurance | 3 | $145B |
|
||
| Industrial Machinery | 3 | $49B |
|
||
| Financial Services | 3 | $24B |
|
||
| Consumer Goods | 2 | $93B |
|
||
| Aerospace / Defense | 2 | $47B |
|
||
| Utilities | 2 | $33B |
|
||
Price history
+76.7% since first listed19 events — show timeline
- 2026-06-12 Listed $59,900 NORIS
- 2026-06-12 Listing Removed — NORIS
- 2025-10-09 Price Changed $27,000 NORIS
- 2025-10-09 Price Changed $52,500 NORIS
- 2006-11-07 Sold (MLS) $27,000 NORIS
- 2006-09-30 Listed $39,900 NORIS
- 2006-09-22 Listing Removed — NORIS
- 2006-06-27 Listed $49,900 NORIS
- 2006-06-22 Listing Removed — NORIS
- 2006-02-27 Listed $59,900 NORIS
- 2003-01-27 Sold (Public Records) $75,500 Public Records
- 2002-03-13 Sold (Public Records) $52,500 Public Records
- 2002-03-12 Sold (MLS) $52,500 NORIS
- 2002-03-04 Price Changed $58,500 NORIS
- 2002-02-12 Listed $58,500 NORIS
- 2001-12-13 Sold (MLS) $27,500 NORIS
- 2001-10-22 Price Changed $27,500 NORIS
- 2001-10-12 Listed $21,000 NORIS
- 1990-05-31 Sold (Public Records) $33,900 Public Records
Property tax history
+0.6%/yrLatest (2025): $1,210 · +0.9% YoY. Source: county tax records.
Cash-flow waterfall
monthlySold comps — $/sqft
last 12 mo · ≤1 miLoading sold comps…