 🏗️ New Construction
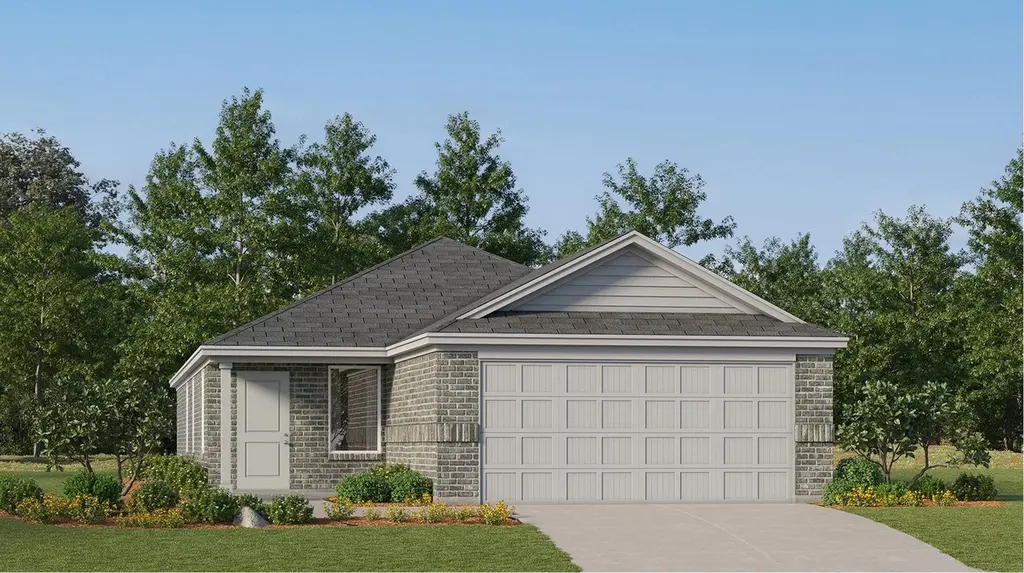
Sentosa Plan · Cut and Shoot, TX
Flood risk 7/10 · Major
- FEMA flood zone
- X (unshaded)
- Chance of flooding over 30 yrs
- 0.99%
- Est. flood insurance / yr
- $507 – $1,088
Fire risk 5/10 · Moderate
- Est. fire insurance / yr
- $1,222 – $2,270
Heat risk 8/10 · Major
- Hot days now (above 111°F)
- 7 days/yr
- Hot days in 30 yrs
- 23 days/yr
Wind risk 8/10 · Major
- Chance of severe wind over 30 yrs
- 99.0%
Air-quality risk 2/10 · Minimal
- Unhealthy air days now
- 1 days/yr
- Unhealthy air days in 30 yrs
- 1 days/yr
Risk factors via First Street. Map © Google.
Why this score? — see what drove the D+ grade
The composite is a weighted blend of 9 inputs, each scored 0–100. Each bar is that input's sub-score; the figure is the points it added to the 100-point composite (weight × sub-score).
- Cash flow +16.3/30.0
- ARV discount +7.5/15.0
- Schools +5.1/10.0
- DSCR +5.0/10.0
- Condition / age +4.8/5.0
- 1% rule +4.4/10.0
- Livability +2.8/5.0
- Rent growth +2.4/5.0
- Appreciation +0.0/10.0
$227,990
🖨 Deal sheet (PDF) 📄 Offer letter ✓ Due diligence
Listing remarks MLS
This new home offers simple living with a convenient single-level layout. An open-concept floorplan combines the kitchen, living and dining areas for simple entertaining and multitasking. Three secondary bedrooms are tucked away to the side of the home, and the owner's suite is nestled into a private rear corner, offering access to a spa-inspired bathroom and walk-in closet.
Key facts
- Natural creek
- Green spaces
- 2 garage spots
Tags
Neighborhood map
What this means for you Summary
Snapshot
- This is a 4-bed/2.0-bath single-family listed at $228k. Condition is rated excellent.
Deal economics
- At list price, monthly cash flow is $56 ($674/yr) — positive.
- The deal already cash-flows at list — no discount required.
- To meet the 1% rule (rent ≥ 1% of price), the offer needs to be $211k (7.5% below list).
- Recommended offer: $201k (12.0% below list) — sets the bar for market timing.
- Cap rate 7.0% vs local median 4.9% in Cut and Shoot — top-decile yield for the area; either an underpriced asset or a hidden risk that comps aren't pricing in. Stress-test before assuming the spread holds.
Location & tenants
- Location reads 56/100 on livability (#1,326 in TX) — a working-class tenant base; expect higher turnover. Strengths: cost of living A+, housing A+; Watch: crime D-, amenities F, commute F.
- Conroe ISD (other): math 57% / reading 57% proficiency, ranked #69 of 826 in TX (top 8%) — acceptable for families but not a draw, mixed tenant base, ~2y average lease.
- Zoned schools: Austin El (math 39% / reading 29%, grade F, #2,149 of 4,322 statewide, top 50%, 950 students, 81% FRL); Moorhead J H (math 35% / reading 42%, grade F, #704 of 1,662 statewide, top 43%, 1,391 students, 82% FRL); Conroe H S (math 32% / reading 51%, grade F, #767 of 1,632 statewide, top 47%, 4,915 students, 61% FRL) — zoned schools average 75% FRL vs 34% district-wide (40 pts higher); higher-poverty schools than district average — tighter screening recommended.
- Zoned-school proficiency averages 38% at this address vs 57% district-wide (-19 pts) — the specific schools serving this property underperform the Conroe ISD average; the district grade overstates school quality for this exact location.
- Market conditions: Rents soft (-0.3%/yr); 721 active listings in the ZIP; 3 comparable units currently listed for rent nearby; rentals leasing fast (median 1d on market — plan ~1-2 weeks tenant-placement turnaround); solid renter incomes; 13,259 units permitted in Montgomery County in 2024 (1,402 in 5+ unit buildings).
- This rent runs 34% of the median local income ($75k/yr) — at the standard rent-burdened threshold; future hikes will face affordability resistance.
Forward outlook
- Local home prices are declining (-3.0%/yr); year-one equity from $2k of loan paydown is wiped out by about $7k of value loss. Plan a longer hold.
- Montgomery County population projected at +65% by 2050 — long-run rental-demand tailwind backs the buy-and-hold thesis.
Negotiation context
- It's been on market 382 days — a 12% lower offer ($201k) is reasonable based on typical stale-listing flexibility.
Risks & watch-outs
- Watch-outs: flood insurance adds $66/mo.
- Climate carrying-cost: major flood risk; severe wind risk, 99% chance of damaging wind over 30y; moderate wildfire risk; extreme-heat days projected 7→23/yr by 2055 (HVAC capex compounding) — expect insurance premiums to compound above CPI over the hold.
Questions for the listing agent
- It's been on market 382 days. Have you received any prior offers? Is the seller open to a 12% concession, seller financing, or rate buy-down credit?
- What's the actual annual flood-insurance premium (NFIP or private), and is the property in a SFHA with mandatory coverage?
- Why hasn't it sold? Are there any deal-killer items the seller is aware of (foundation, flood, title, zoning, code violations)?
- Is there a deadline driving the sale (1031 exchange, divorce, estate, relocation)? That informs how much negotiation room exists.
- Schools are F-rated, which usually means shorter tenancies and higher turnover. Who's the typical renter profile here, and what's been the actual vacancy rate?
- Crime grade is D in this area — have there been break-ins, vandalism, or insurance claims at this property in the last 3 years? What carrier currently insures it and at what premium?
- The area grade is low — what's the realistic commute time and amenity access for the typical tenant pool here? Any planned neighborhood developments (good or bad) we should know about?
- What's the average days-on-market for RENTAL listings here right now (not sales)? A rising rental-DOM trend means longer vacancies and softer asking-rent achievability than the comps imply.
- What's the recent tenant-quality profile in this submarket — average credit score on applications, eviction rate, late-payment / NSF rate, and stable-employment percentage? A property-management company in the area should have these aggregated.
- How much new for-sale + rental construction is in the pipeline within 1–3 miles? Heavy new supply typically softens prices + rents 12–24 months out; constrained supply supports both.
Investment metrics
- 1% rule
- 0.94% ✗
- Cap rate
- 6.95%
- Cash-on-cash
- 2.35%
- DSCR
- 1.10
- GRM
- 8.8
CMA / ARV
- ARV (median comp)
- $223,402
- List price
- $227,990
- Delta
- 2.05%
- Verdict
- FAIR
- Comps
- 20 within 1.0 mi
Show comp detail 12 sales within ~0.75 mi
| Address | Dist | Beds/Ba | Sqft | Sold | Price | $/sf | Match |
|---|---|---|---|---|---|---|---|
| 14112 Biscayne Trl | 0.29mi | 3/2.5 (-1) | 1,570 (-1%) | 10mo | $232,650 | $148 | 70 |
| 9521 Last Maples Trl | 0.37mi | 3/2.5 (-1) | 1,553 (-2%) | 11mo | $246,730 | $159 | 64 |
| 14208 Sedona Ridge Dr | 0.47mi | 3/2.0 (-1) | 1,567 (-1%) | 10mo | $225,000 | $144 | 63 |
| 14381 High Hill Dr | 0.62mi | 3/2.0 (-1) | 1,629 (+3%) | 4mo | $199,000 | $122 | 58 |
| 9534 Shady Trail Dr | 0.75mi | 4/2.0 | 1,684 (+6%) | 1mo | $238,900 | $142 | 54 |
| 14135 Biscayne Trl | 0.25mi | 3/2.5 (-1) | 1,737 (+10%) | 13mo | $252,285 | $145 | 54 |
| 9553 Last Maples Trl | 0.43mi | 3/2.0 (-1) | 1,378 (-13%) | 3mo | $219,000 | $159 | 51 |
| 14131 Biscayne Trl | 0.26mi | 3/2.0 (-1) | 1,365 (-14%) | 15mo | $217,850 | $160 | 48 |
| 9320 Shady Creek Dr | 0.61mi | 4/2.5 | 1,785 (+13%) | 7mo | $249,900 | $140 | 42 |
| 14312 High Hill Dr | 0.56mi | 3/2.5 (-1) | 1,689 (+7%) | 17mo | $229,415 | $136 | 41 |
| 9155 Fallow Deer Dr | 0.60mi | 3/2.0 (-1) | 1,812 (+14%) | 13mo | $399,999 | $221 | 32 |
| 14304 High Hill Dr | 0.57mi | 3/2.0 (-1) | 1,373 (-13%) | 18mo | $204,305 | $149 | 32 |
Match score weights: distance 35% · size 25% · config 20% · recency 20%. Top-matched comps best support the ARV.
Projected returns pro-forma
-3.0% appreciation · 0.0% rent growth · sell at horizon
- IRR
- -18.1%
- Equity multiple
- 0.38×
- Total profit
- $-38,734
- Equity at exit
- $33,310
- IRR
- -18.1%
- Equity multiple
- 0.16×
- Total profit
- $-52,719
- Equity at exit
- $19,316
Cash invested: $62,553 (down + closing). Projections, not guarantees.
Landlord ↔ Tenant lean methodology
- Overall (STATE)
- 87 Strongly Landlord-Friendly
- State Texas
- 87 Strongly Landlord-Friendly · R+5
- County
- — inherits STATE
- City
- — inherits STATE
ZIP-level market 77303
- Home prices YoY
- -22.4%
- Rents YoY
- -0.3%
- Active inventory
- 721
- Price-to-rent
- 9.0×
Monthly cashflow live
- Estimated rent
- $2,109 medium interval (Pro) →
- Mortgage (P&I)
- −$1,172
- Tax est. 1.5%
- −$279 /mo · $3,351/yr
- Insurance
- −$93
- Flood insurance flood zone
- −$66 /mo · $798/yr
- HOA
- −$0
- Vacancy / Maint / Mgmt
- −$443
- Net cashflow
- $56
Break-even live
Sensitivity live
| Price | -10% $211 | -5% $133 | +0% $56 | +5% $-21 | +10% $-98 |
|---|---|---|---|---|---|
| Rent | -10% $-110 | -5% $-27 | +0% $56 | +5% $139 | +10% $223 |
| Rate | -1.0pp $169 | -0.5pp $113 | base $56 | +0.5pp $-2 | +1.0pp $-61 |
UW: 25.0% down · 7.5% · 30yr · 1.5% tax · 5.0% vac · 8.0% maint · 8.0% mgmt
Financing live
Cash to close
- Down payment
- $55,851
- Closing costs
- $6,702
- Reserves months
- —
- Total cash needed
- —
Loan-product check · same deal, 3 products live
Conventional
25% down · 7.5% · 30yr
- Down + closing
- —
- Monthly P&I
- —
- Monthly cashflow
- —
- DSCR
- —
- Eligible?
- —
Personal DTI + credit; lowest rate.
DSCR
20% down · 8.5% · 30yr
- Down + closing
- —
- Monthly P&I
- —
- Monthly cashflow
- —
- DSCR
- —
- Eligible?
- —
No personal income docs; deal must DSCR.
Hard money
10% down · 12.0% · 12mo
- Down + closing
- —
- Monthly P&I
- —
- Monthly cashflow
- —
- DSCR
- —
- Eligible?
- —
Short-term bridge; refi at stabilization.
Rent comps 3 comps
| Address | Beds | Baths | Sqft | Rent | $/sqft | DOM | Units | Dist |
|---|---|---|---|---|---|---|---|---|
| 9302 Laiden Creek Trl Conroe, TX | 3.0 | 3.0 | 1628 | $1,775 | $1.09 | 45d | 1 | 0.11mi |
| 9262 Laiden Creek Trl Conroe, TX | 3.0–4.0 | 2.0–2.5 | 1601 | $2,135 | $1.33 | 0d | 14 | 0.12mi |
| 9248 Laiden Creek Trl Unit 510 Conroe, TX | 3.0 | 2.0 | 1788 | $1,984 | $1.11 | 0d | 1 | 0.13mi |
Listing history 15 events
-
2026-06-21days on market $227,990 Active 382 DOM
-
2026-06-18days on market $227,990 Active 379 DOM
-
2026-06-17days on market $227,990 Active 378 DOM
-
2026-06-16days on market $227,990 Active 377 DOM
-
2026-06-15days on market $227,990 Active 376 DOM
-
2026-06-13days on market $227,990 Active 374 DOM
-
2026-06-09days on market $227,990 Active 370 DOM
-
2026-06-08days on market $227,990 Active 369 DOM
-
2026-06-07days on market $227,990 Active 368 DOM
-
2026-06-04days on market $227,990 Active 365 DOM
-
2026-06-03days on market $227,990 Active 364 DOM
-
2026-06-02days on market $227,990 Active 363 DOM
-
2026-06-01days on market $227,990 Active 362 DOM
-
2026-05-31days on market $227,990 Active 361 DOM
-
2025-06-04$227,990 Active 377-char remark
Show marketing remark (377 chars)
This new home offers simple living with a convenient single-level layout. An open-concept floorplan combines the kitchen, living and dining areas for simple entertaining and multitasking. Three secondary bedrooms are tucked away to the side of the home, and the owner's suite is nestled into a private rear corner, offering access to a spa-inspired bathroom and walk-in closet.
ⓘ Source: listings_history table (triggers on properties + properties_extension) + one-shot
backfill from property_details.listing_events for pre-trigger history.
Climate risk First Street
- Flood 7/10 Severe FEMA zone X (unshaded) · 99% chance over 30 yrs
- Wildfire 5/10 Major
- Heat 8/10 Severe 7 d/yr ≥111°F today · 23 d/yr by 30 yrs out
- Wind 8/10 Severe 99% chance of damaging wind over 30 yrs
- Air quality 2/10 Low 1 unhealthy d/yr today · 1 by 30 yrs out
Nearby sold comps map
Loading sold comps map…
Walkable amenities ~0.75 mi
Loading nearby amenities…
Taxation est. · year 1
- Rental income
- $25,314
- − Mortgage interest
- −$12,514
- − Property taxes
- −$3,351
- − Insurance
- −$1,915
- − Repairs & maintenance
- −$2,025
- − Management
- −$2,025
- − Depreciation
- −$6,499
- Taxable loss
- −$3,015
- Est. tax savings @ 24.0%
- +$724
- After-tax cash flow
- $1,397/yr
For passive investors: Depreciation is non-cash, so a rental often shows a tax loss while cash-flowing — sheltering income. Rental losses are passive: they offset passive income freely, and up to $25,000/yr can offset ordinary (W-2) income if you actively participate and your MAGI is under $100k (phasing out to $0 by $150k); unused losses carry forward. On sale, claimed depreciation is recaptured at up to 25%, and gains may owe capital-gains tax (a 1031 exchange can defer both). Figures are a year-1 estimate at your 24.0% rate — not tax advice; consult a CPA.
Condition & rehab AI · 12 photos
This single-family home is in excellent condition with a modern design and well-maintained exterior. It offers a good investment opportunity with minimal work needed.
Value-add opportunities
- Both Painting the exterior and interior walls — Fresh paint enhances curb appeal and interior aesthetics.
- Both Landscaping improvements — Enhances curb appeal and adds value to the property.
Renovation cost estimate screening
Value-add ROI direction
- Both Painting the exterior and interior walls — Fresh paint enhances curb appeal and interior aesthetics. ↑
- Both Landscaping improvements — Enhances curb appeal and adds value to the property. ↑
ⓘ Cost ranges are severity-bucket heuristics (US national rule-of-thumb). Get contractor quotes + a written scope before underwriting a rehab budget.
Schools (NCES district)
- District
- Conroe ISD
- NCES district ID
- 4815000
- Math proficiency
- 57% ▼ -6.00%
- Reading proficiency
- 57% ▼ -1.00%
- Median HH income
- $71,541
- Composite
- 50.65/100
- National rank
- #1833
- State rank
- #69 of 826 in TX
Livability — Cut and Shoot
- Score
- 56/100
- State rank
- #1326
- US rank
- #22835
Category grades
Schools grade is shown separately in the Schools card above.
Census & demographics
- County
- Montgomery County · 663,713 people
- Metro
- Houston-The Woodlands-Sugar Land, TX
- Population (ZIP)
- 28,854
- Household income
- $75,348
- Rent vs Own
- Severe rent burden
- 464.0
Population outlook (Montgomery County) Hauer SSP2
- Today (2025)
- 713,896 people
- By 2030
- 805,263 · +12.8%
- By 2040
- 992,708 · +39.1%
- By 2050
- 1,179,590 · +65.2%
- By 2075
- 1,628,084 · +128.1%
- By 2100
- 1,937,880 · +171.5%
Race, ethnicity, and origin ACS 2023
- Neighborhood character
- Diverse neighborhood (Simpson 0.56)
- Race & ethnicity
- White 54% Hispanic / Latino 38% Two or more races 17% Black 4%
- Hispanic origin (detail)
- Mexican 25%
- Common ancestry
- Lithuanian 1% Romanian 1% Slovak 1%
- Foreign-born
- 13% · Canada, Jamaica
- Languages at home
- 69% English-only · Spanish 31%
Political lean MEDSL · Montgomery
- 2024 margin
- Solid R (+45.5) · D 26.8% · R 72.3%
- 2008→2024 swing
- +7.2pp toward D · 2008: -52.7pp · 2024: -45.5pp
- All cycles
- 2024: R+45.5 2020: R+43.8 2016: R+51.4 2012: R+60.7 2008: R+52.7
Not yet ingested
- Civics
- —
Market trends
- HPI YoY
- ▼ -77.71%
- Current HPI
- 269.5367
- Rent YoY
- ▼ -0.31%
- Metro
- Houston-The Woodlands-Sugar Land, TX
- State GDP YoY
- ▲ 3.95%
- F500 in state
- 110
Industry mix (Fortune 500 HQ in TX)
| Industry | F500 HQs | Revenue |
|---|---|---|
| Energy | 16 | $1,198B |
|
||
| Technology | 5 | $198B |
|
||
| Engineering / Construction | 4 | $72B |
|
||
| Energy Services | 3 | $60B |
|
||
| Utilities | 3 | $41B |
|
||
| Healthcare | 2 | $330B |
|
||
Price history
1 event — show timeline
- 2025-06-04 Listed $227,990 Zillow
Cash-flow waterfall
monthlySold comps — $/sqft
last 12 mo · ≤1 miLoading sold comps…