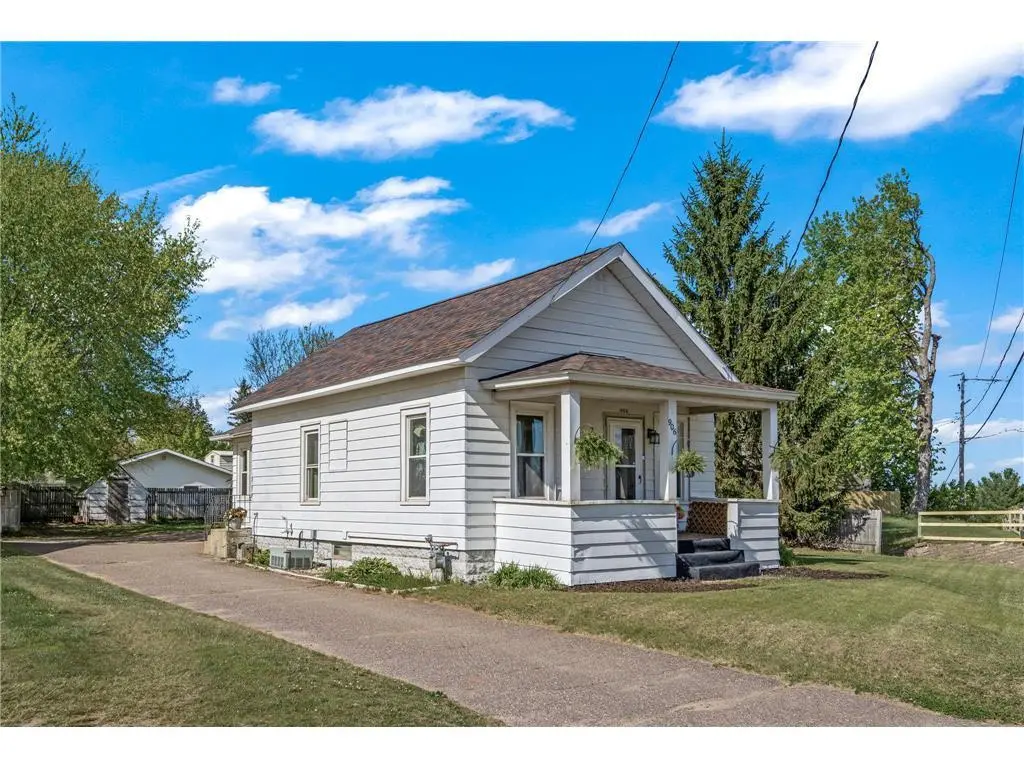
906 Cameron St · Eau Claire, WI
Flood risk 1/10 · Minimal
- FEMA flood zone
- X (unshaded)
- Chance of flooding over 30 yrs
- 0.0%
- Est. flood insurance / yr
- $473 – $860
Fire risk 3/10 · Minor
- Est. fire insurance / yr
- $636 – $1,182
Heat risk 2/10 · Minimal
- Hot days now (above 98°F)
- 7 days/yr
- Hot days in 30 yrs
- 14 days/yr
Wind risk 1/10 · Minimal
- Chance of severe wind over 30 yrs
- —
Air-quality risk 2/10 · Minimal
- Unhealthy air days now
- 1 days/yr
- Unhealthy air days in 30 yrs
- 1 days/yr
Risk factors via First Street. Map © Google.
Why this score? — see what drove the D grade
The composite is a weighted blend of 9 inputs, each scored 0–100. Each bar is that input's sub-score; the figure is the points it added to the 100-point composite (weight × sub-score).
- Cash flow +12.4/30.0
- ARV discount +10.4/15.0
- Livability +4.5/5.0
- DSCR +3.7/10.0
- Schools +3.5/10.0
- 1% rule +3.2/10.0
- Rent growth +3.0/5.0
- Condition / age +2.5/5.0
- Appreciation +0.0/10.0
$180,000
🖨 Deal sheet 📄 Offer letter ✓ Due diligence
Listing remarks MLS
This 2-bedroom, 1-bath cutie is set on a spacious lot just minutes from downtown Eau Claire and Half Moon Beach. With thoughtful updates throughout, a new roof, and a functional layout, this one won?t last long.
Key facts
- Thoughtful updates
- Spacious lot
- Functional layout
Tags
Property features AI
Finance
- Financial info: $2,207 annual tax (2025)
Exterior
- Parking: Asphalt parking
- Utilities: City water connected; City sewer connected; Oil fuel
- Home design: Residential property; One level
- Construction: Block foundation; Built on a block foundation
- Exterior features: Metal and vinyl exterior
Interior
- Bedrooms: 2 bedrooms
- Bathrooms: 1 full bathroom
- Heating & cooling: Forced air heating; Central air conditioning
- Interior features: Partial basement
Neighborhood map
What this means for you Summary
Snapshot
- This is a 2-bed/1.0-bath single-family listed at $180k.
Deal economics
- At list price, monthly cash flow is $-31 ($-369/yr) — negative.
- To cash-flow at today's rent, offer at most $175k (3.0% below list).
- To meet the 1% rule (rent ≥ 1% of price), the offer needs to be $148k (17.6% below list).
- Recommended offer: $148k (17.6% below list) — sets the bar for 1% rule.
- Cap rate 6.1% vs local median 2.4% in Eau Claire — top-decile yield for the area; either an underpriced asset or a hidden risk that comps aren't pricing in. Stress-test before assuming the spread holds.
Location & tenants
- Location reads 89/100 on livability (#10 in WI, #121 nationally) — a professional / high-income tenant draw. Strengths: amenities A+, cost of living A+, housing A+.
- Eau Claire Area School District (urban): math 38% / reading 43% proficiency, ranked #150 of 342 in WI (top 44%) — families likely to look elsewhere, expect single-tenant / working-renter base with shorter leases.
- Market conditions: Rents rising (+2.0%/yr); 212 active listings in the ZIP; 17 comparable units currently listed for rent nearby; rentals at typical pace (median 21d on market — plan ~3-4 weeks tenant-placement turnaround); 41% of comp listings sitting > 30 days — soft ceiling on asking rent; 583 units permitted in Eau Claire County in 2024 (325 in 5+ unit buildings).
Forward outlook
- Local home prices are declining (-3.0%/yr); year-one equity from $1k of loan paydown is wiped out by about $5k of value loss. Plan a longer hold.
- Eau Claire County population projected at +14% by 2050 — modest demand growth; plan on rents tracking national, not racing it.
Negotiation context
- It's been on market 35 days — a 3% lower offer ($175k) is reasonable based on typical stale-listing flexibility.
- 6 sale attempts since 17y ago with the ask held roughly flat each time — persistent listings suggest the price (not the market) is what's stuck; bring a comps-based counter.
- Current owner paid $140k; 29% above their basis — modest negotiation headroom, anchor on the comps not their cost.
Risks & watch-outs
- Watch-outs: built in 1922 — expect roof / HVAC / electrical / plumbing capex.
Questions for the listing agent
- What do current leases actually rent for vs. the listed asking? Can we see a recent rent roll and the last 12 months of T-12 income?
- It's been on market 35 days. Have you received any prior offers? Is the seller open to a 18% concession, seller financing, or rate buy-down credit?
- Built in 1922 — when were the roof, HVAC, electrical panel, plumbing, and water heater last replaced?
- Is there a deadline driving the sale (1031 exchange, divorce, estate, relocation)? That informs how much negotiation room exists.
- Schools are B-rated — typically a magnet for longer-tenancy family renters. What's the average tenant stay here, and is there a school-zone premium baked into asking?
- The area grade is low — what's the realistic commute time and amenity access for the typical tenant pool here? Any planned neighborhood developments (good or bad) we should know about?
- What's the average days-on-market for RENTAL listings here right now (not sales)? A rising rental-DOM trend means longer vacancies and softer asking-rent achievability than the comps imply.
- What's the recent tenant-quality profile in this submarket — average credit score on applications, eviction rate, late-payment / NSF rate, and stable-employment percentage? A property-management company in the area should have these aggregated.
- How much new for-sale + rental construction is in the pipeline within 1–3 miles? Heavy new supply typically softens prices + rents 12–24 months out; constrained supply supports both.
Investment metrics
- 1% rule
- 0.82% ✗
- Cap rate
- 6.09%
- Cash-on-cash
- -0.73%
- DSCR
- 0.97
- GRM
- 10.1
CMA / ARV
- ARV (median comp)
- $192,577
- List price
- $180,000
- Delta
- -6.53%
- Verdict
- FAIR
- Comps
- 20 within 1.0 mi
Show comp detail 12 sales within ~0.75 mi
| Address | Dist | Beds/Ba | Sqft | Sold | Price | $/sf | Match |
|---|---|---|---|---|---|---|---|
| 915 Platt St | 0.24mi | 2/1.5 | 858 (-2%) | 4mo | $152,000 | $177 | 81 |
| 2116 7th St | 0.43mi | 2/1.0 | 904 (+4%) | 14mo | $174,900 | $193 | 62 |
| 1819 9th St | 0.22mi | 2/1.0 | 769 (-12%) | 13mo | $175,000 | $228 | 59 |
| 2124 8th St | 0.43mi | 2/1.0 | 756 (-13%) | 1mo | $185,000 | $245 | 57 |
| 933 Cedar St | 0.52mi | 2/1.5 | 912 (+5%) | 11mo | $230,000 | $252 | 57 |
| 519 Cedar St | 0.58mi | 2/1.0 | 858 (-2%) | 22mo | $175,000 | $204 | 52 |
| 2024 1st St | 0.66mi | 2/1.5 | 780 (-11%) | 3mo | $200,000 | $256 | 48 |
| 524 Cedar St | 0.60mi | 2/1.0 | 832 (-5%) | 21mo | $181,000 | $218 | 47 |
| 910 Maple St | 0.40mi | 2/1.0 | 992 (+14%) | 19mo | $215,000 | $217 | 43 |
| 2208 5th St | 0.56mi | 2/1.5 | 980 (+12%) | 13mo | $267,000 | $272 | 41 |
| 531 Cedar St | 0.57mi | 2/1.0 | 966 (+11%) | 19mo | $169,900 | $176 | 40 |
| 508 Congress St | 0.66mi | 2/1.0 | 936 (+7%) | 21mo | $205,000 | $219 | 39 |
Match score weights: distance 35% · size 25% · config 20% · recency 20%. Top-matched comps best support the ARV.
Projected returns pro-forma
-3.0% appreciation · 2.01% rent growth · sell at horizon
- IRR
- -18.6%
- Equity multiple
- 0.35×
- Total profit
- $-32,595
- Equity at exit
- $26,839
- IRR
- -13.0%
- Equity multiple
- 0.27×
- Total profit
- $-36,806
- Equity at exit
- $15,563
Cash invested: $50,400 (down + closing). Projections, not guarantees.
Landlord ↔ Tenant lean methodology
- Overall (STATE)
- 73 Landlord-Friendly
- State Wisconsin
- 73 Landlord-Friendly · R+2
- County
- — inherits STATE
- City
- — inherits STATE
ZIP-level market 54703
- Rents YoY
- 2.0%
- Active inventory
- 212
- Price-to-rent
- 10.1×
Monthly cashflow live
- Estimated rent
- $1,484 high interval (Pro) →
- Mortgage (P&I)
- −$944
- Tax from tax record
- −$184 /mo · $2,207/yr
- Insurance
- −$75
- HOA
- −$0
- Vacancy / Maint / Mgmt
- −$312
- Net cashflow
- $-31
Break-even live
UW: 25.0% down · 7.5% · 30yr · 1.5% tax · 5.0% vac · 8.0% maint · 8.0% mgmt
Financing live
Cash to close
- Down payment
- $45,000
- Closing costs
- $5,400
- Reserves months
- —
- Total cash needed
- —
Loan-product check · same deal, 3 products live
Conventional
25% down · 7.5% · 30yr
- Down + closing
- —
- Monthly P&I
- —
- Monthly cashflow
- —
- DSCR
- —
- Eligible?
- —
Personal DTI + credit; lowest rate.
DSCR
20% down · 8.5% · 30yr
- Down + closing
- —
- Monthly P&I
- —
- Monthly cashflow
- —
- DSCR
- —
- Eligible?
- —
No personal income docs; deal must DSCR.
Hard money
10% down · 12.0% · 12mo
- Down + closing
- —
- Monthly P&I
- —
- Monthly cashflow
- —
- DSCR
- —
- Eligible?
- —
Short-term bridge; refi at stabilization.
Rent comps 17 comps
| Address | Beds | Baths | Sqft | Rent | $/sqft | DOM | Units | Dist |
|---|---|---|---|---|---|---|---|---|
| 2130 4th St Eau Claire, WI | 1.0 | 1.0 | 996 | $1,395 | $1.40 | 13d | 1 | 0.59mi |
| 1317 1st Ave Eau Claire, WI | 2.0 | 1.0 | 700 | $795 | $1.14 | 43d | 1 | 0.64mi |
| 2016 N Oxford Ave Eau Claire, WI | 2.0 | 1.0–2.0 | 1023 | $2,600 | $2.54 | 13d | 33 | 0.69mi |
| 218 10th Ave Eau Claire, WI | 3.0 | 2.0 | 810 | $1,275 | $1.57 | 13d | 1 | 0.79mi |
| 920 Oxford Ave Apt 7 Eau Claire, WI | 1.0 | 1.0 | 750 | $725 | $0.97 | 43d | 1 | 0.82mi |
| 1108 Meridian Heights Dr Apt 8 Eau Claire, WI | 2.0 | 1.0 | 800 | $825 | $1.03 | 21d | 1 | 0.86mi |
| 315 Riverfront Ter Eau Claire, WI | 1.0–2.0 | 1.0–2.0 | 974 | $1,725 | $1.77 | 43d | 10 | 0.89mi |
| 222 Wisconsin St Eau Claire, WI | 1.0–2.0 | 1.0 | 981 | $1,400 | $1.43 | 43d | 3 | 0.90mi |
| 224 N Barstow St Eau Claire, WI | 1.0–2.0 | 1.0–2.0 | 828 | $2,350 | $2.84 | 13d | 20 | 0.99mi |
| 100 N Farwell St Eau Claire, WI | 2.0 | 1.0–2.0 | 787 | $2,950 | $3.75 | 13d | 13 | 1.05mi |
| 325 Main St Eau Claire, WI | 2.0 | 1.0–2.0 | 777 | $2,300 | $2.96 | 43d | 39 | 1.20mi |
| 110 Niagara St Eau Claire, WI | 3.0 | 1.0 | 680 | $1,170 | $1.72 | 13d | 1 | 1.21mi |
| 2332 Peters Dr Unit 2332 Eau Claire, WI | 2.0 | 1.5 | 950 | $1,345 | $1.42 | 13d | 1 | 1.23mi |
| 816 Porter Ave Unit 207 Eau Claire, WI | 2.0 | 1.0 | 952 | $2,400 | $2.52 | 43d | 1 | 1.33mi |
| 816 Porter Ave Unit 211 Eau Claire, WI | 2.0 | 1.5 | 1074 | $2,450 | $2.28 | 43d | 1 | 1.33mi |
| 816 Porter Ave Eau Claire, WI | 2.0 | 1.0–1.5 | 1013 | $2,200 | $2.17 | 13d | 3 | 1.34mi |
| 1206 Pershing St Unit 2 Eau Claire, WI | 2.0 | 1.0 | 670 | $1,050 | $1.57 | 21d | 1 | 1.35mi |
Listing history 26 events
-
2026-06-19days on market $180,000 Active 35 DOM
-
2026-06-18days on market $180,000 Active 34 DOM
-
2026-06-17days on market $180,000 Active 33 DOM
-
2026-06-16days on market $180,000 Active 32 DOM
-
2026-06-15days on market $180,000 Active 31 DOM
-
2026-06-13days on market $180,000 Active 28 DOM
-
2026-06-10days on market $180,000 Active 26 DOM
-
2026-06-09days on market $180,000 Active 25 DOM
-
2026-06-08days on market $180,000 Active 24 DOM
-
2026-06-07days on market $180,000 Active 23 DOM
-
2026-06-05days on market $180,000 Active 20 DOM
-
2026-06-02days on market $180,000 Active 18 DOM
-
2026-06-01days on market $180,000 Active 17 DOM
-
2026-05-31days on market $180,000 Active 16 DOM
-
2026-05-30days on market $180,000 Active 15 DOM
-
2026-05-15$180,000 Active 217-char remark
Show marketing remark (211 chars)
This 2-bedroom, 1-bath cutie is set on a spacious lot just minutes from downtown Eau Claire and Half Moon Beach. With thoughtful updates throughout, a new roof, and a functional layout, this one won?t last long.
-
2026-05-15$180,000 Active 217-char remark
Show marketing remark (211 chars)
This 2-bedroom, 1-bath cutie is set on a spacious lot just minutes from downtown Eau Claire and Half Moon Beach. With thoughtful updates throughout, a new roof, and a functional layout, this one won?t last long.
-
2026-05-15$180,000 Active 211-char remark
Show marketing remark (211 chars)
This 2-bedroom, 1-bath cutie is set on a spacious lot just minutes from downtown Eau Claire and Half Moon Beach. With thoughtful updates throughout, a new roof, and a functional layout, this one won?t last long.
-
2022-06-03soldstatus $140,000
-
2022-06-03soldstatus $140,000
-
2017-02-07soldstatus $83,800
-
2009-07-23soldstatus $56,000
-
2009-06-26historical
-
2009-06-01$64,900
-
2004-08-27soldstatus $70,000
-
1997-11-01soldstatus $40,000
ⓘ Source: listings_history table (triggers on properties + properties_extension) + one-shot
backfill from property_details.listing_events for pre-trigger history.
Tax reassessment forecast WI · Partial reset (capped growth)
- Current annual tax
- $2,207 · $184/mo
- Projected year-2 tax
- $2,769 · $231/mo
- Expected delta
- +$561/yr (+$47/mo · 25.4%)
ⓘ Screening estimate from a state-policy table — verify with the county assessor before closing.
Climate risk First Street
- Flood 1/10 Low FEMA zone X (unshaded) · 0% chance over 30 yrs
- Wildfire 3/10 Moderate
- Heat 2/10 Low 7 d/yr ≥98°F today · 14 d/yr by 30 yrs out
- Wind 1/10 Low
- Air quality 2/10 Low 1 unhealthy d/yr today · 1 by 30 yrs out
Nearby sold comps map
Loading sold comps map…
Walkable amenities ~0.75 mi
Loading nearby amenities…
Taxation est. · year 1
- Rental income
- $17,804
- − Mortgage interest
- −$10,083
- − Property taxes
- −$2,207
- − Insurance
- −$900
- − Repairs & maintenance
- −$1,424
- − Management
- −$1,424
- − Depreciation
- −$5,236
- Taxable loss
- −$3,471
- Est. tax savings @ 24.0%
- +$833
- After-tax cash flow
- $464/yr
For passive investors: Depreciation is non-cash, so a rental often shows a tax loss while cash-flowing — sheltering income. Rental losses are passive: they offset passive income freely, and up to $25,000/yr can offset ordinary (W-2) income if you actively participate and your MAGI is under $100k (phasing out to $0 by $150k); unused losses carry forward. On sale, claimed depreciation is recaptured at up to 25%, and gains may owe capital-gains tax (a 1031 exchange can defer both). Figures are a year-1 estimate at your 24.0% rate — not tax advice; consult a CPA.
Schools (NCES district)
- District
- Eau Claire Area School District
- NCES district ID
- 5504050
- Math proficiency
- 38% ▼ -9.00%
- Reading proficiency
- 43% ▬ 0.00%
- Median HH income
- $48,206
- Composite
- 34.72/100
- National rank
- #5135
- State rank
- #150 of 342 in WI
Livability — Eau Claire
- Score
- 89/100
- State rank
- #10
- US rank
- #121
Category grades
Schools grade is shown separately in the Schools card above.
Census & demographics
- Census place
- Eau Claire, WI
- County
- Eau Claire County · 96,114 people
- City population
- 87,167
- Metro
- Eau Claire, WI
- Population (ZIP)
- 44,153
- Household income
- $71,518
- Rent vs Own
- Severe rent burden
- 1614.0
Population outlook (Eau Claire County) Hauer SSP2
- Today (2025)
- 109,006 people
- By 2030
- 112,587 · +3.3%
- By 2040
- 118,674 · +8.9%
- By 2050
- 124,085 · +13.8%
- By 2075
- 135,804 · +24.6%
- By 2100
- 139,875 · +28.3%
Race, ethnicity, and origin ACS 2023
- Neighborhood character
- Predominantly White (85%)
- Race & ethnicity
- White 85% Asian 6% Two or more races 4% Hispanic / Latino 4% Black 2%
- Common ancestry
- Portuguese 16% Romanian 5% Lithuanian 3%
- Foreign-born
- 3% · Canada, China
- Languages at home
- 92% English-only · Other Asian/Pacific 4% Spanish 3%
Political lean MEDSL · Eau Claire
- 2024 margin
- D (+10.6) · D 54.6% · R 44.0% · Other 1.4%
- 2008→2024 swing
- -11.6pp toward R · 2008: 22.1pp · 2024: 10.6pp
- All cycles
- 2024: D+10.6 2020: D+10.8 2016: D+7.3 2012: D+13.6 2008: D+22.1
Not yet ingested
- Civics
- —
Market trends
- HPI YoY
- ▼ -276.20%
- Current HPI
- 218.2747
- Rent YoY
- ▲ 2.01%
- Metro
- Eau Claire, WI
- State GDP YoY
- ▲ 2.10%
- F500 in state
- 20
Industry mix (Fortune 500 HQ in WI)
| Industry | F500 HQs | Revenue |
|---|---|---|
| Industrial Machinery | 4 | $23B |
|
||
| Industrial Technology | 2 | $36B |
|
||
| Insurance | 1 | $36B |
|
||
| Professional Services | 1 | $19B |
|
||
| Utilities | 1 | $9B |
|
||
| Consumer Goods | 1 | $3B |
|
||
Price history
+350.0% since first listed16 events — show timeline
- 2026-05-21 Relisted — WWRA
- 2026-05-21 Relisted — NORTHSTARMLS as Distributed by MLS Grid
- 2026-05-21 Contingent — RANWW
- 2026-05-21 Contingent — WWRA
- 2026-05-21 Contingent — NORTHSTARMLS as Distributed by MLS Grid
- 2026-05-15 Listed $180,000 RANWW
- 2026-05-15 Listed $180,000 NORTHSTARMLS as Distributed by MLS Grid
- 2026-05-15 Listed $180,000 WWRA
- 2022-06-03 Sold (Public Records) $140,000 Public Records
- 2022-06-03 Sold (Public Records) $140,000 Public Records
- 2017-02-07 Sold (Public Records) $83,800 Public Records
- 2009-07-23 Sold (MLS) $56,000 NORTHSTARMLS as Distributed by MLS Grid
- 2009-06-26 Listing Removed — NORTHSTARMLS as Distributed by MLS Grid
- 2009-06-01 Listed $64,900 NORTHSTARMLS as Distributed by MLS Grid
- 2004-08-27 Sold (Public Records) $70,000 Public Records
- 1997-11-01 Sold (Public Records) $40,000 Public Records
Property tax history
+4.0%/yrLatest (2025): $2,207 · +2.2% YoY. Source: county tax records.
Cash-flow waterfall
monthlySold comps — $/sqft
last 12 mo · ≤1 miLoading sold comps…