760 Mcallister Ave · Columbus, OH
Flood risk 1/10 · Minimal
- FEMA flood zone
- X (unshaded)
- Chance of flooding over 30 yrs
- 0.0%
- Est. flood insurance / yr
- $473 – $860
Fire risk 1/10 · Minimal
- Est. fire insurance / yr
- $713 – $1,323
Heat risk 3/10 · Minor
- Hot days now (above 100°F)
- 6 days/yr
- Hot days in 30 yrs
- 15 days/yr
Wind risk 2/10 · Minimal
- Chance of severe wind over 30 yrs
- 1.0%
Air-quality risk 3/10 · Minor
- Unhealthy air days now
- 2 days/yr
- Unhealthy air days in 30 yrs
- 4 days/yr
Risk factors via First Street. Map © Google.
Why this score? — see what drove the B- grade
The composite is a weighted blend of 9 inputs, each scored 0–100. Each bar is that input's sub-score; the figure is the points it added to the 100-point composite (weight × sub-score).
- Cash flow +30.0/30.0
- 1% rule +10.0/10.0
- DSCR +10.0/10.0
- ARV discount +7.5/15.0
- Livability +4.0/5.0
- Rent growth +2.9/5.0
- Condition / age +2.5/5.0
- Schools +1.7/10.0
- Appreciation +0.0/10.0
$129,900
🖨 Deal sheet (PDF) 📄 Offer letter ✓ Due diligence
Listing remarks MLS
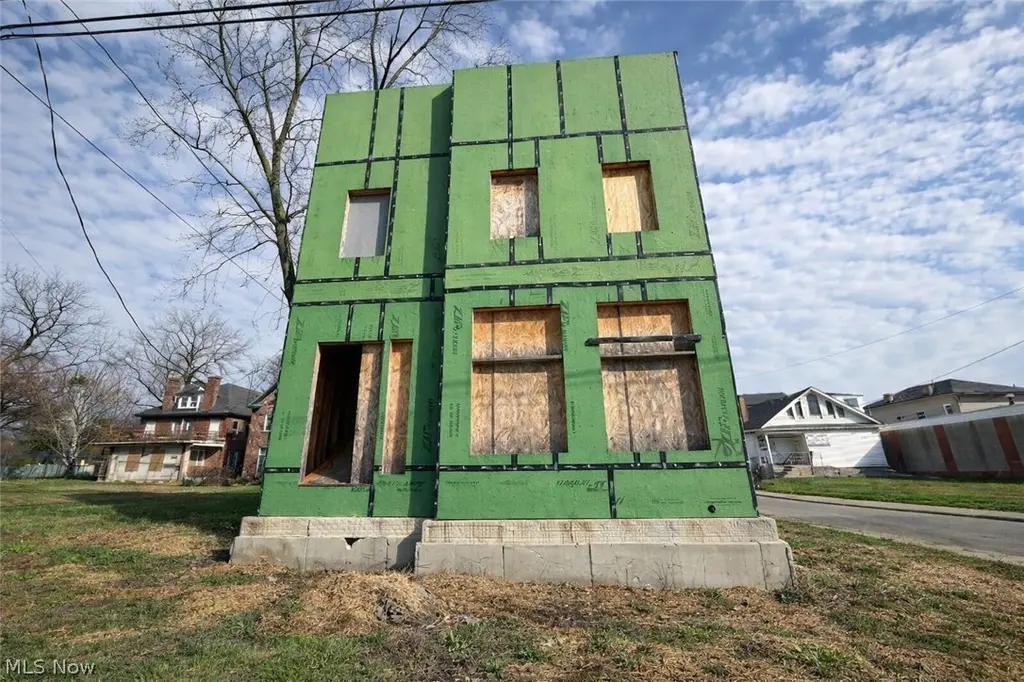
Come check out this lovely lot that is ripe for development! Plans have been approved for a single family home with an attached garage. If you're struggling in the hot housing market, this is a great option to build a new home.
Key facts
- 2 story structure
- Rooftop terrace
- Multi level layout
Tags
Property features AI
Exterior
- Parking: Driveway
- Utilities: Public water; Public sewer
- Home design: 2 stories; Flat roof; Frame construction with wood siding; Full, unfinished basement
- Construction: Built according to public records; Above-grade finished area approximately 2,228
- Exterior features: Terrace
Interior
- Bedrooms: 3 main-level bedrooms
- Bathrooms: 2 full bathrooms; 1 half bathroom; 3 main-level bathrooms
- Interior features: Has a view; Under construction
Neighborhood map
What this means for you Summary
Snapshot
- This is a 3-bed/2.5-bath land listed at $130k.
Deal economics
- At list price, monthly cash flow is $753 ($9k/yr) — positive.
- The deal already cash-flows at list — no discount required.
- Meets the 1% rule at list price ($2k rent vs $130k).
- Recommended offer: $126k (3.0% below list) — sets the bar for market timing.
- Cap rate 13.3% vs local median 3.8% in Columbus — top-decile yield for the area; either an underpriced asset or a hidden risk that comps aren't pricing in. Stress-test before assuming the spread holds.
Location & tenants
- Location reads 81/100 on livability (#97 in OH, #1,491 nationally) — a professional / high-income tenant draw. Strengths: commute A+, cost of living A+, housing A+; Watch: employment C-, crime F.
- Columbus City School District (urban): math 15% / reading 26% proficiency, ranked #626 of 656 in OH (top 95%) — low school quality limits family demand, transient renter base, plan for 1-2y turnover; 72% free/reduced lunch — lower-income household profile, screen leases tightly.
- Zoned schools: Indianola Informal K-8 School (math 43% / reading 58%, grade D+, #896 of 1,584 statewide, top 57%, 684 students, 0% FRL); Arts Impact Middle School (Aims) (math 17% / reading 25%, grade F, #608 of 654 statewide, top 93%, 532 students, 0% FRL); Columbus Alternative High School (math 27% / reading 74%, grade D+, #380 of 781 statewide, top 49%, 758 students, 0% FRL) — zoned schools average 0% FRL vs 72% district-wide (72 pts lower); this property's tenant base skews higher-income than the district average.
- Zoned-school proficiency averages 41% at this address vs 20% district-wide (+20 pts) — the actual schools serving this property are materially stronger than the Columbus City School District average implies; a family-tenant draw the district grade alone would hide.
- Market conditions: Rents rising (+1.4%/yr); 145 active listings in the ZIP; 40 comparable units currently listed for rent nearby; rentals at typical pace (median 25d on market — plan ~3-4 weeks tenant-placement turnaround); 40% of comp listings sitting > 30 days — soft ceiling on asking rent; 8,139 units permitted in Franklin County in 2024 (5,940 in 5+ unit buildings).
- This rent runs 42% of the median local income ($60k/yr) — at the standard rent-burdened threshold; future hikes will face affordability resistance.
Forward outlook
- Local home prices are declining (-3.0%/yr); year-one equity from $898 of loan paydown is wiped out by about $4k of value loss. Plan a longer hold.
- Franklin County population projected at +34% by 2050 — long-run rental-demand tailwind backs the buy-and-hold thesis.
- At projected returns (-3.0% appreciation + 1.4% rent growth), your $36k cash investment doubles in ~6 years — after that, you're playing with house money.
Negotiation context
- It's been on market 34 days — a 3% lower offer ($126k) is reasonable based on typical stale-listing flexibility.
- 4 sale attempts since 6y ago; this cycle's ask has dropped $20k (13%) from the opening price — seller is motivated, your offer sets the floor, not the list.
- Current owner paid $59k; list at $130k implies a 120% gain — meaningful room to come down on a strong offer.
Questions for the listing agent
- It's been on market 34 days. Have you received any prior offers? Is the seller open to a 3% concession, seller financing, or rate buy-down credit?
- Is there a deadline driving the sale (1031 exchange, divorce, estate, relocation)? That informs how much negotiation room exists.
- Crime grade is F in this area — have there been break-ins, vandalism, or insurance claims at this property in the last 3 years? What carrier currently insures it and at what premium?
- What's the average days-on-market for RENTAL listings here right now (not sales)? A rising rental-DOM trend means longer vacancies and softer asking-rent achievability than the comps imply.
- What's the recent tenant-quality profile in this submarket — average credit score on applications, eviction rate, late-payment / NSF rate, and stable-employment percentage? A property-management company in the area should have these aggregated.
- How much new for-sale + rental construction is in the pipeline within 1–3 miles? Heavy new supply typically softens prices + rents 12–24 months out; constrained supply supports both.
Investment metrics
- 1% rule
- 1.61% ✓
- Cap rate
- 13.25%
- Cash-on-cash
- 24.85%
- DSCR
- 2.11
- GRM
- 5.2
CMA / ARV
No comps found within radius.
Projected returns pro-forma
-3.0% appreciation · 1.43% rent growth · sell at horizon
- IRR
- 16.5%
- Equity multiple
- 1.65×
- Total profit
- $23,704
- Equity at exit
- $19,369
- IRR
- 23.9%
- Equity multiple
- 2.91×
- Total profit
- $69,618
- Equity at exit
- $11,231
Cash invested: $36,372 (down + closing). Projections, not guarantees.
Landlord ↔ Tenant lean methodology
- Overall (STATE)
- 73 Landlord-Friendly
- State Ohio
- 73 Landlord-Friendly · R+6
- County
- — inherits STATE
- City
- — inherits STATE
ZIP-level market 43205
- Rents YoY
- 1.4%
- Active inventory
- 145
- Price-to-rent
- 5.2×
Monthly cashflow live
- Estimated rent
- $2,090 high interval (Pro) →
- Mortgage (P&I)
- −$681
- Tax est. 1.5%
- −$162 /mo · $1,948/yr
- Insurance
- −$54
- HOA
- −$0
- Vacancy / Maint / Mgmt
- −$439
- Net cashflow
- $753
Break-even live
Sensitivity live
| Price | -10% $843 | -5% $798 | +0% $753 | +5% $708 | +10% $663 |
|---|---|---|---|---|---|
| Rent | -10% $588 | -5% $671 | +0% $753 | +5% $836 | +10% $918 |
| Rate | -1.0pp $819 | -0.5pp $786 | base $753 | +0.5pp $720 | +1.0pp $685 |
UW: 25.0% down · 7.5% · 30yr · 1.5% tax · 5.0% vac · 8.0% maint · 8.0% mgmt
Financing live
Cash to close
- Down payment
- $32,475
- Closing costs
- $3,897
- Reserves months
- —
- Total cash needed
- —
Loan-product check · same deal, 3 products live
Conventional
25% down · 7.5% · 30yr
- Down + closing
- —
- Monthly P&I
- —
- Monthly cashflow
- —
- DSCR
- —
- Eligible?
- —
Personal DTI + credit; lowest rate.
DSCR
20% down · 8.5% · 30yr
- Down + closing
- —
- Monthly P&I
- —
- Monthly cashflow
- —
- DSCR
- —
- Eligible?
- —
No personal income docs; deal must DSCR.
Hard money
10% down · 12.0% · 12mo
- Down + closing
- —
- Monthly P&I
- —
- Monthly cashflow
- —
- DSCR
- —
- Eligible?
- —
Short-term bridge; refi at stabilization.
Rent comps 40 comps
| Address | Beds | Baths | Sqft | Rent | $/sqft | DOM | Units | Dist |
|---|---|---|---|---|---|---|---|---|
| 741-743 E Mound St Columbus, OH | 3.0 | 1.5 | 1528 | $1,645 | $1.08 | 45d | 1 | 0.11mi |
| 741-743 E Mound St Columbus, OH | 3.0 | 1.5 | 1528 | $1,645 | $1.08 | 9d | 1 | 0.11mi |
| 173 S 18th St Columbus, OH | 3.0 | 2.5 | 1884 | $2,649 | $1.41 | 25d | 1 | 0.25mi |
| 965 E Rich St Unit 965 Columbus, OH | 3.0 | 1.0 | 2184 | $1,600 | $0.73 | 25d | 1 | 0.28mi |
| 122 Parsons Ave Columbus, OH | 3.0 | 1.0–2.0 | 1135 | $2,550 | $2.25 | 3d | 10 | 0.29mi |
| 834 Oak St Unit 834 Columbus, OH | 3.0 | 2.5 | 1450 | $2,500 | $1.72 | 21d | 1 | 0.36mi |
| 834 Oak St Columbus, OH | 3.0 | 2.5 | 1400 | $2,500 | $1.79 | 9d | 1 | 0.36mi |
| 830 Oak St Unit 830 Columbus, OH | 3.0 | 2.5 | 1450 | $2,500 | $1.72 | 21d | 1 | 0.36mi |
| 848 Oak St Columbus, OH | 3.0 | 1.5 | 1428 | $1,700 | $1.19 | 45d | 1 | 0.37mi |
| 830 Oak St Columbus, OH | 3.0 | 2.5 | 1451 | $2,500 | $1.72 | 9d | 1 | 0.37mi |
| 844-848 Oak St Unit 848 Columbus, OH | 3.0 | 1.5 | 1517 | $1,700 | $1.12 | 45d | 1 | 0.37mi |
| 71 S Douglass St Columbus, OH | 2.0 | 1.0 | 1585 | $1,550 | $0.98 | 17d | 1 | 0.38mi |
| 65-71 S Douglass St Columbus, OH | 2.0 | 1.0 | 1585 | $1,550 | $0.98 | 18d | 1 | 0.38mi |
| 282-284 S Ohio Ave Columbus, OH | 3.0 | 2.0 | 1477 | $1,699 | $1.15 | 25d | 1 | 0.48mi |
| 498 S Ohio Ave Unit A Columbus, OH | 2.0 | 1.0 | 2582 | $1,500 | $0.58 | 45d | 1 | 0.48mi |
| 668 Wager St Columbus, OH | 3.0 | 2.0 | 1492 | $2,095 | $1.40 | 21d | 1 | 0.54mi |
| 1096 Oak St Columbus, OH | 2.0 | 2.5 | 1487 | $2,099 | $1.41 | 4d | 1 | 0.54mi |
| 508 Jackson St Unit 510 Columbus, OH | 2.0 | 1.0 | 1848 | $1,700 | $0.92 | 45d | 1 | 0.55mi |
| 196 S Grant Ave #307 Columbus, OH | 2.0 | 2.0 | 1442 | $2,100 | $1.46 | 20d | 1 | 0.58mi |
| 698 S 22nd St Columbus, OH | 3.0 | 3.5 | 2400 | $2,500 | $1.04 | 45d | 1 | 0.60mi |
| 890 E Livingston Ave #892 Columbus, OH | 3.0 | 1.0 | 2430 | $1,400 | $0.58 | 14d | 1 | 0.61mi |
| 598 Lathrop St #6 Columbus, OH | 2.0 | 2.5 | 2156 | $4,500 | $2.09 | 9d | 1 | 0.64mi |
| 683 S Champion Ave Unit 683 Columbus, OH | 3.0 | 1.0 | 2728 | $1,700 | $0.62 | 45d | 1 | 0.65mi |
| 627 Oakwood Ave Columbus, OH | 3.0 | 2.5 | 2009 | $2,379 | $1.18 | 14d | 1 | 0.65mi |
| 64 N 20th St Columbus, OH | 2.0 | 1.0 | 1400 | $1,495 | $1.07 | 9d | 1 | 0.67mi |
| 143 Sherman Ave Unit 301 Columbus, OH | 3.0 | 2.0 | 1630 | $2,450 | $1.50 | 3d | 1 | 0.69mi |
| 746 Beech St Columbus, OH | 3.0 | 2.0 | 1610 | $2,750 | $1.71 | 45d | 1 | 0.76mi |
| 310 E Beck St Columbus, OH | 3.0 | 2.5 | 2265 | $3,995 | $1.76 | 45d | 1 | 0.77mi |
| 705 E Columbus St Columbus, OH | 3.0 | 1.0 | 1436 | $2,300 | $1.60 | 45d | 1 | 0.81mi |
| 484-488 E Columbus St Columbus, OH | 2.0 | 1.5 | 2316 | $1,650 | $0.71 | 45d | 1 | 0.81mi |
| 263 N Monroe Ave Columbus, OH | 4.0 | 2.0 | 1616 | $2,399 | $1.48 | 45d | 1 | 0.86mi |
| 813 Wilson Ave Unit 1 Columbus, OH | 3.0 | 1.5 | 1400 | $1,500 | $1.07 | 9d | 1 | 0.87mi |
| 815 Wilson Ave Columbus, OH | 3.0 | 1.5 | 1400 | $1,500 | $1.07 | 9d | 1 | 0.87mi |
| 315 E Long St Columbus, OH | 2.0 | 1.0–2.0 | 939 | $2,222 | $2.37 | 4d | 32 | 0.89mi |
| 936 Wagner St Columbus, OH | 3.0 | 3.0 | 1560 | $2,750 | $1.76 | 25d | 1 | 0.90mi |
| 90 Normandy Ave Unit TH66 Columbus, OH | 2.0 | 2.5 | 1530 | $3,000 | $1.96 | 45d | 1 | 0.90mi |
| 857 Wilson Ave #859 Columbus, OH | 3.0 | 2.5 | 1527 | $1,650 | $1.08 | 45d | 1 | 0.91mi |
| 966 S 18th St Columbus, OH | 3.0 | 1.5 | 1428 | $2,400 | $1.68 | 45d | 1 | 0.93mi |
| 1402 Fair Ave Columbus, OH | 3.0 | 2.5 | 2563 | $2,350 | $0.92 | 17d | 1 | 0.95mi |
| 250 N 21st St Columbus, OH | 3.0 | 2.5 | 1452 | $2,600 | $1.79 | 45d | 1 | 0.96mi |
Listing history 25 events
-
2026-06-21days on market $129,900 Active 34 DOM
-
2026-06-18days on market $129,900 Active 31 DOM
-
2026-06-17days on market $129,900 Active 30 DOM
-
2026-06-16days on market $129,900 Active 29 DOM
-
2026-06-15days on market $129,900 Active 28 DOM
-
2026-06-13days on market $129,900 Active 26 DOM
-
2026-06-13pricedays on market $129,900 Active 25 DOM
-
2026-06-09days on market $134,900 Active 22 DOM
-
2026-06-08days on market $134,900 Active 21 DOM
-
2026-06-07days on market $134,900 Active 20 DOM
-
2026-06-05days on market $134,900 Active 17 DOM
-
2026-06-03days on market $134,900 Active 16 DOM
-
2026-06-02days on market $134,900 Active 15 DOM
-
2026-06-01days on market $134,900 Active 14 DOM
-
2026-05-31days on market $134,900 Active 13 DOM
-
2026-05-18$149,900 Active
-
2022-04-15soldstatus $59,000 Closed 227-char remark
Show marketing remark (227 chars)
Come check out this lovely lot that is ripe for development! Plans have been approved for a single family home with an attached garage. If you're struggling in the hot housing market, this is a great option to build a new home.
-
2022-01-28status Pending 227-char remark
Show marketing remark (227 chars)
Come check out this lovely lot that is ripe for development! Plans have been approved for a single family home with an attached garage. If you're struggling in the hot housing market, this is a great option to build a new home.
-
2022-01-11price $60,000 227-char remark
Show marketing remark (227 chars)
Come check out this lovely lot that is ripe for development! Plans have been approved for a single family home with an attached garage. If you're struggling in the hot housing market, this is a great option to build a new home.
-
2021-11-29status Active 227-char remark
Show marketing remark (227 chars)
Come check out this lovely lot that is ripe for development! Plans have been approved for a single family home with an attached garage. If you're struggling in the hot housing market, this is a great option to build a new home.
-
2021-11-07historical 227-char remark
Show marketing remark (227 chars)
Come check out this lovely lot that is ripe for development! Plans have been approved for a single family home with an attached garage. If you're struggling in the hot housing market, this is a great option to build a new home.
-
2021-05-06$72,000 Active 227-char remark
Show marketing remark (227 chars)
Come check out this lovely lot that is ripe for development! Plans have been approved for a single family home with an attached garage. If you're struggling in the hot housing market, this is a great option to build a new home.
-
2021-04-27historical
-
2020-10-30price $77,500
-
2020-09-11$79,990 Active
ⓘ Source: listings_history table (triggers on properties + properties_extension) + one-shot
backfill from property_details.listing_events for pre-trigger history.
Climate risk First Street
- Flood 1/10 Low FEMA zone X (unshaded) · 0% chance over 30 yrs
- Wildfire 1/10 Low
- Heat 3/10 Moderate 6 d/yr ≥100°F today · 15 d/yr by 30 yrs out
- Wind 2/10 Low 100% chance of damaging wind over 30 yrs
- Air quality 3/10 Moderate 2 unhealthy d/yr today · 4 by 30 yrs out
Nearby sold comps map
Loading sold comps map…
Walkable amenities ~0.75 mi
Loading nearby amenities…
Taxation est. · year 1
- Rental income
- $25,077
- − Mortgage interest
- −$7,276
- − Property taxes
- −$1,948
- − Insurance
- −$650
- − Repairs & maintenance
- −$2,006
- − Management
- −$2,006
- − Depreciation
- −$3,779
- Taxable income
- $7,412
- Est. tax owed @ 24.0%
- −$1,779
- After-tax cash flow
- $7,260/yr
For passive investors: Depreciation is non-cash, so a rental often shows a tax loss while cash-flowing — sheltering income. Rental losses are passive: they offset passive income freely, and up to $25,000/yr can offset ordinary (W-2) income if you actively participate and your MAGI is under $100k (phasing out to $0 by $150k); unused losses carry forward. On sale, claimed depreciation is recaptured at up to 25%, and gains may owe capital-gains tax (a 1031 exchange can defer both). Figures are a year-1 estimate at your 24.0% rate — not tax advice; consult a CPA.
Schools (NCES district)
- District
- Columbus City School District
- NCES district ID
- 3904380
- Math proficiency
- 15% ▼ -17.00%
- Reading proficiency
- 26% ▼ -12.00%
- Median HH income
- $38,483
- Composite
- 17.19/100
- National rank
- #9105
- State rank
- #626 of 656 in OH
Livability — Columbus
- Score
- 81/100
- State rank
- #97
- US rank
- #1491
Category grades
Schools grade is shown separately in the Schools card above.
Census & demographics
- Census place
- Columbus, OH
- County
- Franklin County · 1,351,780 people
- City population
- 612,189
- Metro
- Columbus, OH
- Population (ZIP)
- 12,618
- Household income
- $60,181
- Rent vs Own
- Severe rent burden
- 823.0
Population outlook (Franklin County) Hauer SSP2
- Today (2025)
- 1,456,139 people
- By 2030
- 1,556,890 · +6.9%
- By 2040
- 1,757,349 · +20.7%
- By 2050
- 1,950,539 · +34.0%
- By 2075
- 2,376,171 · +63.2%
- By 2100
- 2,636,796 · +81.1%
Race, ethnicity, and origin ACS 2023
- Neighborhood character
- Diverse neighborhood (Simpson 0.60)
- Race & ethnicity
- Black 47% White 42% Two or more races 7% Hispanic / Latino 3% Asian 1%
- Common ancestry
- Lithuanian 2% Slovak 2% Romanian 2%
- Foreign-born
- 3% · Canada
- Languages at home
- 95% English-only · Spanish 1% Other Asian/Pacific 1% Other Indo-European 1%
Political lean MEDSL · Franklin
- 2024 margin
- Strong D (+28.4) · D 63.7% · R 35.3% · Other 1.0%
- 2008→2024 swing
- +7.7pp toward D · 2008: 20.7pp · 2024: 28.4pp
- All cycles
- 2024: D+28.4 2020: D+31.4 2016: D+25.9 2012: D+21.7 2008: D+20.7
Not yet ingested
- Civics
- —
Market trends
- HPI YoY
- ▼ -282.36%
- Current HPI
- 212.5692
- Rent YoY
- ▲ 1.43%
- Metro
- Columbus, OH
- State GDP YoY
- ▲ 1.98%
- F500 in state
- 48
Industry mix (Fortune 500 HQ in OH)
| Industry | F500 HQs | Revenue |
|---|---|---|
| Insurance | 3 | $145B |
|
||
| Industrial Machinery | 3 | $49B |
|
||
| Financial Services | 3 | $24B |
|
||
| Consumer Goods | 2 | $93B |
|
||
| Aerospace / Defense | 2 | $47B |
|
||
| Utilities | 2 | $33B |
|
||
Price history
+87.4% since first listed10 events — show timeline
- 2026-05-18 Listed $149,900 MLSNOW
- 2022-04-15 Sold (MLS) $59,000 CBRMLS
- 2022-01-28 Pending — CBRMLS
- 2022-01-11 Price Changed $60,000 CBRMLS
- 2021-11-29 Relisted — CBRMLS
- 2021-11-07 Listing Removed — CBRMLS
- 2021-05-06 Listed $72,000 CBRMLS
- 2021-04-27 Listing Removed — CBRMLS
- 2020-10-30 Price Changed $77,500 CBRMLS
- 2020-09-11 Listed $79,990 CBRMLS
Cash-flow waterfall
monthlySold comps — $/sqft
last 12 mo · ≤1 miLoading sold comps…