2533 Guineas Ln · Krugerville, TX
Flood risk 1/10 · Minimal
- FEMA flood zone
- X (unshaded)
- Chance of flooding over 30 yrs
- 0.0%
- Est. flood insurance / yr
- $507 – $1,088
Fire risk 6/10 · Moderate
- Est. fire insurance / yr
- $1,222 – $2,270
Heat risk 6/10 · Moderate
- Hot days now (above 109°F)
- 6 days/yr
- Hot days in 30 yrs
- 19 days/yr
Wind risk 5/10 · Moderate
- Chance of severe wind over 30 yrs
- 26.0%
Air-quality risk 3/10 · Minor
- Unhealthy air days now
- 3 days/yr
- Unhealthy air days in 30 yrs
- 4 days/yr
Risk factors via First Street. Map © Google.
Why this score? — see what drove the D+ grade
The composite is a weighted blend of 9 inputs, each scored 0–100. Each bar is that input's sub-score; the figure is the points it added to the 100-point composite (weight × sub-score).
- ARV discount +15.0/15.0
- Cash flow +12.7/30.0
- Schools +4.6/10.0
- Condition / age +4.0/5.0
- 1% rule +3.9/10.0
- DSCR +3.8/10.0
- Livability +3.2/5.0
- Rent growth +2.0/5.0
- Appreciation +0.0/10.0
$252,999
🖨 Deal sheet 📄 Offer letter ✓ Due diligence
Listing remarks
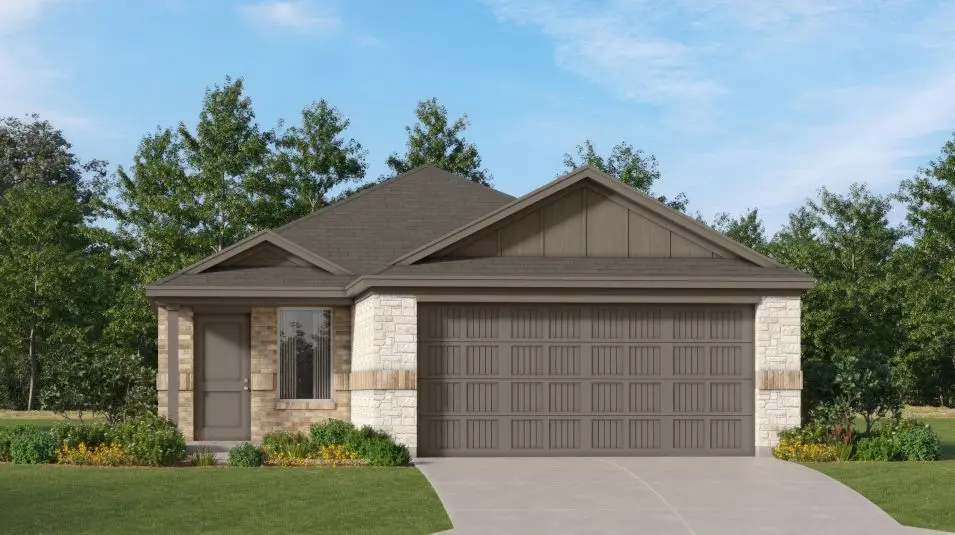
LENNAR - Highpointe Ranch - This single-level home showcases a spacious open floorplan shared between the kitchen, dining area and family room for easy entertaining during gatherings. An owner’s suite enjoys a private location in a rear corner of the home, complemented by an en-suite bathroom and walk-in closet. There are three secondary bedrooms along the side of the home, which are comfortable spaces for household members and overnight guests.
Key facts
- Walk-in closet
- Open floorplan
- Secondary bedrooms
Tags
Property features AI
Finance
- Financial info: Accepts Cash, Conventional, FHA, USDA Loan, VA Loan
- HOA & community: Mandatory association; Annual association fee of $600; Association provides full use of facilities and management services (Legacy Southwest Property Management)
Exterior
- Parking: Attached 2-car garage (garage faces front); 2 covered parking spaces
- Security: Prewired security; Smoke detector(s)
- Utilities: City water; City sewer; Concrete, curbs, and sidewalk access
- Home design: Single family residence; One story; New construction (incomplete, 2026); Not attached to another property; Subdivision: Highpointe Ranch
- Construction: Brick and other exterior materials; New construction (2026)
- Exterior features: Covered porch(es); Gutters; Wood fencing; Landscaped yard; Sprinkler system
Interior
- Kitchen: Dishwasher; Disposal; Gas range; Microwave; Natural stone/granite countertops; Breakfast bar; Built-in cabinets; Walk-in pantry; Water line to refrigerator; Plumbed for gas in kitchen; Vented exhaust fan
- Bedrooms: 4 bedrooms (all on the main level); Primary bedroom with walk-in closet
- Flooring: Carpet; Luxury vinyl plank
- Bathrooms: 2 full bathrooms
- Heating & cooling: Electric heating; Central air conditioning
- Interior features: Open floorplan; Built-in features; Decorative lighting; Cable TV available; High-speed internet available; Pantry; Walk-in closet(s)
- Laundry & utility: Tankless water heater
Neighborhood map
What this means for you Summary
Snapshot
- This is a 4-bed/2.0-bath single-family listed at $253k. Condition is rated good.
Deal economics
- At list price, monthly cash flow is $-26 ($-317/yr) — negative.
- To cash-flow at today's rent, offer at most $249k (1.5% below list).
- To meet the 1% rule (rent ≥ 1% of price), the offer needs to be $224k (11.3% below list).
- Recommended offer: $224k (11.3% below list) — sets the bar for 1% rule.
- Cap rate 6.2% vs local median 3.2% in Krugerville — top-decile yield for the area; either an underpriced asset or a hidden risk that comps aren't pricing in. Stress-test before assuming the spread holds.
Location & tenants
- Location reads 65/100 on livability (#672 in TX) — a middle-class / working-renter tenant base. Strengths: crime A+, employment A+, housing A+; Watch: amenities F, commute F, health & safety F.
- Aubrey ISD (rural): math 50% / reading 52% proficiency, ranked #119 of 826 in TX (top 14%) — acceptable for families but not a draw, mixed tenant base, ~2y average lease.
- Zoned schools: Jackie Fuller El (math 47% / reading 52%, grade D, #865 of 4,322 statewide, top 21%, 735 students, 39% FRL).
- Market conditions: Rents soft (-1.9%/yr); 1885 active listings in the ZIP; 14 comparable units currently listed for rent nearby; rentals at typical pace (median 17d on market — plan ~3-4 weeks tenant-placement turnaround); high-income renter base; 10,531 units permitted in Denton County in 2024 (2,713 in 5+ unit buildings).
Forward outlook
- Local home prices are declining (-3.0%/yr); year-one equity from $2k of loan paydown is wiped out by about $8k of value loss. Plan a longer hold.
- Denton County population projected at +66% by 2050 — long-run rental-demand tailwind backs the buy-and-hold thesis.
Negotiation context
- It's been on market 43 days — a 3% lower offer ($245k) is reasonable based on typical stale-listing flexibility.
Risks & watch-outs
- Climate carrying-cost: moderate wind risk, 26% chance of damaging wind over 30y; major wildfire risk; extreme-heat days projected 6→19/yr by 2055 (HVAC capex compounding) — expect insurance premiums to compound above CPI over the hold.
Questions for the listing agent
- What do current leases actually rent for vs. the listed asking? Can we see a recent rent roll and the last 12 months of T-12 income?
- It's been on market 43 days. Have you received any prior offers? Is the seller open to a 11% concession, seller financing, or rate buy-down credit?
- What does the HOA fee cover, when was the last increase, and are there any pending special assessments or reserve-fund shortfalls?
- Is there a deadline driving the sale (1031 exchange, divorce, estate, relocation)? That informs how much negotiation room exists.
- Schools are D-rated, which usually means shorter tenancies and higher turnover. Who's the typical renter profile here, and what's been the actual vacancy rate?
- The area grade is low — what's the realistic commute time and amenity access for the typical tenant pool here? Any planned neighborhood developments (good or bad) we should know about?
- What's the average days-on-market for RENTAL listings here right now (not sales)? A rising rental-DOM trend means longer vacancies and softer asking-rent achievability than the comps imply.
- What's the recent tenant-quality profile in this submarket — average credit score on applications, eviction rate, late-payment / NSF rate, and stable-employment percentage? A property-management company in the area should have these aggregated.
- How much new for-sale + rental construction is in the pipeline within 1–3 miles? Heavy new supply typically softens prices + rents 12–24 months out; constrained supply supports both.
Investment metrics
- 1% rule
- 0.89% ✗
- Cap rate
- 6.17%
- Cash-on-cash
- -0.45%
- DSCR
- 0.98
- GRM
- 9.4
CMA / ARV
- ARV (median comp)
- $325,000
- List price
- $252,999
- Delta
- -22.15%
- Verdict
- UNDERPRICED
- Comps
- 20 within 1.0 mi
Show comp detail 12 sales within ~0.75 mi
| Address | Dist | Beds/Ba | Sqft | Sold | Price | $/sf | Match |
|---|---|---|---|---|---|---|---|
| 611 Arabian Dr | 0.05mi | 3/2.0 (-1) | 1,604 (-3%) | 3mo | $296,749 | $185 | 85 |
| 312 Perkins Rd | 0.23mi | 3/2.0 (-1) | 1,650 (-0%) | 2mo | $325,000 | $197 | 81 |
| 509 Cortes St | 0.22mi | 4/2.0 | 1,746 (+5%) | 4mo | $325,000 | $186 | 78 |
| 11 Woodhaven Ct | 0.34mi | 4/2.0 | 1,738 (+5%) | 4mo | $325,000 | $187 | 73 |
| 203 Surveyors Rd | 0.29mi | 3/2.0 (-1) | 1,518 (-8%) | 1mo | $320,000 | $211 | 66 |
| 1005 Karen St | 0.52mi | 3/2.0 (-1) | 1,690 (+2%) | 2mo | $329,900 | $195 | 65 |
| 118 Perkins Rd | 0.47mi | 3/2.0 (-1) | 1,498 (-10%) | 1mo | $314,900 | $210 | 57 |
| 417 Highmeadow Dr | 0.48mi | 3/2.0 (-1) | 1,500 (-9%) | 1mo | $324,000 | $216 | 56 |
| 1010 Diane St | 0.56mi | 4/2.0 | 1,832 (+11%) | 2mo | $409,900 | $224 | 54 |
| 245 Highmeadow Rd | 0.70mi | 3/2.0 (-1) | 1,718 (+4%) | 6mo | $339,000 | $197 | 51 |
| 308 Larry Rd | 0.37mi | 3/2.0 (-1) | 1,872 (+13%) | 7mo | $399,000 | $213 | 50 |
| 828 Greenview Ct | 0.69mi | 3/2.0 (-1) | 1,502 (-9%) | 1mo | $320,000 | $213 | 47 |
Match score weights: distance 35% · size 25% · config 20% · recency 20%. Top-matched comps best support the ARV.
Projected returns pro-forma
-3.0% appreciation · 0.0% rent growth · sell at horizon
- IRR
- -20.5%
- Equity multiple
- 0.31×
- Total profit
- $-49,186
- Equity at exit
- $37,723
- IRR
- -22.7%
- Equity multiple
- 0.01×
- Total profit
- $-70,136
- Equity at exit
- $21,875
Cash invested: $70,840 (down + closing). Projections, not guarantees.
Landlord ↔ Tenant lean methodology
- Overall (STATE)
- 87 Strongly Landlord-Friendly
- State Texas
- 87 Strongly Landlord-Friendly · R+5
- County
- — inherits STATE
- City
- — inherits STATE
ZIP-level market 76227
- Home prices YoY
- -19.0%
- Rents YoY
- -1.9%
- Active inventory
- 1885
- Price-to-rent
- 9.4×
Monthly cashflow live
- Estimated rent
- $2,243 high interval (Pro) →
- Mortgage (P&I)
- −$1,327
- Tax est. 1.5%
- −$316 /mo · $3,795/yr
- Insurance
- −$105
- HOA
- −$50
- Vacancy / Maint / Mgmt
- −$471
- Net cashflow
- $-26
Break-even live
UW: 25.0% down · 7.5% · 30yr · 1.5% tax · 5.0% vac · 8.0% maint · 8.0% mgmt
Financing live
Cash to close
- Down payment
- $63,250
- Closing costs
- $7,590
- Reserves months
- —
- Total cash needed
- —
Loan-product check · same deal, 3 products live
Conventional
25% down · 7.5% · 30yr
- Down + closing
- —
- Monthly P&I
- —
- Monthly cashflow
- —
- DSCR
- —
- Eligible?
- —
Personal DTI + credit; lowest rate.
DSCR
20% down · 8.5% · 30yr
- Down + closing
- —
- Monthly P&I
- —
- Monthly cashflow
- —
- DSCR
- —
- Eligible?
- —
No personal income docs; deal must DSCR.
Hard money
10% down · 12.0% · 12mo
- Down + closing
- —
- Monthly P&I
- —
- Monthly cashflow
- —
- DSCR
- —
- Eligible?
- —
Short-term bridge; refi at stabilization.
Rent comps 14 comps
| Address | Beds | Baths | Sqft | Rent | $/sqft | DOM | Units | Dist |
|---|---|---|---|---|---|---|---|---|
| 502 Brumley Rd Krugerville, TX | 3.0 | 2.0 | 1470 | $1,895 | $1.29 | 43d | 1 | 0.26mi |
| 225 Glenview Dr Unit Dr Aubrey, TX | 4.0 | 2.0 | 2020 | $2,350 | $1.16 | 2d | 1 | 0.66mi |
| 1011 Pecos St Aubrey, TX | 4.0 | 2.0 | 2040 | $2,300 | $1.13 | 43d | 1 | 0.76mi |
| 229 Irick Ct Aubrey, TX | 3.0 | 2.5 | 1346 | $2,000 | $1.49 | 3d | 1 | 0.79mi |
| 538 Concho St Aubrey, TX | 3.0 | 2.0 | 1613 | $2,285 | $1.42 | 16d | 1 | 0.85mi |
| 538 Concho St Aubrey, TX | 3.0 | 2.0 | 1613 | $2,285 | $1.42 | 7d | 1 | 0.85mi |
| 513 Rock Hill Rd Aubrey, TX | 4.0 | 2.0 | 1731 | $2,499 | $1.44 | 1d | 1 | 0.93mi |
| 601 Countryside Dr Aubrey, TX | 3.0 | 2.0 | 1500 | $1,700 | $1.13 | 4d | 1 | 0.96mi |
| 1000 Mason St Aubrey, TX | 3.0 | 2.0 | 1539 | $2,200 | $1.43 | 43d | 1 | 1.02mi |
| 685 Coleman St Aubrey, TX | 3.0 | 2.0 | 1869 | $2,400 | $1.28 | 7d | 1 | 1.11mi |
| 1000 King St Aubrey, TX | 3.0 | 2.5 | 2119 | $2,595 | $1.22 | 43d | 1 | 1.16mi |
| 933 King St Aubrey, TX | 3.0 | 2.0 | 1452 | $2,100 | $1.45 | 43d | 1 | 1.21mi |
| 717 Presidio St Aubrey, TX | 3.0 | 2.0 | 1498 | $2,100 | $1.40 | 18d | 1 | 1.23mi |
| 901 King St Aubrey, TX | 4.0 | 2.5 | 1761 | $2,625 | $1.49 | 2d | 1 | 1.23mi |
HOA detail
- Monthly dues
- $50 · $600/yr
Listing history 13 events
-
2026-06-13remarks 449-char remark
-
2026-06-13statusdays on market $252,999 Pending 43 DOM
-
2026-06-09days on market $252,999 Active 44 DOM
-
2026-06-08pricedays on market $252,999 Active 43 DOM
-
2026-06-07days on market $258,999 Active 42 DOM
-
2026-06-04days on market $258,999 Active 39 DOM
-
2026-06-03days on market $258,999 Active 38 DOM
-
2026-06-02days on market $258,999 Active 37 DOM
-
2026-06-01days on market $258,999 Active 36 DOM
-
2026-05-31days on market $258,999 Active 35 DOM
-
2026-04-29$260,999 Active 455-char remark
-
2026-04-28price $260,999 403-char remark
-
2026-04-26$318,999 Active 403-char remark
ⓘ Source: listings_history table (triggers on properties + properties_extension) + one-shot
backfill from property_details.listing_events for pre-trigger history.
Climate risk First Street
- Flood 1/10 Low FEMA zone X (unshaded) · 0% chance over 30 yrs
- Wildfire 6/10 Major
- Heat 6/10 Major 6 d/yr ≥109°F today · 19 d/yr by 30 yrs out
- Wind 5/10 Major 26% chance of damaging wind over 30 yrs
- Air quality 3/10 Moderate 3 unhealthy d/yr today · 4 by 30 yrs out
Nearby sold comps map
Loading sold comps map…
Walkable amenities ~0.75 mi
Loading nearby amenities…
Taxation est. · year 1
- Rental income
- $26,917
- − Mortgage interest
- −$14,172
- − Property taxes
- −$3,795
- − Insurance
- −$1,265
- − Repairs & maintenance
- −$2,153
- − Management
- −$2,153
- − HOA
- −$600
- − Depreciation
- −$7,360
- Taxable loss
- −$4,581
- Est. tax savings @ 24.0%
- +$1,100
- After-tax cash flow
- $783/yr
For passive investors: Depreciation is non-cash, so a rental often shows a tax loss while cash-flowing — sheltering income. Rental losses are passive: they offset passive income freely, and up to $25,000/yr can offset ordinary (W-2) income if you actively participate and your MAGI is under $100k (phasing out to $0 by $150k); unused losses carry forward. On sale, claimed depreciation is recaptured at up to 25%, and gains may owe capital-gains tax (a 1031 exchange can defer both). Figures are a year-1 estimate at your 24.0% rate — not tax advice; consult a CPA.
Condition & rehab AI · 1 photo
This single-level home is in good condition with a good exterior and interior. It is move-in ready with minor maintenance items to address. The home's curb appeal and interior can be enhanced with fresh paint and landscaping.
Value-add opportunities
- Both Paint exterior trim — Fresh paint can enhance curb appeal and the home's overall appearance.
- Both Clean and maintain landscaping — Well-maintained landscaping can improve the home's curb appeal and attract potential buyers or renters.
- Both Inspect and clean gutters — Clean gutters prevent water damage and improve the home's overall appearance and functionality.
Renovation cost estimate screening
Value-add ROI direction
- Both Paint exterior trim — Fresh paint can enhance curb appeal and the home's overall appearance. ↑
- Both Clean and maintain landscaping — Well-maintained landscaping can improve the home's curb appeal and attract potential buyers or renters. ↑
- Both Inspect and clean gutters — Clean gutters prevent water damage and improve the home's overall appearance and functionality. ↑
ⓘ Cost ranges are severity-bucket heuristics (US national rule-of-thumb). Get contractor quotes + a written scope before underwriting a rehab budget.
Schools (NCES district)
- District
- Aubrey ISD
- NCES district ID
- 4808910
- Math proficiency
- 50% ▼ -9.00%
- Reading proficiency
- 52% ▼ -3.00%
- Median HH income
- $77,154
- Composite
- 46.21/100
- National rank
- #2492
- State rank
- #119 of 826 in TX
Livability — Krugerville
- Score
- 65/100
- State rank
- #672
- US rank
- #12629
Category grades
Schools grade is shown separately in the Schools card above.
Census & demographics
- Census place
- Krugerville, TX
- County
- Denton County · 901,654 people
- City population
- 55,437
- Metro
- Dallas-Fort Worth-Arlington, TX
- Population (ZIP)
- 62,127
- Household income
- $111,402
- Rent vs Own
- Severe rent burden
- 959.0
Population outlook (Denton County) Hauer SSP2
- Today (2025)
- 1,053,010 people
- By 2030
- 1,192,269 · +13.2%
- By 2040
- 1,472,920 · +39.9%
- By 2050
- 1,746,506 · +65.9%
- By 2075
- 2,358,497 · +124.0%
- By 2100
- 2,779,183 · +163.9%
Race, ethnicity, and origin ACS 2023
- Neighborhood character
- Diverse neighborhood (Simpson 0.63)
- Race & ethnicity
- White 55% Black 19% Hispanic / Latino 17% Two or more races 13% Asian 4%
- Hispanic origin (detail)
- Mexican 12% Puerto Rican 1%
- Common ancestry
- Lithuanian 4% Slovak 2% Italian 1%
- Foreign-born
- 11% · Canada, Jamaica
- Languages at home
- 82% English-only · Spanish 10% Other Indo-European 2% Other Asian/Pacific 2%
Political lean MEDSL · Denton
- 2024 margin
- R (+13.2) · D 42.7% · R 55.8% · Other 1.5%
- 2008→2024 swing
- +11.0pp toward D · 2008: -24.2pp · 2024: -13.2pp
- All cycles
- 2024: R+13.2 2020: R+8.1 2016: R+20.2 2012: R+31.7 2008: R+24.2
Not yet ingested
- Civics
- —
Market trends
- HPI YoY
- ▼ -59.76%
- Current HPI
- 254.2895
- Rent YoY
- ▼ -1.88%
- Metro
- Dallas-Fort Worth-Arlington, TX
- State GDP YoY
- ▲ 3.95%
- F500 in state
- 110
Industry mix (Fortune 500 HQ in TX)
| Industry | F500 HQs | Revenue |
|---|---|---|
| Energy | 16 | $1,198B |
|
||
| Technology | 5 | $198B |
|
||
| Engineering / Construction | 4 | $72B |
|
||
| Energy Services | 3 | $60B |
|
||
| Utilities | 3 | $41B |
|
||
| Healthcare | 2 | $330B |
|
||
Price history
-3.1% since first listed4 events — show timeline
- 2026-06-11 Pending — NTREIS
- 2026-06-09 Price Changed $252,999 NTREIS
- 2026-05-27 Price Changed $258,999 NTREIS
- 2026-04-29 Listed $260,999 NTREIS
Cash-flow waterfall
monthlySold comps — $/sqft
last 12 mo · ≤1 miLoading sold comps…