 Triplex
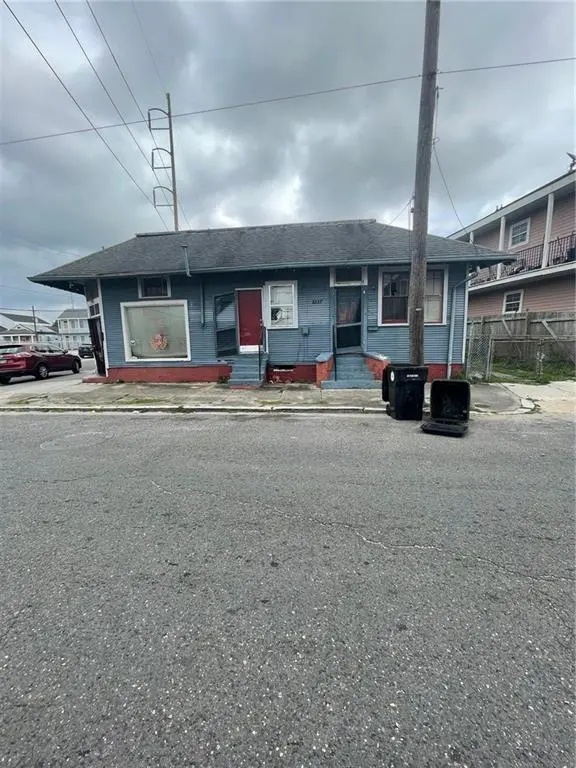
1620 Rev John Raphael Jr Way · New Orleans, LA
Flood risk 8/10 · Major
- FEMA flood zone
- X
- Chance of flooding over 30 yrs
- 0.75%
- Est. flood insurance / yr
- $507 – $1,088
Fire risk 1/10 · Minimal
- Est. fire insurance / yr
- $1,269 – $2,357
Heat risk 10/10 · Severe
- Hot days now (above 108°F)
- 6 days/yr
- Hot days in 30 yrs
- 18 days/yr
Wind risk 10/10 · Severe
- Chance of severe wind over 30 yrs
- 99.0%
Air-quality risk 3/10 · Minor
- Unhealthy air days now
- 3 days/yr
- Unhealthy air days in 30 yrs
- 4 days/yr
Risk factors via First Street. Map © Google.
Why this score? — see what drove the C- grade
The composite is a weighted blend of 9 inputs, each scored 0–100. Each bar is that input's sub-score; the figure is the points it added to the 100-point composite (weight × sub-score).
- Cash flow +15.0/30.0
- Appreciation +10.0/10.0
- ARV discount +7.5/15.0
- 1% rule +5.0/10.0
- DSCR +5.0/10.0
- Rent growth +4.0/5.0
- Livability +4.0/5.0
- Condition / age +2.5/5.0
- Schools +1.6/10.0
$90,000
🖨 Deal sheet 📄 Offer letter ✓ Due diligence
Multi-family units
County records classify this as Multi-Family (2-4 Unit). Listing-text estimate: 3 units. confirmed
Listing remarks MLS
This corner triplex presents an amazing investment opportunity. Has served as several businesses. It was previously a barber shop, beauty shop and income tax office. Don't miss out on the opportunity to renovate and flip or use for rental income.
Key facts
- 2,421 sq ft lot
- Parking
- Built 1973
Neighborhood map
What this means for you Summary
Snapshot
- This is a 3 × 5-bed/3.0-bath units multifamily listed at $90k.
Deal economics
- At list price, monthly cash flow is $5k ($55k/yr) — positive. Per door: $2k/mo.
- The deal already cash-flows at list — no discount required.
- Meets the 1% rule at list price ($7k rent vs $90k).
- Recommended offer: $79k (12.0% below list) — sets the bar for market timing.
- Cap rate 67.8% vs local median 4.4% in New Orleans — top-decile yield for the area; either an underpriced asset or a hidden risk that comps aren't pricing in. Stress-test before assuming the spread holds.
Location & tenants
- Location reads 81/100 on livability (#3 in LA, #1,383 nationally) — a professional / high-income tenant draw. Strengths: amenities A+, commute A+, health & safety A+; Watch: crime C-, employment D.
- Orleans Parish (urban): math 11% / reading 27% proficiency, ranked #69 of 98 in LA (top 70%) — low school quality limits family demand, transient renter base, plan for 1-2y turnover; 68% free/reduced lunch — lower-income household profile, screen leases tightly.
- Market conditions: Rents rising fast (+6.0%/yr); 137 active listings in the ZIP; 40 comparable units currently listed for rent nearby; rentals at typical pace (median 24d on market — plan ~3-4 weeks tenant-placement turnaround); lower-income renter base — watch delinquency; 710 units permitted in Orleans Parish in 2024 (244 in 5+ unit buildings).
- At $6,777/mo this rent would consume 207% of the median local household income ($39k/yr) (locally 714% of renters already pay >50% of income on rent) — very limited rent-growth headroom before tenants either downsize or default.
Forward outlook
- In year one you build about $10k of equity ($622 loan paydown + $9k appreciation (10.0% local appreciation)).
- Orleans County population projected at +61% by 2050 — long-run rental-demand tailwind backs the buy-and-hold thesis.
- At projected returns (10.0% appreciation + 6.0% rent growth), your $25k cash investment doubles in ~1 year — after that, you're playing with house money.
- By year 4, paydown + projected appreciation supports a ~$34k cash-out refi (75% LTV) — recoverable capital for the next deal without selling this one.
Negotiation context
- It's been on market 770 days — a 12% lower offer ($79k) is reasonable based on typical stale-listing flexibility.
- 4 sale attempts since 3y ago; this cycle's ask is 6823% above the opening price — seller raised mid-cycle; expect resistance to lowballs.
Risks & watch-outs
- Watch-outs: property tax is 3.1% of price; flood insurance adds $66/mo.
- Climate carrying-cost: severe flood risk; severe wind risk, 99% chance of damaging wind over 30y; extreme-heat days projected 6→18/yr by 2055 (HVAC capex compounding) — expect insurance premiums to compound above CPI over the hold.
Questions for the listing agent
- It's been on market 770 days. Have you received any prior offers? Is the seller open to a 12% concession, seller financing, or rate buy-down credit?
- Can we see the unit-by-unit rent roll, current vacancy, and any below-market leases? What's the average tenancy length?
- What capital expenditures (roof, boiler, parking lot, exteriors) have been made in the last 5 years, and what's planned in the next 2?
- Built in 1973 — when were the roof, HVAC, electrical panel, plumbing, and water heater last replaced?
- Property tax is high relative to price — has the assessment been appealed recently, and will the sale trigger a re-assessment?
- What's the actual annual flood-insurance premium (NFIP or private), and is the property in a SFHA with mandatory coverage?
- Why hasn't it sold? Are there any deal-killer items the seller is aware of (foundation, flood, title, zoning, code violations)?
- Is there a deadline driving the sale (1031 exchange, divorce, estate, relocation)? That informs how much negotiation room exists.
- What's the average days-on-market for RENTAL listings here right now (not sales)? A rising rental-DOM trend means longer vacancies and softer asking-rent achievability than the comps imply.
- What's the recent tenant-quality profile in this submarket — average credit score on applications, eviction rate, late-payment / NSF rate, and stable-employment percentage? A property-management company in the area should have these aggregated.
- How much new apartment / multifamily construction is in the pipeline within 1–3 miles? Heavy new supply (>2% of stock underway) typically softens rents 12–24 months out; light construction supports rent growth.
Investment metrics
- 1% rule
- 7.53% ✓
- Cap rate
- 67.77%
- Cash-on-cash
- 219.56%
- DSCR
- 10.77
- GRM
- 1.1
CMA / ARV
- ARV (on-the-fly)
- $186,975
- Comps found
- 6
Show comp detail 6 sales within ~0.75 mi
| Address | Dist | Beds/Ba | Sqft | Sold | Price | $/sf | Match |
|---|---|---|---|---|---|---|---|
| 2223 25 Felicity St | 0.02mi | 4/2.0 (+1) | 1,465 (+6%) | 9mo | $155,000 | $106 | 72 |
| 2114 16 Josephine St | 0.23mi | 4/2.0 (+1) | 1,407 (+2%) | 16mo | $299,000 | $213 | 64 |
| 2620-22 Philip St | 0.27mi | 4/2.0 (+1) | 1,472 (+6%) | 8mo | $159,000 | $108 | 61 |
| 2809 11 Third St | 0.44mi | 4/2.0 (+1) | 1,404 (+1%) | 23mo | $80,000 | $57 | 49 |
| 1809 11 Third St | 0.60mi | 4/2.0 (+1) | 1,585 (+14%) | 1mo | $260,000 | $164 | 38 |
| 2304-06 6th St | 0.64mi | 2/2.0 (-1) | 1,183 (-15%) | 10mo | $159,900 | $135 | 29 |
Match score weights: distance 35% · size 25% · config 20% · recency 20%. Top-matched comps best support the ARV.
Projected returns pro-forma
10.0% appreciation · 5.98% rent growth · sell at horizon
- IRR
- —
- Equity multiple
- 15.27×
- Total profit
- $359,589
- Equity at exit
- $81,079
- IRR
- —
- Equity multiple
- 35.91×
- Total profit
- $879,645
- Equity at exit
- $174,850
Cash invested: $25,200 (down + closing). Projections, not guarantees.
Landlord ↔ Tenant lean methodology
- Overall (STATE)
- 90 Strongly Landlord-Friendly
- State Louisiana
- 90 Strongly Landlord-Friendly · R+12
- County
- — inherits STATE
- City
- — inherits STATE
ZIP-level market 70113
- Rents YoY
- 6.0%
- Active inventory
- 137
- Price-to-rent
- 3.3×
Monthly cashflow live
- Estimated rent
- $6,777 medium interval (Pro) →
- Mortgage (P&I)
- −$472
- Tax from tax record
- −$234 /mo · $2,803/yr
- Insurance
- −$38
- Flood insurance flood zone
- −$66 /mo · $798/yr
- HOA
- −$0
- Vacancy / Maint / Mgmt
- −$1,423
- Net cashflow
- $4,544
Break-even live
3-unit breakdown (identical units grouped — click to expand)
| Units | Beds | Baths | Est. rent |
|---|---|---|---|
| 3× units | 5 | 3 | $6,777 |
| #1 | 5 | 3 | $2,259 |
| #2 | 5 | 3 | $2,259 |
| #3 | 5 | 3 | $2,259 |
| Total (3 units) | $6,777 | ||
UW: 25.0% down · 7.5% · 30yr · 1.5% tax · 5.0% vac · 8.0% maint · 8.0% mgmt
Financing live
Cash to close
- Down payment
- $22,500
- Closing costs
- $2,700
- Reserves months
- —
- Total cash needed
- —
Loan-product check · same deal, 3 products live
Conventional
25% down · 7.5% · 30yr
- Down + closing
- —
- Monthly P&I
- —
- Monthly cashflow
- —
- DSCR
- —
- Eligible?
- —
Personal DTI + credit; lowest rate.
DSCR
20% down · 8.5% · 30yr
- Down + closing
- —
- Monthly P&I
- —
- Monthly cashflow
- —
- DSCR
- —
- Eligible?
- —
No personal income docs; deal must DSCR.
Hard money
10% down · 12.0% · 12mo
- Down + closing
- —
- Monthly P&I
- —
- Monthly cashflow
- —
- DSCR
- —
- Eligible?
- —
Short-term bridge; refi at stabilization.
Rent comps 40 comps
| Address | Beds | Baths | Sqft | Rent | $/sqft | DOM | Units | Dist |
|---|---|---|---|---|---|---|---|---|
| 1614 Rev John Raphael Jr Way New Orleans, LA | 3.0 | 2.0 | 1000 | $1,500 | $1.50 | 24d | 1 | 0.03mi |
| 2318 Martin Luther King Junior Blvd New Orleans, LA | 3.0 | 2.0 | 1400 | $1,700 | $1.21 | 24d | 1 | 0.09mi |
| 2123 S Liberty St Unit 2125 New Orleans, LA | 3.0 | 2.0 | 1500 | $2,100 | $1.40 | 3d | 1 | 0.14mi |
| 2526 Martin Luther King Junior Blvd New Orleans, LA | 3.0 | 2.0 | 1200 | $2,200 | $1.83 | 3d | 1 | 0.16mi |
| 2119 Josephine St New Orleans, LA | 3.0 | 1.0 | 1017 | $950 | $0.93 | 21d | 1 | 0.18mi |
| 2032 Saint Andrew St New Orleans, LA | 3.0 | 2.0 | 1035 | $1,830 | $1.77 | 17d | 1 | 0.21mi |
| 2102 Josephine St New Orleans, LA | 4.0 | 2.0 | 1286 | $2,100 | $1.63 | 24d | 1 | 0.21mi |
| 2231 S Liberty St New Orleans, LA | 3.0 | 3.5 | 1752 | $2,000 | $1.14 | 17d | 1 | 0.22mi |
| 2722 Martin L King Bl New Orleans, LA | 3.0 | 2.5 | 1350 | $1,800 | $1.33 | 24d | 1 | 0.26mi |
| 2515 Erato St Unit 102 New Orleans, LA | 2.0 | 1.0 | 1000 | $2,100 | $2.10 | 21d | 1 | 0.27mi |
| 1407 Magnolia St New Orleans, LA | 3.0 | 2.0 | 1824 | $1,500 | $0.82 | 24d | 1 | 0.27mi |
| 2818 Saint Andrew St New Orleans, LA | 2.0 | 1.0 | 900 | $1,550 | $1.72 | 24d | 1 | 0.28mi |
| 1944 Jackson Ave New Orleans, LA | 3.0 | 2.5 | 1572 | $2,500 | $1.59 | 44d | 1 | 0.30mi |
| 1848 Felicity St New Orleans, LA | 2.0 | 1.0 | 1000 | $1,300 | $1.30 | 17d | 1 | 0.31mi |
| 2225 2nd St New Orleans, LA | 3.0 | 2.0 | 1100 | $1,800 | $1.64 | 24d | 1 | 0.35mi |
| 2227 Second St New Orleans, LA | 2.0 | 2.0 | 1100 | $1,900 | $1.73 | 24d | 1 | 0.35mi |
| 1827 Baronne St Unit C New Orleans, LA | 2.0 | 1.0 | 876 | $1,450 | $1.66 | 24d | 1 | 0.35mi |
| 2403 S Saratoga St New Orleans, LA | 3.0 | 2.5 | 1600 | $2,500 | $1.56 | 24d | 1 | 0.37mi |
| 1915 Philip St New Orleans, LA | 3.0 | 1.5 | 1300 | $2,450 | $1.88 | 24d | 1 | 0.39mi |
| 1809 Carondelet St Unit 1809 New Orleans, LA | 2.0 | 2.0 | 1086 | $2,000 | $1.84 | 3d | 1 | 0.44mi |
| 1809 Carondelet St New Orleans, LA | 2.0 | 2.0 | 1086 | $2,200 | $2.03 | 24d | 1 | 0.44mi |
| 2222 Fourth St New Orleans, LA | 2.0 | 1.5 | 937 | $1,550 | $1.65 | 24d | 1 | 0.48mi |
| 1715 Jackson Ave Unit B New Orleans, LA | 2.0 | 2.0 | 1200 | $1,850 | $1.54 | 2d | 1 | 0.48mi |
| 1643 Josephine St New Orleans, LA | 1.0–2.0 | 1.5–2.0 | 814 | $2,249 | $2.76 | 2d | 11 | 0.49mi |
| 2107 Fourth St New Orleans, LA | 3.0 | 1.0 | 1292 | $1,775 | $1.37 | 17d | 1 | 0.50mi |
| 2717 Loyola Ave New Orleans, LA | 3.0 | 2.0 | 1232 | $2,300 | $1.87 | 24d | 1 | 0.51mi |
| 2717 Loyola Ave New Orleans, LA | 3.0 | 2.0 | 1250 | $2,300 | $1.84 | 2d | 1 | 0.51mi |
| 875 O'Keefe Ave #205 New Orleans, LA | 2.0 | 2.5 | 1040 | $2,250 | $2.16 | 17d | 1 | 0.56mi |
| 2233 Saint Charles Ave New Orleans, LA | 2.0 | 1.0–2.0 | 637 | $2,439 | $3.83 | 2d | 1 | 0.57mi |
| 2733 Danneel St New Orleans, LA | 4.0 | 2.0 | 1350 | $1,775 | $1.31 | 24d | 1 | 0.58mi |
| 2705 Dryades St New Orleans, LA | 2.0 | 1.0 | 1100 | $2,000 | $1.82 | 24d | 1 | 0.58mi |
| 3108 Second St New Orleans, LA | 3.0 | 3.0 | 1216 | $2,100 | $1.73 | 3d | 1 | 0.58mi |
| 2341 S Roman St Unit U New Orleans, LA | 3.0 | 2.0 | 1000 | $1,850 | $1.85 | 24d | 1 | 0.59mi |
| 1618 Philip St New Orleans, LA | 2.0 | 2.0 | 1200 | $1,950 | $1.62 | 24d | 1 | 0.59mi |
| 2100 Saint Charles Ave New Orleans, LA | 1.0–2.0 | 1.5–2.0 | 1077 | $3,500 | $3.25 | 3d | 2 | 0.59mi |
| 2100 Saint Charles Ave Unit 3M New Orleans, LA | 2.0 | 2.0 | 1425 | $3,500 | $2.46 | 44d | 1 | 0.60mi |
| 822 Howard Ave Unit 1272354P New Orleans, LA | 1.0–5.0 | 1.0–4.0 | 1749 | $6,618 | $3.78 | 2d | 3 | 0.60mi |
| 3120 Second St New Orleans, LA | 3.0 | 3.0 | 1256 | $2,050 | $1.63 | 24d | 1 | 0.60mi |
| 3122 2nd St New Orleans, LA | 3.0 | 3.0 | 1206 | $2,075 | $1.72 | 24d | 1 | 0.60mi |
| 1525 Melpomene St Unit Na New Orleans, LA | 3.0 | 1.5 | 1700 | $4,000 | $2.35 | 44d | 1 | 0.60mi |
Listing history 11 events
-
2026-04-25$1,300
-
2025-12-18soldstatus $80,000
-
2025-12-16status Pending
-
2025-07-24price $90,000 246-char remark
Show marketing remark (246 chars)
This corner triplex presents an amazing investment opportunity. Has served as several businesses. It was previously a barber shop, beauty shop and income tax office. Don't miss out on the opportunity to renovate and flip or use for rental income.
-
2025-07-24price $90,000
Show marketing remark (246 chars)
This corner triplex presents an amazing investment opportunity. Has served as several businesses. It was previously a barber shop, beauty shop and income tax office. Don't miss out on the opportunity to renovate and flip or use for rental income.
-
2024-07-24price $120,000
-
2024-04-18price $140,000
-
2023-11-07$120,000 Active 246-char remark
Show marketing remark (246 chars)
This corner triplex presents an amazing investment opportunity. Has served as several businesses. It was previously a barber shop, beauty shop and income tax office. Don't miss out on the opportunity to renovate and flip or use for rental income.
-
2023-11-07$170,000 Active
Show marketing remark (246 chars)
This corner triplex presents an amazing investment opportunity. Has served as several businesses. It was previously a barber shop, beauty shop and income tax office. Don't miss out on the opportunity to renovate and flip or use for rental income.
-
2023-10-09price $170,000
-
2023-05-01$170,000
ⓘ Source: listings_history table (triggers on properties + properties_extension) + one-shot
backfill from property_details.listing_events for pre-trigger history.
Tax reassessment forecast LA · Resets to sale price
- Current annual tax
- $2,803 · $234/mo
- Projected year-2 tax
- $2,803 · $234/mo
- Expected delta
- $0/yr ($0/mo · 0.0%)
ⓘ Screening estimate from a state-policy table — verify with the county assessor before closing.
Climate risk First Street
- Flood 8/10 Severe FEMA zone X · 75% chance over 30 yrs
- Wildfire 1/10 Low
- Heat 10/10 Extreme 6 d/yr ≥108°F today · 18 d/yr by 30 yrs out
- Wind 10/10 Extreme 99% chance of damaging wind over 30 yrs
- Air quality 3/10 Moderate 3 unhealthy d/yr today · 4 by 30 yrs out
Nearby sold comps map
Loading sold comps map…
Walkable amenities ~0.75 mi
Loading nearby amenities…
Taxation est. · year 1
- Rental income
- $81,324
- − Mortgage interest
- −$5,041
- − Property taxes
- −$2,803
- − Insurance
- −$1,248
- − Repairs & maintenance
- −$6,506
- − Management
- −$6,506
- − Depreciation
- −$2,618
- Taxable income
- $56,602
- Est. tax owed @ 24.0%
- −$13,584
- After-tax cash flow
- $40,947/yr
For passive investors: Depreciation is non-cash, so a rental often shows a tax loss while cash-flowing — sheltering income. Rental losses are passive: they offset passive income freely, and up to $25,000/yr can offset ordinary (W-2) income if you actively participate and your MAGI is under $100k (phasing out to $0 by $150k); unused losses carry forward. On sale, claimed depreciation is recaptured at up to 25%, and gains may owe capital-gains tax (a 1031 exchange can defer both). Figures are a year-1 estimate at your 24.0% rate — not tax advice; consult a CPA.
Schools (NCES district)
- District
- Orleans Parish
- NCES district ID
- 2201170
- Math proficiency
- 11% ▼ -52.00%
- Reading proficiency
- 27% ▼ -46.00%
- Median HH income
- $37,011
- Composite
- 15.78/100
- National rank
- #9271
- State rank
- #69 of 98 in LA
Livability — New Orleans
- Score
- 81/100
- State rank
- #3
- US rank
- #1383
Category grades
Schools grade is shown separately in the Schools card above.
Census & demographics
- Census place
- New Orleans, LA
- County
- Orleans Parish · 338,817 people
- City population
- 338,817
- Metro
- New Orleans-Metairie, LA
- Population (ZIP)
- 9,387
- Household income
- $39,333
- Rent vs Own
- Severe rent burden
- 714.0
Population outlook (Orleans County) Hauer SSP2
- Today (2025)
- 513,025 people
- By 2030
- 575,781 · +12.2%
- By 2040
- 700,174 · +36.5%
- By 2050
- 826,541 · +61.1%
- By 2075
- 1,123,374 · +119.0%
- By 2100
- 1,355,609 · +164.2%
Race, ethnicity, and origin ACS 2023
- Neighborhood character
- Diverse neighborhood (Simpson 0.57)
- Race & ethnicity
- Black 61% White 20% Hispanic / Latino 13% Two or more races 11% Asian 2%
- Hispanic origin (detail)
- Mexican 2%
- Common ancestry
- Lithuanian 2% Portuguese 1% Slovak 1%
- Foreign-born
- 13% · Canada, Vietnam, China
- Languages at home
- 86% English-only · Spanish 11% Other Indo-European 1% Vietnamese 1%
Political lean MEDSL · Orleans
- 2024 margin
- Solid D (+67.0) · D 82.2% · R 15.2% · Other 2.7%
- 2008→2024 swing
- +6.7pp toward D · 2008: 60.3pp · 2024: 67.0pp
- All cycles
- 2024: D+67.0 2020: D+68.2 2016: D+66.2 2012: D+62.5 2008: D+60.3
Not yet ingested
- Civics
- —
Market trends
- HPI YoY
- ▲ 65.92%
- Current HPI
- 229.3968
- Rent YoY
- ▲ 5.98%
- Metro
- New Orleans-Metairie, LA
- State GDP YoY
- ▲ 3.29%
- F500 in state
- 10
Industry mix (Fortune 500 HQ in LA)
| Industry | F500 HQs | Revenue |
|---|---|---|
| Telecommunications | 2 | $23B |
|
||
| Utilities | 1 | $12B |
|
||
| Wholesale / Distribution | 1 | $5B |
|
||
| Advertising | 1 | $2B |
|
||
Price history
-99.2% since first listed11 events — show timeline
- 2026-04-25 Listed for Rent $1,300 RAAMLS
- 2025-12-18 Sold (Public Records) $80,000 Public Records
- 2025-12-16 Pending — GSREIN
- 2025-07-24 Price Changed $90,000 AcadianaMLS
- 2025-07-24 Price Changed $90,000 GSREIN
- 2024-07-24 Price Changed $120,000 GSREIN
- 2024-04-18 Price Changed $140,000 GSREIN
- 2023-11-07 Listed $170,000 GSREIN
- 2023-11-07 Listed $120,000 AcadianaMLS
- 2023-10-09 Price Changed $170,000 GSREIN
- 2023-05-01 Listed $170,000 AcadianaMLS
Property tax history
+2.5%/yrLatest (2026): $2,803 · +1.1% YoY. Source: county tax records.
Cash-flow waterfall
monthlySold comps — $/sqft
last 12 mo · ≤1 miLoading sold comps…