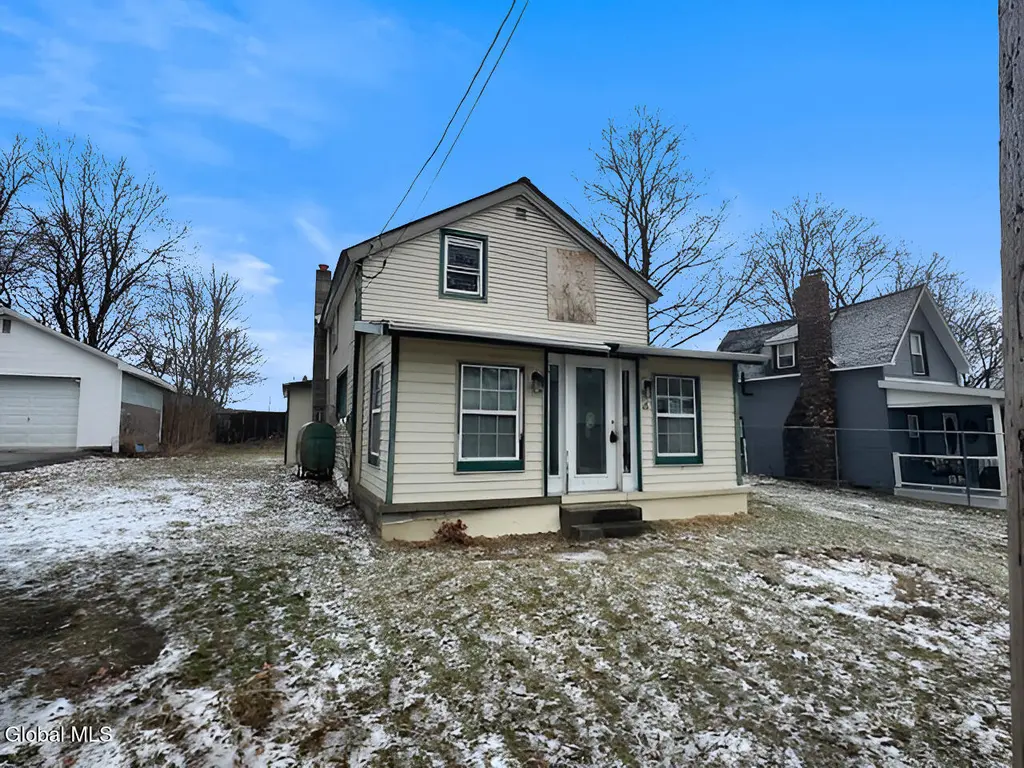
6 Center St · Stillwater, NY
Flood risk 1/10 · Minimal
- FEMA flood zone
- X
- Chance of flooding over 30 yrs
- 0.0%
- Est. flood insurance / yr
- $507 – $1,088
Fire risk 2/10 · Minimal
- Est. fire insurance / yr
- $691 – $1,283
Heat risk 3/10 · Minor
- Hot days now (above 97°F)
- 7 days/yr
- Hot days in 30 yrs
- 17 days/yr
Wind risk 3/10 · Minor
- Chance of severe wind over 30 yrs
- 5.0%
Air-quality risk 2/10 · Minimal
- Unhealthy air days now
- 0 days/yr
- Unhealthy air days in 30 yrs
- 1 days/yr
Risk factors via First Street. Map © Google.
Why this score? — see what drove the A- grade
The composite is a weighted blend of 9 inputs, each scored 0–100. Each bar is that input's sub-score; the figure is the points it added to the 100-point composite (weight × sub-score).
- Cash flow +30.0/30.0
- 1% rule +10.0/10.0
- DSCR +10.0/10.0
- Appreciation +10.0/10.0
- ARV discount +7.5/15.0
- Schools +5.2/10.0
- Livability +3.5/5.0
- Rent growth +2.5/5.0
- Condition / age +2.5/5.0
$79,900
🖨 Deal sheet 📄 Offer letter ✓ Due diligence
Listing remarks MLS
This four-bedroom, one-bathroom home presents a compelling investment opportunity for those seeking to create value through renovation. The property offers solid potential and sits on a desirable lot that provides room for enhancement and customization. With thoughtful updates and improvements, this residence could be transformed into a standout property, making it an attractive prospect for investors and renovators looking to maximize their return. Schedule your showing today to discover this home's potential and prime location.
Key facts
- 8,276 sq ft lot
- 2 parking spots
- Built 1880
Neighborhood map
What this means for you Summary
Snapshot
- This is a 4-bed/1.0-bath single-family listed at $80k.
Deal economics
- At list price, monthly cash flow is $1k ($16k/yr) — positive.
- The deal already cash-flows at list — no discount required.
- Meets the 1% rule at list price ($3k rent vs $80k).
- Recommended offer: $78k (3.0% below list) — sets the bar for market timing.
Location & tenants
- Location reads 69/100 on livability (#509 in NY) — a middle-class / working-renter tenant base. Strengths: crime A+, employment A+, housing A+; Watch: amenities F, commute F, health & safety D-.
- Stillwater Central School District (suburban): math 56% / reading 60% proficiency, ranked #238 of 590 in NY (top 40%) — acceptable for families but not a draw, mixed tenant base, ~2y average lease.
- Market conditions: 45 active listings in the ZIP; 1,132 units permitted in Saratoga County in 2024 (378 in 5+ unit buildings).
Forward outlook
- In year one you build about $9k of equity ($552 loan paydown + $8k appreciation (10.0% local appreciation)).
- Saratoga County population projected at +4% by 2050 — modest demand growth; plan on rents tracking national, not racing it.
- At projected returns (10.0% appreciation + 3.0% rent growth), your $22k cash investment doubles in ~1 year — after that, you're playing with house money.
- By year 4, paydown + projected appreciation supports a ~$30k cash-out refi (75% LTV) — recoverable capital for the next deal without selling this one.
Negotiation context
- It's been on market 58 days — a 3% lower offer ($78k) is reasonable based on typical stale-listing flexibility.
- 3 sale attempts since 2y ago; this cycle's ask has dropped $10k (11%) from the opening price — seller is motivated, your offer sets the floor, not the list.
Risks & watch-outs
- Watch-outs: property tax is 4.0% of price; built in 1880 — expect roof / HVAC / electrical / plumbing capex.
Questions for the listing agent
- It's been on market 58 days. Have you received any prior offers? Is the seller open to a 3% concession, seller financing, or rate buy-down credit?
- Built in 1880 — when were the roof, HVAC, electrical panel, plumbing, and water heater last replaced?
- Property tax is high relative to price — has the assessment been appealed recently, and will the sale trigger a re-assessment?
- Is there a deadline driving the sale (1031 exchange, divorce, estate, relocation)? That informs how much negotiation room exists.
- Schools are B-rated — typically a magnet for longer-tenancy family renters. What's the average tenant stay here, and is there a school-zone premium baked into asking?
- What's the average days-on-market for RENTAL listings here right now (not sales)? A rising rental-DOM trend means longer vacancies and softer asking-rent achievability than the comps imply.
- What's the recent tenant-quality profile in this submarket — average credit score on applications, eviction rate, late-payment / NSF rate, and stable-employment percentage? A property-management company in the area should have these aggregated.
- How much new for-sale + rental construction is in the pipeline within 1–3 miles? Heavy new supply typically softens prices + rents 12–24 months out; constrained supply supports both.
Investment metrics
- 1% rule
- 3.30% ✓
- Cap rate
- 26.84%
- Cash-on-cash
- 73.39%
- DSCR
- 4.27
- GRM
- 2.5
CMA / ARV
- ARV (median comp)
- $311,570
- List price
- $79,900
- Delta
- -74.36%
- Verdict
- UNDERPRICED
- Comps
- 20 within 1.0 mi
Show comp detail 11 sales within ~0.75 mi
| Address | Dist | Beds/Ba | Sqft | Sold | Price | $/sf | Match |
|---|---|---|---|---|---|---|---|
| 21 High St | 0.06mi | 3/1.5 (-1) | 1,526 (+11%) | 4mo | $278,100 | $182 | 68 |
| 17 Dorchester Dr | 0.35mi | 3/2.0 (-1) | 1,440 (+5%) | 4mo | $235,000 | $163 | 63 |
| 45 Lake St | 0.21mi | 3/1.0 (-1) | 1,200 (-12%) | 9mo | $190,000 | $158 | 57 |
| 27 Major Dickinson Ave | 0.45mi | 3/2.0 (-1) | 1,438 (+5%) | 8mo | $255,000 | $177 | 55 |
| 1C Castle Dr | 0.24mi | 4/2.0 | 1,196 (-13%) | 11mo | $341,250 | $285 | 54 |
| 25 Major Dickinson Ave | 0.45mi | 3/1.5 (-1) | 1,256 (-8%) | 6mo | $246,750 | $196 | 53 |
| 43 Kellogg Rd | 0.37mi | 3/1.0 (-1) | 1,282 (-6%) | 22mo | $270,000 | $211 | 48 |
| 565 Hudson Ave | 0.47mi | 3/2.0 (-1) | 1,290 (-6%) | 15mo | $325,000 | $252 | 46 |
| 112 S Gurba Dr | 0.56mi | 3/2.0 (-1) | 1,574 (+15%) | 7mo | $320,000 | $203 | 34 |
| 29 Railroad Ave | 0.46mi | 3/1.5 (-1) | 1,535 (+12%) | 21mo | $264,000 | $172 | 34 |
| 27 Towpath Rd | 0.61mi | 3/1.5 (-1) | 1,188 (-13%) | 22mo | $262,547 | $221 | 24 |
Match score weights: distance 35% · size 25% · config 20% · recency 20%. Top-matched comps best support the ARV.
Projected returns pro-forma
10.0% appreciation · 3.0% rent growth · sell at horizon
- IRR
- 84.1%
- Equity multiple
- 6.85×
- Total profit
- $130,802
- Equity at exit
- $71,980
- IRR
- 78.5%
- Equity multiple
- 15.17×
- Total profit
- $316,939
- Equity at exit
- $155,228
Cash invested: $22,372 (down + closing). Projections, not guarantees.
Landlord ↔ Tenant lean methodology
- Overall (STATE)
- 15 Strongly Tenant-Friendly
- State New York
- 15 Strongly Tenant-Friendly · D+10
- County
- — inherits STATE
- City
- — inherits STATE
ZIP-level market 12170
- Home prices YoY
- 7.4%
- Active inventory
- 45
- Price-to-rent
- 2.5×
Monthly cashflow live
- Estimated rent
- $2,638 medium interval (Pro) →
- Mortgage (P&I)
- −$419
- Tax from tax record
- −$263 /mo · $3,162/yr
- Insurance
- −$33
- HOA
- −$0
- Vacancy / Maint / Mgmt
- −$554
- Net cashflow
- $1,368
Break-even live
UW: 25.0% down · 7.5% · 30yr · 1.5% tax · 5.0% vac · 8.0% maint · 8.0% mgmt
Financing live
Cash to close
- Down payment
- $19,975
- Closing costs
- $2,397
- Reserves months
- —
- Total cash needed
- —
Loan-product check · same deal, 3 products live
Conventional
25% down · 7.5% · 30yr
- Down + closing
- —
- Monthly P&I
- —
- Monthly cashflow
- —
- DSCR
- —
- Eligible?
- —
Personal DTI + credit; lowest rate.
DSCR
20% down · 8.5% · 30yr
- Down + closing
- —
- Monthly P&I
- —
- Monthly cashflow
- —
- DSCR
- —
- Eligible?
- —
No personal income docs; deal must DSCR.
Hard money
10% down · 12.0% · 12mo
- Down + closing
- —
- Monthly P&I
- —
- Monthly cashflow
- —
- DSCR
- —
- Eligible?
- —
Short-term bridge; refi at stabilization.
Listing history 23 events
-
2026-06-19status $79,900 Pending 58 DOM
-
2026-06-18days on market $79,900 Active 58 DOM
-
2026-06-17days on market $79,900 Active 57 DOM
-
2026-06-16days on market $79,900 Active 56 DOM
-
2026-06-15days on market $79,900 Active 55 DOM
-
2026-06-14days on market $79,900 Active 53 DOM
-
2026-06-10days on market $79,900 Active 50 DOM
-
2026-06-09days on market $79,900 Active 49 DOM
-
2026-06-08days on market $79,900 Active 48 DOM
-
2026-06-07days on market $79,900 Active 47 DOM
-
2026-06-05days on market $79,900 Active 44 DOM
-
2026-06-03days on market $79,900 Active 43 DOM
-
2026-06-02days on market $79,900 Active 42 DOM
-
2026-06-01days on market $79,900 Active 41 DOM
-
2026-05-31days on market $79,900 Active 40 DOM
-
2026-05-31days on market $79,900 Active 39 DOM
-
2026-05-02status Active 535-char remark
Show marketing remark (535 chars)
This four-bedroom, one-bathroom home presents a compelling investment opportunity for those seeking to create value through renovation. The property offers solid potential and sits on a desirable lot that provides room for enhancement and customization. With thoughtful updates and improvements, this residence could be transformed into a standout property, making it an attractive prospect for investors and renovators looking to maximize their return. Schedule your showing today to discover this home's potential and prime location.
-
2026-05-02price $84,900 535-char remark
Show marketing remark (535 chars)
This four-bedroom, one-bathroom home presents a compelling investment opportunity for those seeking to create value through renovation. The property offers solid potential and sits on a desirable lot that provides room for enhancement and customization. With thoughtful updates and improvements, this residence could be transformed into a standout property, making it an attractive prospect for investors and renovators looking to maximize their return. Schedule your showing today to discover this home's potential and prime location.
-
2026-03-28status Pending 535-char remark
Show marketing remark (535 chars)
This four-bedroom, one-bathroom home presents a compelling investment opportunity for those seeking to create value through renovation. The property offers solid potential and sits on a desirable lot that provides room for enhancement and customization. With thoughtful updates and improvements, this residence could be transformed into a standout property, making it an attractive prospect for investors and renovators looking to maximize their return. Schedule your showing today to discover this home's potential and prime location.
-
2026-03-16$89,900 Active 535-char remark
Show marketing remark (535 chars)
This four-bedroom, one-bathroom home presents a compelling investment opportunity for those seeking to create value through renovation. The property offers solid potential and sits on a desirable lot that provides room for enhancement and customization. With thoughtful updates and improvements, this residence could be transformed into a standout property, making it an attractive prospect for investors and renovators looking to maximize their return. Schedule your showing today to discover this home's potential and prime location.
-
2024-12-20historical
-
2024-10-13price $99,000
-
2024-09-20$119,000 Active
ⓘ Source: listings_history table (triggers on properties + properties_extension) + one-shot
backfill from property_details.listing_events for pre-trigger history.
Tax reassessment forecast NY · Partial reset (capped growth)
- Current annual tax
- $3,162 · $263/mo
- Projected year-2 tax
- $3,162 · $263/mo
- Expected delta
- $0/yr ($0/mo · 0.0%)
ⓘ Screening estimate from a state-policy table — verify with the county assessor before closing.
Climate risk First Street
- Flood 1/10 Low FEMA zone X · 0% chance over 30 yrs
- Wildfire 2/10 Low
- Heat 3/10 Moderate 7 d/yr ≥97°F today · 17 d/yr by 30 yrs out
- Wind 3/10 Moderate 5% chance of damaging wind over 30 yrs
- Air quality 2/10 Low 0 unhealthy d/yr today · 1 by 30 yrs out
Nearby sold comps map
Loading sold comps map…
Walkable amenities ~0.75 mi
Loading nearby amenities…
Taxation est. · year 1
- Rental income
- $31,657
- − Mortgage interest
- −$4,476
- − Property taxes
- −$3,162
- − Insurance
- −$400
- − Repairs & maintenance
- −$2,533
- − Management
- −$2,533
- − Depreciation
- −$2,324
- Taxable income
- $16,230
- Est. tax owed @ 24.0%
- −$3,895
- After-tax cash flow
- $12,524/yr
For passive investors: Depreciation is non-cash, so a rental often shows a tax loss while cash-flowing — sheltering income. Rental losses are passive: they offset passive income freely, and up to $25,000/yr can offset ordinary (W-2) income if you actively participate and your MAGI is under $100k (phasing out to $0 by $150k); unused losses carry forward. On sale, claimed depreciation is recaptured at up to 25%, and gains may owe capital-gains tax (a 1031 exchange can defer both). Figures are a year-1 estimate at your 24.0% rate — not tax advice; consult a CPA.
Schools (NCES district)
- District
- Stillwater Central School District
- NCES district ID
- 3628110
- Math proficiency
- 56% ▼ -13.00%
- Reading proficiency
- 60% ▲ 2.00%
- Median HH income
- $72,025
- Composite
- 51.51/100
- National rank
- #1721
- State rank
- #238 of 590 in NY
Livability — Stillwater
- Score
- 69/100
- State rank
- #509
- US rank
- #8993
Category grades
Schools grade is shown separately in the Schools card above.
Census & demographics
- Population (ZIP)
- 5,225
Population outlook (Saratoga County) Hauer SSP2
- Today (2025)
- 238,889 people
- By 2030
- 243,681 · +2.0%
- By 2040
- 249,118 · +4.3%
- By 2050
- 248,638 · +4.1%
- By 2075
- 241,675 · +1.2%
- By 2100
- 213,150 · -10.8%
Race, ethnicity, and origin ACS 2023
- Neighborhood character
- Predominantly White (88%)
- Race & ethnicity
- White 88% Hispanic / Latino 9% Two or more races 6% Black 1%
- Hispanic origin (detail)
- Mexican 3% Puerto Rican 3% Dominican 2%
- Common ancestry
- Romanian 7% Lithuanian 6% Iranian 2%
- Foreign-born
- 3% · Canada
- Languages at home
- 97% English-only · Spanish 2%
Political lean MEDSL · Saratoga
- 2024 margin
- Toss-up / Even · D 50.9% · R 49.1%
- 2008→2024 swing
- -1.6pp toward R · 2008: 3.4pp · 2024: 1.8pp
- All cycles
- 2024: D+1.8 2020: D+5.4 2016: R+4.4 2012: D+2.1 2008: D+3.4
Not yet ingested
- Civics
- —
Market trends
- HPI YoY
- ▲ 25.13%
- Current HPI
- 363.0428
- Rent YoY
- —
- Metro
- —
- State GDP YoY
- ▲ 2.60%
- F500 in state
- 92
Industry mix (Fortune 500 HQ in NY)
| Industry | F500 HQs | Revenue |
|---|---|---|
| Financial Services | 10 | $950B |
|
||
| Consumer Goods | 9 | $162B |
|
||
| Insurance | 4 | $225B |
|
||
| Telecommunications | 2 | $144B |
|
||
| Pharmaceuticals | 2 | $112B |
|
||
| Media / Entertainment | 2 | $69B |
|
||
Price history
-28.7% since first listed7 events — show timeline
- 2026-05-02 Relisted — Global MLS
- 2026-05-02 Price Changed $84,900 Global MLS
- 2026-03-28 Pending — Global MLS
- 2026-03-16 Listed $89,900 Global MLS
- 2024-12-20 Listing Removed — Global MLS
- 2024-10-13 Price Changed $99,000 Global MLS
- 2024-09-20 Listed $119,000 Global MLS
Property tax history
+10.6%/yrLatest (2025): $3,162 · +1.2% YoY. Source: county tax records.
Cash-flow waterfall
monthlySold comps — $/sqft
last 12 mo · ≤1 miLoading sold comps…