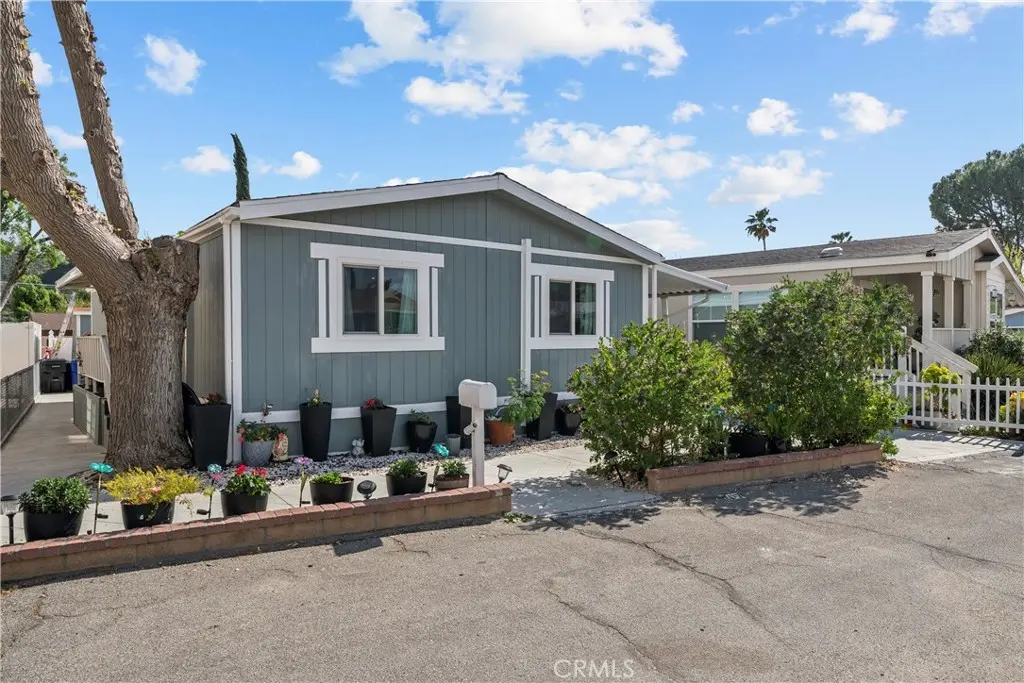
29021 Bouquet Canyon Rd #207 · Santa Clarita, CA
Flood risk 1/10 · Minimal
- FEMA flood zone
- X (unshaded)
- Chance of flooding over 30 yrs
- 0.0%
- Est. flood insurance / yr
- $507 – $1,088
Fire risk 10/10 · Severe
- Est. fire insurance / yr
- $659 – $1,223
Heat risk 7/10 · Major
- Hot days now (above 99°F)
- 7 days/yr
- Hot days in 30 yrs
- 18 days/yr
Wind risk 1/10 · Minimal
- Chance of severe wind over 30 yrs
- —
Air-quality risk 7/10 · Major
- Unhealthy air days now
- 14 days/yr
- Unhealthy air days in 30 yrs
- 17 days/yr
Risk factors via First Street. Map © Google.
Why this score? — see what drove the C+ grade
The composite is a weighted blend of 9 inputs, each scored 0–100. Each bar is that input's sub-score; the figure is the points it added to the 100-point composite (weight × sub-score).
- Cash flow +30.0/30.0
- DSCR +10.0/10.0
- 1% rule +9.1/10.0
- Schools +5.9/10.0
- Livability +3.5/5.0
- Rent growth +2.5/5.0
- Condition / age +2.5/5.0
- ARV discount +0.0/15.0
- Appreciation +0.0/10.0
$224,990
🖨 Deal sheet (PDF) 📄 Offer letter ✓ Due diligence
Listing remarks
Welcome to this beautifully updated 3-bedroom, 2-bath manufactured home located in Lily of the Valley, a well-kept community with a pool and playground conveniently positioned right in front of the home. Inside, you’ll find a bright and open layout with vaulted ceilings and an upgraded kitchen that really stands out. The kitchen features newer countertops done about 9 months ago, painted cabinetry, a modern sink, recessed lighting, a pantry, and a large center island that serves as the focal point of the space, offering plenty of prep space and seating while opening up seamlessly to the living and dining areas. Both bathrooms have been remodeled within the past year with clean, update
Key facts
- 1 year old ac unit
- Newer windows
- Updated kitchen
Tags
Property features AI
Finance
- Other: Park features include a park and community pool
- Financial info: Land lease applies (current amount: $1,137 monthly)
- HOA & community: Park community (Lilly of the Valley); Manager approval required for park residency
Exterior
- Parking: Attached carport
- Utilities: Public sewer; District/public water
- Home design: Single-story mobile home (Newport 700 model); Mobile remains on property; Mobile dimensions approximately 24 by 44 feet; Facing/entry level: entry on left side
- Construction: Listed year built from public records
- Exterior features: Storage building; Shed; Community pool; Close to clubhouse
Interior
- Kitchen: Remodeled kitchen
- Bathrooms: 2 full bathrooms
- Heating & cooling: Ductless cooling
- Interior features: One-level home; Entry is on the left side
- Laundry & utility: Inside laundry; Washer hookup; Gas dryer hookup
Neighborhood map
What this means for you Summary
Snapshot
- This is a 3-bed/2.0-bath manufactured listed at $225k.
Deal economics
- At list price, monthly cash flow is $947 ($11k/yr) — positive.
- The deal already cash-flows at list — no discount required.
- Meets the 1% rule at list price ($3k rent vs $225k).
- Recommended offer: $211k (6.0% below list) — sets the bar for market timing.
- Cap rate 11.3% vs local median 2.8% in Santa Clarita — top-decile yield for the area; either an underpriced asset or a hidden risk that comps aren't pricing in. Stress-test before assuming the spread holds.
Location & tenants
- Location reads 70/100 on livability (#229 in CA) — a middle-class / working-renter tenant base. Strengths: employment A+, housing A, crime A-; Watch: amenities D+, cost of living F, health & safety F.
- William S. Hart Union High (suburban): math 52% / reading 72% proficiency, ranked #155 of 1,400 in CA (top 11%) — acceptable for families but not a draw, mixed tenant base, ~2y average lease; only 18% free/reduced lunch — higher-income household profile.
- Zoned schools: Highlands Elementary (561 students, 22% FRL); Arroyo Seco Junior High (1,217 students, 17% FRL); Saugus High (2,378 students, 14% FRL) — zoned schools at 18% FRL track the district average.
- Market conditions: 96 active listings in the ZIP; 5 comparable units currently listed for rent nearby; rentals leasing fast (median 9d on market — plan ~1-2 weeks tenant-placement turnaround); 19,697 units permitted in Los Angeles County in 2024 (9,426 in 5+ unit buildings).
Forward outlook
- Local home prices are declining (-3.0%/yr); year-one equity from $2k of loan paydown is wiped out by about $7k of value loss. Plan a longer hold.
- Los Angeles County population projected at +9% by 2050 — modest demand growth; plan on rents tracking national, not racing it.
- At projected returns (-3.0% appreciation + 3.0% rent growth), your $63k cash investment doubles in ~7 years — after that, you're playing with house money.
Negotiation context
- It's been on market 80 days — a 6% lower offer ($211k) is reasonable based on typical stale-listing flexibility.
- 2 sale attempts since 17y ago with the ask held roughly flat each time — persistent listings suggest the price (not the market) is what's stuck; bring a comps-based counter.
Risks & watch-outs
- Climate carrying-cost: severe wildfire risk; extreme-heat days projected 7→18/yr by 2055 (HVAC capex compounding) — expect insurance premiums to compound above CPI over the hold.
Questions for the listing agent
- It's been on market 80 days. Have you received any prior offers? Is the seller open to a 6% concession, seller financing, or rate buy-down credit?
- Why hasn't it sold? Are there any deal-killer items the seller is aware of (foundation, flood, title, zoning, code violations)?
- Is there a deadline driving the sale (1031 exchange, divorce, estate, relocation)? That informs how much negotiation room exists.
- Schools are B-rated — typically a magnet for longer-tenancy family renters. What's the average tenant stay here, and is there a school-zone premium baked into asking?
- What's the average days-on-market for RENTAL listings here right now (not sales)? A rising rental-DOM trend means longer vacancies and softer asking-rent achievability than the comps imply.
- What's the recent tenant-quality profile in this submarket — average credit score on applications, eviction rate, late-payment / NSF rate, and stable-employment percentage? A property-management company in the area should have these aggregated.
- How much new for-sale + rental construction is in the pipeline within 1–3 miles? Heavy new supply typically softens prices + rents 12–24 months out; constrained supply supports both.
Investment metrics
- 1% rule
- 1.41% ✓
- Cap rate
- 11.34%
- Cash-on-cash
- 18.03%
- DSCR
- 1.80
- GRM
- 5.9
CMA / ARV
- ARV (on-the-fly)
- $167,904
- Comps found
- 5
Show comp detail 5 sales within ~0.75 mi
| Address | Dist | Beds/Ba | Sqft | Sold | Price | $/sf | Match |
|---|---|---|---|---|---|---|---|
| 29021 Bouquet Cyn #331 | 0.00mi | 3/2.0 | 1,142 (+8%) | 4mo | $160,000 | $140 | 83 |
| 29021 Bouquet Canyon Rd #382 | 0.00mi | 2/1.0 (-1) | 960 (-9%) | 0mo | $212,000 | $221 | 76 |
| 29021 Bouquet Canyon Rd #340 | 0.00mi | 3/2.0 | 1,104 (+4%) | 21mo | $175,000 | $159 | 75 |
| 29021 Bouquet Canyon Rd #299 | 0.00mi | 3/2.0 | 1,120 (+6%) | 18mo | $115,000 | $103 | 74 |
| 29021 Bouquet Canyon Rd #267 | 0.00mi | 3/2.0 | 1,136 (+8%) | 21mo | $235,000 | $207 | 70 |
Match score weights: distance 35% · size 25% · config 20% · recency 20%. Top-matched comps best support the ARV.
Projected returns pro-forma
-3.0% appreciation · 3.0% rent growth · sell at horizon
- IRR
- 9.6%
- Equity multiple
- 1.38×
- Total profit
- $23,890
- Equity at exit
- $33,547
- IRR
- 18.8%
- Equity multiple
- 2.57×
- Total profit
- $98,644
- Equity at exit
- $19,453
Cash invested: $62,997 (down + closing). Projections, not guarantees.
Landlord ↔ Tenant lean methodology
- Overall (STATE)
- 18 Strongly Tenant-Friendly
- State California
- 18 Strongly Tenant-Friendly · D+13
- County
- — inherits STATE
- City
- — inherits STATE
ZIP-level market 91390
- Home prices YoY
- -33.8%
- Active inventory
- 96
- Price-to-rent
- 5.9×
Monthly cashflow live
- Estimated rent
- $3,167 high interval (Pro) →
- Mortgage (P&I)
- −$1,180
- Tax est. 1.5%
- −$281 /mo · $3,375/yr
- Insurance
- −$94
- HOA
- −$0
- Vacancy / Maint / Mgmt
- −$665
- Net cashflow
- $947
Break-even live
Sensitivity live
| Price | -10% $1,102 | -5% $1,025 | +0% $947 | +5% $869 | +10% $791 |
|---|---|---|---|---|---|
| Rent | -10% $697 | -5% $822 | +0% $947 | +5% $1,072 | +10% $1,197 |
| Rate | -1.0pp $1,060 | -0.5pp $1,004 | base $947 | +0.5pp $888 | +1.0pp $829 |
UW: 25.0% down · 7.5% · 30yr · 1.5% tax · 5.0% vac · 8.0% maint · 8.0% mgmt
Financing live
Cash to close
- Down payment
- $56,248
- Closing costs
- $6,750
- Reserves months
- —
- Total cash needed
- —
Loan-product check · same deal, 3 products live
Conventional
25% down · 7.5% · 30yr
- Down + closing
- —
- Monthly P&I
- —
- Monthly cashflow
- —
- DSCR
- —
- Eligible?
- —
Personal DTI + credit; lowest rate.
DSCR
20% down · 8.5% · 30yr
- Down + closing
- —
- Monthly P&I
- —
- Monthly cashflow
- —
- DSCR
- —
- Eligible?
- —
No personal income docs; deal must DSCR.
Hard money
10% down · 12.0% · 12mo
- Down + closing
- —
- Monthly P&I
- —
- Monthly cashflow
- —
- DSCR
- —
- Eligible?
- —
Short-term bridge; refi at stabilization.
Rent comps 5 comps
| Address | Beds | Baths | Sqft | Rent | $/sqft | DOM | Units | Dist |
|---|---|---|---|---|---|---|---|---|
| 20000 Plum Canyon Rd Santa Clarita, CA | 3.0 | 3.0 | 1370 | $3,500 | $2.55 | 0d | 1 | 1.33mi |
| 20000 Plum Canyon Rd Santa Clarita, CA | 1.0–3.0 | 1.0–3.0 | 1051 | $3,700 | $3.52 | 25d | 2 | 1.34mi |
| 20833 Plum Canyon Rd Santa Clarita, CA | 2.0 | 1.0 | 834 | $2,495 | $2.99 | 16d | 1 | 1.35mi |
| 28427 Santa Rosa Ln Santa Clarita, CA | 2.0 | 2.0 | 1121 | $3,000 | $2.68 | 0d | 1 | 1.40mi |
| 19335 Laroda Ln Santa Clarita, CA | 2.0 | 2.0 | 1400 | $3,000 | $2.14 | 8d | 1 | 1.49mi |
Listing history 20 events
-
2026-06-21days on market $224,990 Active 80 DOM
-
2026-06-18days on market $224,990 Active 77 DOM
-
2026-06-17days on market $224,990 Active 76 DOM
-
2026-06-16days on market $224,990 Active 75 DOM
-
2026-06-15days on market $224,990 Active 74 DOM
-
2026-06-13days on market $224,990 Active 72 DOM
-
2026-06-13days on market $224,990 Active 71 DOM
-
2026-06-09days on market $224,990 Active 68 DOM
-
2026-06-08days on market $224,990 Active 67 DOM
-
2026-06-07statusdays on market $224,990 Active 66 DOM
-
2026-06-04days on market $224,990 Active Under Contract 63 DOM
-
2026-06-03days on market $224,990 Active Under Contract 62 DOM
-
2026-06-02days on market $224,990 Active Under Contract 61 DOM
-
2026-06-01days on market $224,990 Active Under Contract 60 DOM
-
2026-05-31days on market $224,990 Active Under Contract 59 DOM
-
2026-04-30historical Active Under Contract
-
2026-04-02$224,990 Active
-
2010-07-11historical
-
2010-03-04price $54,900
-
2009-09-05$59,900 Active
ⓘ Source: listings_history table (triggers on properties + properties_extension) + one-shot
backfill from property_details.listing_events for pre-trigger history.
Climate risk First Street
- Flood 1/10 Low FEMA zone X (unshaded) · 0% chance over 30 yrs
- Wildfire 10/10 Extreme
- Heat 7/10 Severe 7 d/yr ≥99°F today · 18 d/yr by 30 yrs out
- Wind 1/10 Low
- Air quality 7/10 Severe 14 unhealthy d/yr today · 17 by 30 yrs out
Nearby sold comps map
Loading sold comps map…
Walkable amenities ~0.75 mi
Loading nearby amenities…
Taxation est. · year 1
- Rental income
- $37,999
- − Mortgage interest
- −$12,603
- − Property taxes
- −$3,375
- − Insurance
- −$1,125
- − Repairs & maintenance
- −$3,040
- − Management
- −$3,040
- − Depreciation
- −$6,545
- Taxable income
- $8,272
- Est. tax owed @ 24.0%
- −$1,985
- After-tax cash flow
- $9,376/yr
For passive investors: Depreciation is non-cash, so a rental often shows a tax loss while cash-flowing — sheltering income. Rental losses are passive: they offset passive income freely, and up to $25,000/yr can offset ordinary (W-2) income if you actively participate and your MAGI is under $100k (phasing out to $0 by $150k); unused losses carry forward. On sale, claimed depreciation is recaptured at up to 25%, and gains may owe capital-gains tax (a 1031 exchange can defer both). Figures are a year-1 estimate at your 24.0% rate — not tax advice; consult a CPA.
Schools (NCES district)
- District
- William S. Hart Union High
- NCES district ID
- 0642510
- Math proficiency
- 52% ▬ 0.00%
- Reading proficiency
- 72% ▲ 1.00%
- Median HH income
- $95,844
- Composite
- 58.6/100
- National rank
- #2030
- State rank
- #155 of 1400 in CA
Livability — Santa Clarita
- Score
- 70/100
- State rank
- #229
- US rank
- #7378
Category grades
Schools grade is shown separately in the Schools card above.
Census & demographics
- City population
- 219,066
- Population (ZIP)
- 18,722
Population outlook (Los Angeles County) Hauer SSP2
- Today (2025)
- 10,940,515 people
- By 2030
- 11,256,481 · +2.9%
- By 2040
- 11,729,929 · +7.2%
- By 2050
- 11,948,407 · +9.2%
- By 2075
- 11,818,114 · +8.0%
- By 2100
- 10,842,928 · -0.9%
Race, ethnicity, and origin ACS 2023
- Neighborhood character
- Diverse neighborhood (Simpson 0.56)
- Race & ethnicity
- White 61% Hispanic / Latino 26% Two or more races 12% Asian 6% Black 2%
- Hispanic origin (detail)
- Mexican 14% Cuban 1%
- Common ancestry
- Lithuanian 2% Scottish 2% Portuguese 2%
- Foreign-born
- 14% · Canada, China, Dominican Republic
- Languages at home
- 81% English-only · Spanish 14% Other Indo-European 2% Chinese 1%
Political lean MEDSL · Los Angeles
- 2024 margin
- Solid D (+32.9) · D 64.8% · R 31.9% · Other 3.3%
- 2008→2024 swing
- -7.4pp toward R · 2008: 40.4pp · 2024: 32.9pp
- All cycles
- 2024: D+32.9 2020: D+44.2 2016: D+48.0 2012: D+40.0 2008: D+40.4
Not yet ingested
- Civics
- —
Market trends
- HPI YoY
- ▼ -165.65%
- Current HPI
- 325.09
- Rent YoY
- —
- Metro
- —
- State GDP YoY
- ▲ 3.21%
- F500 in state
- 116
Industry mix (Fortune 500 HQ in CA)
| Industry | F500 HQs | Revenue |
|---|---|---|
| Technology | 27 | $1,492B |
|
||
| Financial Services | 3 | $174B |
|
||
| Retail | 3 | $44B |
|
||
| Insurance | 3 | $26B |
|
||
| Media / Entertainment | 2 | $115B |
|
||
| Pharmaceuticals / Biotech | 2 | $62B |
|
||
Price history
+275.6% since first listed5 events — show timeline
- 2026-04-30 Contingent — CRMLS
- 2026-04-02 Listed $224,990 CRMLS
- 2010-07-11 Listing Removed — CRMLS
- 2010-03-04 Price Changed $54,900 CRMLS
- 2009-09-05 Listed $59,900 CRMLS
Property tax history
+4.3%/yrLatest (2025): $429 · +4.3% YoY. Source: county tax records.
Cash-flow waterfall
monthlySold comps — $/sqft
last 12 mo · ≤1 miLoading sold comps…