 Duplex
136-138 Pullman St · Lehigh Acres, FL
Flood risk 1/10 · Minimal
- FEMA flood zone
- X (unshaded)
- Chance of flooding over 30 yrs
- 0.0%
- Est. flood insurance / yr
- $507 – $1,088
Fire risk 4/10 · Minor
- Est. fire insurance / yr
- $947 – $1,759
Heat risk 10/10 · Severe
- Hot days now (above 107°F)
- 7 days/yr
- Hot days in 30 yrs
- 28 days/yr
Wind risk 10/10 · Severe
- Chance of severe wind over 30 yrs
- 99.0%
Air-quality risk 2/10 · Minimal
- Unhealthy air days now
- 1 days/yr
- Unhealthy air days in 30 yrs
- 1 days/yr
Risk factors via First Street. Map © Google.
Why this score? — see what drove the D grade
The composite is a weighted blend of 9 inputs, each scored 0–100. Each bar is that input's sub-score; the figure is the points it added to the 100-point composite (weight × sub-score).
- Appreciation +10.0/10.0
- Cash flow +8.0/30.0
- ARV discount +7.5/15.0
- Schools +4.1/10.0
- Livability +3.0/5.0
- Condition / age +2.5/5.0
- DSCR +2.1/10.0
- 1% rule +1.9/10.0
- Rent growth +1.3/5.0
$550,000
🖨 Deal sheet (PDF) 📄 Offer letter ✓ Due diligence
Multi-family units
County records classify this as Multi-Family (2-4 Unit). Listing-text estimate: 2 units. confirmed
Listing remarks MLS
Opportunity to own a duplex lot in Lehigh Acres, where rents are equally rewarding and on demand! Well & Septic. Short distance to I-75, SWFL International airport, and the Boston Red Sox training fields. We can help you build! Ask about our models, and let us show you how someone else can help you pay off your mortgage. Attention Investors, income averages $1200 per month per side once built. Take advantage of this low price, build or hold, with low yearly taxes.
Key facts
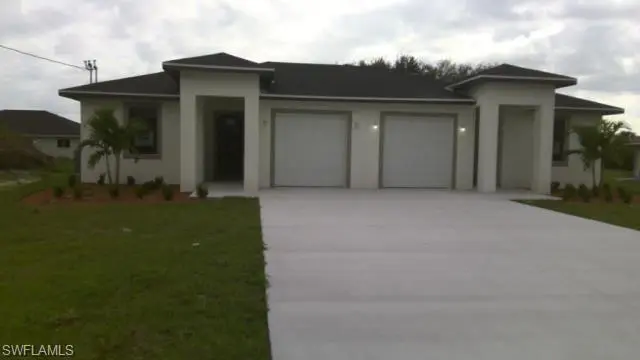
- New construction
- Modern finishes
- Long driveway
Tags
Property features AI
Finance
- Other: Lot is regular; frontage 100, sides 125 and 125, back 100; approximately 0.287 acres; Zoning: RM-2; Paved public road access; Irrigation from well; Building number 136-138
- Financial info: Property used for residential income (2 units)
- HOA & community: Non-gated community; HOA amenities: See remarks
Exterior
- Utilities: Well water; Septic sewer; Cable available
- Home design: Duplex residential income property; Built in 2023
- Construction: Concrete block construction
- Exterior features: Automatic sprinkler system (well source); Impact-resistant windows; Stucco exterior; Shingle roof
Interior
- Flooring: Laminate
- Bathrooms: 4 full bathrooms
- Heating & cooling: Central electric heat; Central electric cooling
- Interior features: Laminate flooring
Neighborhood map
What this means for you Summary
Snapshot
- This is a 2 × 3-bed/2.0-bath units multifamily listed at $550k.
Deal economics
- At list price, monthly cash flow is $-559 ($-7k/yr) — negative. Per door: $-279/mo.
- To cash-flow at today's rent, offer at most $451k (18.0% below list).
- To meet the 1% rule (rent ≥ 1% of price), the offer needs to be $382k (30.6% below list).
- Recommended offer: $382k (30.6% below list) — sets the bar for 1% rule.
Location & tenants
- Location reads 59/100 on livability (#826 in FL) — a working-class tenant base; expect higher turnover. Strengths: cost of living A+, housing A+; Watch: crime C-, employment D+, amenities F.
- Lee (suburban): math 47% / reading 50% proficiency, ranked #42 of 73 in FL (top 58%) — families likely to look elsewhere, expect single-tenant / working-renter base with shorter leases.
- Zoned schools: Veterans Park Academy For The Arts (math 41% / reading 45%, grade F, #1,366 of 2,144 statewide, top 64%, 2,133 students, 36% FRL); Oak Hammock Middle School (math 43% / reading 41%, grade D-, #340 of 571 statewide, top 61%, 1,563 students, 56% FRL); Lehigh Senior High School (math 23% / reading 45%, grade F, #394 of 667 statewide, top 60%, 2,476 students, 57% FRL).
- Market conditions: Rents falling (-4.7%/yr); 2476 active listings in the ZIP; 18 comparable units currently listed for rent nearby; rentals at typical pace (median 26d on market — plan ~3-4 weeks tenant-placement turnaround); 15,411 units permitted in Lee County in 2024 (4,686 in 5+ unit buildings).
- At $3,819/mo this rent would consume 63% of the median local household income ($72k/yr) (locally 434% of renters already pay >50% of income on rent) — very limited rent-growth headroom before tenants either downsize or default.
Forward outlook
- In year one you build about $59k of equity ($4k loan paydown + $55k appreciation (10.0% local appreciation)).
- Lee County population projected at +44% by 2050 — long-run rental-demand tailwind backs the buy-and-hold thesis.
- By year 2, paydown + projected appreciation supports a ~$95k cash-out refi (75% LTV) — recoverable capital for the next deal without selling this one.
Negotiation context
- It's been on market 39 days — a 3% lower offer ($534k) is reasonable based on typical stale-listing flexibility.
- 11 sale attempts since 22y ago with the ask held roughly flat each time — persistent listings suggest the price (not the market) is what's stuck; bring a comps-based counter.
- Current owner paid $10k; list at $550k implies a 5456% gain — meaningful room to come down on a strong offer.
Risks & watch-outs
- Climate carrying-cost: severe wind risk, 99% chance of damaging wind over 30y; extreme-heat days projected 7→28/yr by 2055 (HVAC capex compounding) — expect insurance premiums to compound above CPI over the hold.
Questions for the listing agent
- What do current leases actually rent for vs. the listed asking? Can we see a recent rent roll and the last 12 months of T-12 income?
- It's been on market 39 days. Have you received any prior offers? Is the seller open to a 31% concession, seller financing, or rate buy-down credit?
- Can we see the unit-by-unit rent roll, current vacancy, and any below-market leases? What's the average tenancy length?
- What capital expenditures (roof, boiler, parking lot, exteriors) have been made in the last 5 years, and what's planned in the next 2?
- Is there a deadline driving the sale (1031 exchange, divorce, estate, relocation)? That informs how much negotiation room exists.
- Schools are D-rated, which usually means shorter tenancies and higher turnover. Who's the typical renter profile here, and what's been the actual vacancy rate?
- The area grade is low — what's the realistic commute time and amenity access for the typical tenant pool here? Any planned neighborhood developments (good or bad) we should know about?
- What's the average days-on-market for RENTAL listings here right now (not sales)? A rising rental-DOM trend means longer vacancies and softer asking-rent achievability than the comps imply.
- What's the recent tenant-quality profile in this submarket — average credit score on applications, eviction rate, late-payment / NSF rate, and stable-employment percentage? A property-management company in the area should have these aggregated.
- How much new apartment / multifamily construction is in the pipeline within 1–3 miles? Heavy new supply (>2% of stock underway) typically softens rents 12–24 months out; light construction supports rent growth.
Investment metrics
- 1% rule
- 0.69% ✗
- Cap rate
- 5.07%
- Cash-on-cash
- -4.36%
- DSCR
- 0.81
- GRM
- 12.0
CMA / ARV
No comps found within radius.
Projected returns pro-forma
10.0% appreciation · 0.0% rent growth · sell at horizon
- IRR
- 20.4%
- Equity multiple
- 2.64×
- Total profit
- $252,672
- Equity at exit
- $495,484
- IRR
- 18.0%
- Equity multiple
- 5.88×
- Total profit
- $751,872
- Equity at exit
- $1,068,529
Cash invested: $154,000 (down + closing). Projections, not guarantees.
Landlord ↔ Tenant lean methodology
- Overall (STATE)
- 87 Strongly Landlord-Friendly
- State Florida
- 87 Strongly Landlord-Friendly · R+3
- County
- — inherits STATE
- City
- — inherits STATE
ZIP-level market 33974
- Home prices YoY
- 5.8%
- Rents YoY
- -4.7%
- Active inventory
- 2476
- Price-to-rent
- 24.0×
Monthly cashflow live
- Estimated rent
- $3,819 high interval (Pro) →
- Mortgage (P&I)
- −$2,884
- Tax from tax record
- −$463 /mo · $5,550/yr
- Insurance
- −$229
- HOA
- −$0
- Vacancy / Maint / Mgmt
- −$802
- Net cashflow
- $-559
Break-even live
Sensitivity live
| Price | -10% $-248 | -5% $-403 | +0% $-559 | +5% $-715 | +10% $-870 |
|---|---|---|---|---|---|
| Rent | -10% $-861 | -5% $-710 | +0% $-559 | +5% $-408 | +10% $-257 |
| Rate | -1.0pp $-282 | -0.5pp $-419 | base $-559 | +0.5pp $-701 | +1.0pp $-846 |
2-unit breakdown (identical units grouped — click to expand)
| Units | Beds | Baths | Est. rent |
|---|---|---|---|
| 2× units | 3 | 2 | $3,818 |
| #1 | 3 | 2 | $1,909 |
| #2 | 3 | 2 | $1,909 |
| Total (2 units) | $3,819 | ||
UW: 25.0% down · 7.5% · 30yr · 1.5% tax · 5.0% vac · 8.0% maint · 8.0% mgmt
Financing live
Cash to close
- Down payment
- $137,500
- Closing costs
- $16,500
- Reserves months
- —
- Total cash needed
- —
Loan-product check · same deal, 3 products live
Conventional
25% down · 7.5% · 30yr
- Down + closing
- —
- Monthly P&I
- —
- Monthly cashflow
- —
- DSCR
- —
- Eligible?
- —
Personal DTI + credit; lowest rate.
DSCR
20% down · 8.5% · 30yr
- Down + closing
- —
- Monthly P&I
- —
- Monthly cashflow
- —
- DSCR
- —
- Eligible?
- —
No personal income docs; deal must DSCR.
Hard money
10% down · 12.0% · 12mo
- Down + closing
- —
- Monthly P&I
- —
- Monthly cashflow
- —
- DSCR
- —
- Eligible?
- —
Short-term bridge; refi at stabilization.
Rent comps 18 comps
| Address | Beds | Baths | Sqft | Rent | $/sqft | DOM | Units | Dist |
|---|---|---|---|---|---|---|---|---|
| 212 Pullman St Lehigh Acres, FL | 3.0 | 2.0 | 2396 | $1,800 | $0.75 | 25d | 1 | 0.40mi |
| 397 Pennfield Ave Lehigh Acres, FL | 4.0 | 2.0 | 1780 | $2,100 | $1.18 | 25d | 1 | 0.43mi |
| 633 Alabama Rd S Lehigh Acres, FL | 3.0 | 2.0 | 2422 | $1,500 | $0.62 | 25d | 1 | 0.55mi |
| 20483 Copperhead Dr Unit 20483 Lehigh Acres, FL | 3.0 | 3.0 | 1849 | $2,300 | $1.24 | 12d | 1 | 0.65mi |
| 4601 Elva Ave S Lehigh Acres, FL | 4.0 | 3.0 | 2362 | $2,500 | $1.06 | 23d | 1 | 0.68mi |
| 20550 Copperhead Dr Lehigh Acres, FL | 4.0 | 3.0 | 2002 | $3,500 | $1.75 | 25d | 1 | 0.77mi |
| 20555 Copperhead Dr Lehigh Acres, FL | 4.0 | 3.0 | 2032 | $2,490 | $1.23 | 5d | 1 | 0.77mi |
| 423 Canyon Dr S Lehigh Acres, FL | 3.0 | 2.0 | 1830 | $1,550 | $0.85 | 25d | 1 | 0.95mi |
| 2512 54th St SW Lehigh Acres, FL | 4.0 | 2.0 | 1833 | $1,750 | $0.95 | 5d | 1 | 0.95mi |
| 20681 Copperhead Dr Lehigh Acres, FL | 3.0 | 3.0 | 2434 | $3,000 | $1.23 | 25d | 1 | 0.95mi |
| 418 Pickford Ave Lehigh Acres, FL | 4.0 | 2.0 | 1937 | $2,450 | $1.26 | 25d | 1 | 0.97mi |
| 20720 Copperhead Dr Lehigh Acres, FL | 3.0 | 3.0 | 2434 | $2,500 | $1.03 | 25d | 1 | 1.00mi |
| 4704 Karen Ave S Lehigh Acres, FL | 4.0 | 3.0 | 1916 | $2,500 | $1.30 | 5d | 1 | 1.26mi |
| 437 Reading St Lehigh Acres, FL | 4.0 | 2.0 | 1833 | $1,795 | $0.98 | 4d | 1 | 1.34mi |
| 10329 Canal Brook Ln Lehigh Acres, FL | 4.0 | 2.5 | 2462 | $2,600 | $1.06 | 25d | 1 | 1.34mi |
| 11634 Savanna Lakes Blvd Lehigh Acres, FL | 5.0 | 3.0 | 2451 | $2,650 | $1.08 | 23d | 1 | 1.36mi |
| 2701 20th St SW Lehigh Acres, FL | 3.0 | 2.0 | 2019 | $1,900 | $0.94 | 21d | 1 | 1.37mi |
| 10531 Canal Brook Ln Lehigh Acres, FL | 4.0 | 2.0 | 1828 | $2,300 | $1.26 | 18d | 1 | 1.37mi |
Listing history 40 events
-
2026-06-22days on market $550,000 Active 39 DOM
-
2026-06-17days on market $550,000 Active 35 DOM
-
2026-06-16days on market $550,000 Active 34 DOM
-
2026-06-15days on market $550,000 Active 33 DOM
-
2026-06-13days on market $550,000 Active 31 DOM
-
2026-06-10days on market $550,000 Active 28 DOM
-
2026-06-09days on market $550,000 Active 27 DOM
-
2026-06-08days on market $550,000 Active 26 DOM
-
2026-06-07days on market $550,000 Active 25 DOM
-
2026-06-03days on market $550,000 Active 21 DOM
-
2026-06-02days on market $550,000 Active 20 DOM
-
2026-06-01days on market $550,000 Active 19 DOM
-
2026-05-31days on market $550,000 Active 18 DOM
-
2026-05-13$550,000 Active
-
2020-07-31soldstatus $9,900 Closed 474-char remark
Show marketing remark (474 chars)
Opportunity to own a duplex lot in Lehigh Acres, where rents are equally rewarding and on demand! Well & Septic. Short distance to I-75, SWFL International airport, and the Boston Red Sox training fields. We can help you build! Ask about our models, and let us show you how someone else can help you pay off your mortgage. Attention Investors, income averages $1200 per month per side once built. Take advantage of this low price, build or hold, with low yearly taxes.
-
2020-06-23status Pending 474-char remark
Show marketing remark (474 chars)
Opportunity to own a duplex lot in Lehigh Acres, where rents are equally rewarding and on demand! Well & Septic. Short distance to I-75, SWFL International airport, and the Boston Red Sox training fields. We can help you build! Ask about our models, and let us show you how someone else can help you pay off your mortgage. Attention Investors, income averages $1200 per month per side once built. Take advantage of this low price, build or hold, with low yearly taxes.
-
2020-03-13$9,900 Active 474-char remark
Show marketing remark (474 chars)
Opportunity to own a duplex lot in Lehigh Acres, where rents are equally rewarding and on demand! Well & Septic. Short distance to I-75, SWFL International airport, and the Boston Red Sox training fields. We can help you build! Ask about our models, and let us show you how someone else can help you pay off your mortgage. Attention Investors, income averages $1200 per month per side once built. Take advantage of this low price, build or hold, with low yearly taxes.
-
2020-03-11historical
-
2019-11-14status Active
-
2019-11-08historical
-
2019-11-06status Active
-
2019-11-06historical
-
2019-08-13price $8,900
-
2019-05-30$9,800 Active
-
2019-05-30historical
-
2019-01-28$15,000 Active
-
2018-11-19historical
-
2018-10-08price $15,000
-
2018-05-18$20,000 Active
-
2018-04-30soldstatus $7,500 Sold
-
2018-04-25status Pending
-
2018-02-28$7,500 Active
-
2017-08-22historical
-
2017-04-25status Active
-
2017-03-14status Pending
-
2017-03-06$7,000 Active
-
2005-10-11soldstatus $55,000
-
2005-03-04historical
-
2004-12-28soldstatus $30,000
-
2004-10-04$30,000
ⓘ Source: listings_history table (triggers on properties + properties_extension) + one-shot
backfill from property_details.listing_events for pre-trigger history.
Tax reassessment forecast FL · Resets to sale price
- Current annual tax
- $5,550 · $463/mo
- Projected year-2 tax
- $5,550 · $463/mo
- Expected delta
- $0/yr ($0/mo · 0.0%)
ⓘ Screening estimate from a state-policy table — verify with the county assessor before closing.
Climate risk First Street
- Flood 1/10 Low FEMA zone X (unshaded) · 0% chance over 30 yrs
- Wildfire 4/10 Moderate
- Heat 10/10 Extreme 7 d/yr ≥107°F today · 28 d/yr by 30 yrs out
- Wind 10/10 Extreme 99% chance of damaging wind over 30 yrs
- Air quality 2/10 Low 1 unhealthy d/yr today · 1 by 30 yrs out
Nearby sold comps map
Loading sold comps map…
Walkable amenities ~0.75 mi
Loading nearby amenities…
Taxation est. · year 1
- Rental income
- $45,828
- − Mortgage interest
- −$30,809
- − Property taxes
- −$5,550
- − Insurance
- −$2,750
- − Repairs & maintenance
- −$3,666
- − Management
- −$3,666
- − Depreciation
- −$16,000
- Taxable loss
- −$16,614
- Est. tax savings @ 24.0%
- +$3,987
- After-tax cash flow
- $-2,720/yr
For passive investors: Depreciation is non-cash, so a rental often shows a tax loss while cash-flowing — sheltering income. Rental losses are passive: they offset passive income freely, and up to $25,000/yr can offset ordinary (W-2) income if you actively participate and your MAGI is under $100k (phasing out to $0 by $150k); unused losses carry forward. On sale, claimed depreciation is recaptured at up to 25%, and gains may owe capital-gains tax (a 1031 exchange can defer both). Figures are a year-1 estimate at your 24.0% rate — not tax advice; consult a CPA.
Schools (NCES district)
- District
- Lee
- NCES district ID
- 1201080
- Math proficiency
- 47% ▼ -11.00%
- Reading proficiency
- 50% ▼ -4.00%
- Median HH income
- $49,518
- Composite
- 41.49/100
- National rank
- #3458
- State rank
- #42 of 73 in FL
Livability — Lehigh Acres
- Score
- 59/100
- State rank
- #826
- US rank
- #20055
Category grades
Schools grade is shown separately in the Schools card above.
Census & demographics
- Census place
- Lehigh Acres, FL
- County
- Lee County · 788,662 people
- City population
- 130,638
- Metro
- Cape Coral-Fort Myers, FL
- Population (ZIP)
- 19,927
- Household income
- $72,192
- Rent vs Own
- Severe rent burden
- 434.0
Population outlook (Lee County) Hauer SSP2
- Today (2025)
- 871,946 people
- By 2030
- 955,468 · +9.6%
- By 2040
- 1,113,587 · +27.7%
- By 2050
- 1,256,891 · +44.1%
- By 2075
- 1,560,270 · +78.9%
- By 2100
- 1,726,848 · +98.0%
Race, ethnicity, and origin ACS 2023
- Neighborhood character
- Diverse neighborhood (Simpson 0.64)
- Race & ethnicity
- Hispanic / Latino 52% Two or more races 31% White 26% Black 18%
- Hispanic origin (detail)
- Mexican 12% Puerto Rican 7% Cuban 20% Dominican 4%
- Common ancestry
- Hispanic 7% Italian 1% Portuguese 1%
- Foreign-born
- 32% · Canada, Jamaica
- Languages at home
- 48% English-only · Spanish 43% French/Haitian/Cajun 7% Other Indo-European 1%
Political lean MEDSL · Lee
- 2024 margin
- Strong R (+28.4) · D 35.5% · R 63.9%
- 2008→2024 swing
- -18.0pp toward R · 2008: -10.4pp · 2024: -28.4pp
- All cycles
- 2024: R+28.4 2020: R+19.2 2016: R+20.4 2012: R+16.6 2008: R+10.4
Not yet ingested
- Civics
- —
Market trends
- HPI YoY
- ▲ 16.53%
- Current HPI
- 303.3399
- Rent YoY
- ▼ -4.68%
- Metro
- Cape Coral-Fort Myers, FL
- State GDP YoY
- ▲ 3.28%
- F500 in state
- 36
Industry mix (Fortune 500 HQ in FL)
| Industry | F500 HQs | Revenue |
|---|---|---|
| Industrial Technology | 2 | $29B |
|
||
| Insurance | 2 | $17B |
|
||
| Retail | 1 | $60B |
|
||
| Technology Distribution | 1 | $58B |
|
||
| Homebuilding | 1 | $35B |
|
||
| Technology Manufacturing | 1 | $35B |
|
||
Price history
+1733.3% since first listed27 events — show timeline
- 2026-05-13 Listed $550,000 NAPLESMLS
- 2020-07-31 Sold (MLS) $9,900 FORTMLS
- 2020-06-23 Pending — FORTMLS
- 2020-03-13 Listed $9,900 FORTMLS
- 2020-03-11 Listing Removed — FORTMLS
- 2019-11-14 Relisted — FORTMLS
- 2019-11-08 Listing Removed — FORTMLS
- 2019-11-06 Relisted — FORTMLS
- 2019-11-06 Listing Removed — FORTMLS
- 2019-08-13 Price Changed $8,900 FORTMLS
- 2019-05-30 Listing Removed — FORTMLS
- 2019-05-30 Listed $9,800 FORTMLS
- 2019-01-28 Listed $15,000 FORTMLS
- 2018-11-19 Listing Removed — FORTMLS
- 2018-10-08 Price Changed $15,000 FORTMLS
- 2018-05-18 Listed $20,000 FORTMLS
- 2018-04-30 Sold (MLS) $7,500 FORTMLS
- 2018-04-25 Pending — FORTMLS
- 2018-02-28 Listed $7,500 FORTMLS
- 2017-08-22 Listing Removed — FORTMLS
- 2017-04-25 Relisted — FORTMLS
- 2017-03-14 Pending — FORTMLS
- 2017-03-06 Listed $7,000 FORTMLS
- 2005-10-11 Sold (Public Records) $55,000 Public Records
- 2005-03-04 Listing Removed — FORTMLS
- 2004-12-28 Sold (Public Records) $30,000 Public Records
- 2004-10-04 Listed $30,000 FORTMLS
Property tax history
+48.4%/yrLatest (2025): $5,550 · +32.7% YoY. Source: county tax records.
Cash-flow waterfall
monthlySold comps — $/sqft
last 12 mo · ≤1 miLoading sold comps…