 Duplex
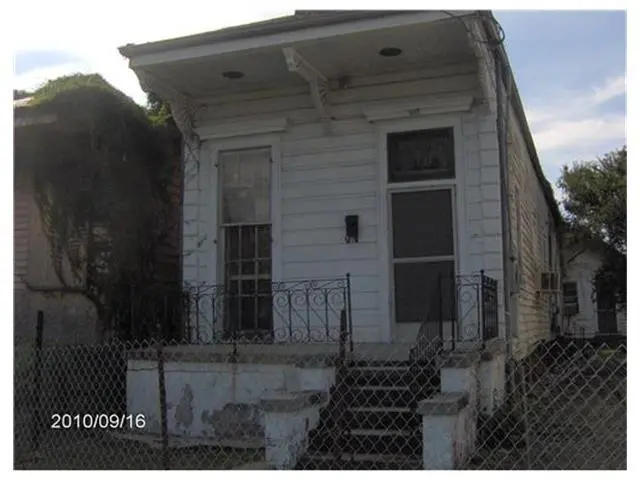
527 S Galvez St · New Orleans, LA
Flood risk 8/10 · Major
- FEMA flood zone
- AE
- Chance of flooding over 30 yrs
- 0.76%
- Est. flood insurance / yr
- $1,737 – $8,500
Fire risk 1/10 · Minimal
- Est. fire insurance / yr
- $1,269 – $2,357
Heat risk 10/10 · Severe
- Hot days now (above 108°F)
- 7 days/yr
- Hot days in 30 yrs
- 21 days/yr
Wind risk 10/10 · Severe
- Chance of severe wind over 30 yrs
- 99.0%
Air-quality risk 4/10 · Minor
- Unhealthy air days now
- 4 days/yr
- Unhealthy air days in 30 yrs
- 4 days/yr
Risk factors via First Street. Map © Google.
Why this score? — see what drove the C- grade
The composite is a weighted blend of 9 inputs, each scored 0–100. Each bar is that input's sub-score; the figure is the points it added to the 100-point composite (weight × sub-score).
- Cash flow +24.4/30.0
- DSCR +7.9/10.0
- 1% rule +5.9/10.0
- ARV discount +4.5/15.0
- Livability +4.0/5.0
- Rent growth +2.5/5.0
- Condition / age +2.5/5.0
- Schools +1.6/10.0
- Appreciation +0.0/10.0
$290,000
🖨 Deal sheet 📄 Offer letter ✓ Due diligence
Multi-family units
County records classify this as Multi-Family (2-4 Unit). Listing-text estimate: 2 units. confirmed
Listing remarks MLS
NEW PRICE! Mid-city duplex centrally located minutes away from LSU Health, LCMC Health, VA hospital, downtown, City Park, and so much more. This is a great opportunity for an owner occupant looking to live in the property and rent the other unit or for an investor looking for an opportunity to invest in a great location. One unit is a 3 bedroom 2 bath with 12 foot ceilings, granite countertops, and wood floors. Very spacious with lots of natural light. The second unit is a 1 bedroom 1 bathroom with tile floors. Both units have washer and dryer hookups. The property also offers off street parking, fenced in, has a small courtyard area for entertaining. Great rent potential in a high demand location. Call for a private tour today.
Key facts
- Mid city duplex
- Off street parking
- Fenced in
Tags
Neighborhood map
What this means for you Summary
Snapshot
- This is a 1×3bd/2ba + 1×1bd/1ba units multifamily listed at $290k.
Deal economics
- At list price, monthly cash flow is $161 ($2k/yr) — positive. Per door: $81/mo.
- The deal already cash-flows at list — no discount required.
- Meets the 1% rule at list price ($3k rent vs $290k).
- Recommended offer: $286k (1.5% below list) — sets the bar for market timing.
- Cap rate 8.7% vs local median 4.4% in New Orleans — top-decile yield for the area; either an underpriced asset or a hidden risk that comps aren't pricing in. Stress-test before assuming the spread holds.
Location & tenants
- Location reads 81/100 on livability (#3 in LA, #1,383 nationally) — a professional / high-income tenant draw. Strengths: amenities A+, commute A+, health & safety A+; Watch: crime C-, employment D.
- Orleans Parish (urban): math 11% / reading 27% proficiency, ranked #69 of 98 in LA (top 70%) — low school quality limits family demand, transient renter base, plan for 1-2y turnover; 68% free/reduced lunch — lower-income household profile, screen leases tightly.
- Market conditions: Rents soft (-0.2%/yr); 381 active listings in the ZIP; 40 comparable units currently listed for rent nearby; rentals at typical pace (median 24d on market — plan ~3-4 weeks tenant-placement turnaround); 710 units permitted in Orleans Parish in 2024 (244 in 5+ unit buildings).
- At $3,167/mo this rent would consume 72% of the median local household income ($53k/yr) (locally 3381% of renters already pay >50% of income on rent) — very limited rent-growth headroom before tenants either downsize or default.
Forward outlook
- Local home prices are declining (-3.0%/yr); year-one equity from $2k of loan paydown is wiped out by about $9k of value loss. Plan a longer hold.
- Orleans County population projected at +61% by 2050 — long-run rental-demand tailwind backs the buy-and-hold thesis.
Negotiation context
- It's been on market 29 days — a 2% lower offer ($286k) is reasonable based on typical stale-listing flexibility.
- 4 sale attempts since 16y ago with the ask held roughly flat each time — persistent listings suggest the price (not the market) is what's stuck; bring a comps-based counter.
- Current owner paid $20k; list at $290k implies a 1350% gain — meaningful room to come down on a strong offer.
Risks & watch-outs
- Watch-outs: flood insurance adds $427/mo; built in 1900 — expect roof / HVAC / electrical / plumbing capex.
- Climate carrying-cost: in FEMA flood zone AE (mandatory federal flood insurance); severe wind risk, 99% chance of damaging wind over 30y; extreme-heat days projected 7→21/yr by 2055 (HVAC capex compounding) — expect insurance premiums to compound above CPI over the hold.
Questions for the listing agent
- Can we see the unit-by-unit rent roll, current vacancy, and any below-market leases? What's the average tenancy length?
- What capital expenditures (roof, boiler, parking lot, exteriors) have been made in the last 5 years, and what's planned in the next 2?
- Built in 1900 — when were the roof, HVAC, electrical panel, plumbing, and water heater last replaced?
- What's the actual annual flood-insurance premium (NFIP or private), and is the property in a SFHA with mandatory coverage?
- Is there a deadline driving the sale (1031 exchange, divorce, estate, relocation)? That informs how much negotiation room exists.
- What's the average days-on-market for RENTAL listings here right now (not sales)? A rising rental-DOM trend means longer vacancies and softer asking-rent achievability than the comps imply.
- What's the recent tenant-quality profile in this submarket — average credit score on applications, eviction rate, late-payment / NSF rate, and stable-employment percentage? A property-management company in the area should have these aggregated.
- How much new apartment / multifamily construction is in the pipeline within 1–3 miles? Heavy new supply (>2% of stock underway) typically softens rents 12–24 months out; light construction supports rent growth.
Investment metrics
- 1% rule
- 1.09% ✓
- Cap rate
- 8.73%
- Cash-on-cash
- 8.69%
- DSCR
- 1.39
- GRM
- 7.6
CMA / ARV
- ARV (median comp)
- $272,084
- List price
- $290,000
- Delta
- 13.94%
- Verdict
- OVERPRICED
- Comps
- 20 within 1.0 mi
Show comp detail 7 sales within ~0.75 mi
| Address | Dist | Beds/Ba | Sqft | Sold | Price | $/sf | Match |
|---|---|---|---|---|---|---|---|
| 2216-18 Saint Louis St | 0.67mi | 4/2.0 | 1,689 (+3%) | 1mo | $335,000 | $198 | 64 |
| 2013-15 Conti St | 0.65mi | 4/2.0 | 1,610 (-2%) | 5mo | $65,000 | $40 | 62 |
| 2025 Conti St | 0.64mi | 4/2.0 | 1,680 (+2%) | 7mo | $285,000 | $170 | 60 |
| 2700 02 S Galvez St | 0.39mi | 4/3.0 | 1,600 (-3%) | 20mo | $310,000 | $194 | 56 |
| 2424 26 S Derbigny St | 0.49mi | 4/2.0 | 1,558 (-5%) | 15mo | $236,160 | $152 | 56 |
| 2704 06 S Galvez St | 0.39mi | 4/3.0 | 1,548 (-6%) | 16mo | $315,000 | $203 | 54 |
| 500 02 S Gayoso St | 0.60mi | 4/2.0 | 1,551 (-6%) | 18mo | $102,500 | $66 | 48 |
Match score weights: distance 35% · size 25% · config 20% · recency 20%. Top-matched comps best support the ARV.
Projected returns pro-forma
-3.0% appreciation · 0.0% rent growth · sell at horizon
- IRR
- -16.4%
- Equity multiple
- 0.44×
- Total profit
- $-45,735
- Equity at exit
- $43,240
- IRR
- -16.0%
- Equity multiple
- 0.24×
- Total profit
- $-61,418
- Equity at exit
- $25,074
Cash invested: $81,200 (down + closing). Projections, not guarantees.
Landlord ↔ Tenant lean methodology
- Overall (STATE)
- 90 Strongly Landlord-Friendly
- State Louisiana
- 90 Strongly Landlord-Friendly · R+12
- County
- — inherits STATE
- City
- — inherits STATE
ZIP-level market 70119
- Home prices YoY
- -34.8%
- Rents YoY
- -0.2%
- Active inventory
- 381
- Price-to-rent
- 13.8×
Monthly cashflow live
- Estimated rent
- $3,167 high interval (Pro) →
- Mortgage (P&I)
- −$1,521
- Tax from tax record
- −$272 /mo · $3,268/yr
- Insurance
- −$121
- Flood insurance flood zone
- −$427 /mo · $5,118/yr
- HOA
- −$0
- Vacancy / Maint / Mgmt
- −$665
- Net cashflow
- $161
Break-even live
2-unit breakdown (identical units grouped — click to expand)
| Units | Beds | Baths | Est. rent |
|---|---|---|---|
| 1× unit | 3 | 2 | $1,748 |
| 1× unit | 1 | 1 | $1,419 |
| Total (2 units) | $3,167 | ||
UW: 25.0% down · 7.5% · 30yr · 1.5% tax · 5.0% vac · 8.0% maint · 8.0% mgmt
Financing live
Cash to close
- Down payment
- $72,500
- Closing costs
- $8,700
- Reserves months
- —
- Total cash needed
- —
Loan-product check · same deal, 3 products live
Conventional
25% down · 7.5% · 30yr
- Down + closing
- —
- Monthly P&I
- —
- Monthly cashflow
- —
- DSCR
- —
- Eligible?
- —
Personal DTI + credit; lowest rate.
DSCR
20% down · 8.5% · 30yr
- Down + closing
- —
- Monthly P&I
- —
- Monthly cashflow
- —
- DSCR
- —
- Eligible?
- —
No personal income docs; deal must DSCR.
Hard money
10% down · 12.0% · 12mo
- Down + closing
- —
- Monthly P&I
- —
- Monthly cashflow
- —
- DSCR
- —
- Eligible?
- —
Short-term bridge; refi at stabilization.
Rent comps 40 comps
| Address | Beds | Baths | Sqft | Rent | $/sqft | DOM | Units | Dist |
|---|---|---|---|---|---|---|---|---|
| 2304 Gravier St Unit 2304 New Orleans, LA | 3.0 | 2.0 | 1112 | $1,800 | $1.62 | 15d | 1 | 0.03mi |
| 2539 Gravier St Unit 2541 New Orleans, LA | 3.0 | 1.0 | 1115 | $1,495 | $1.34 | 15d | 1 | 0.21mi |
| 326 S Dorgenois St Unit 326 New Orleans, LA | 4.0 | 3.0 | 1510 | $2,300 | $1.52 | 1d | 1 | 0.29mi |
| 2645 Gravier St Unit 2645-A New Orleans, LA | 3.0 | 1.0 | 1290 | $1,595 | $1.24 | 23d | 1 | 0.30mi |
| 2651 Poydras St New Orleans, LA | 1.0–4.0 | 1.0–2.0 | 1095 | $2,545 | $2.32 | 1d | 16 | 0.30mi |
| 2517 Palmyra St New Orleans, LA | 3.0 | 2.0 | 1306 | $2,100 | $1.61 | 16d | 1 | 0.32mi |
| 2615 Banks St New Orleans, LA | 3.0 | 2.0 | 1200 | $1,900 | $1.58 | 2d | 1 | 0.32mi |
| 2652 Banks St New Orleans, LA | 3.0 | 3.5 | 1204 | $2,100 | $1.74 | 23d | 1 | 0.34mi |
| 2024 Bienville St New Orleans, LA | 3.0 | 2.0 | 1314 | $2,100 | $1.60 | 23d | 1 | 0.55mi |
| 315 N Miro St New Orleans, LA | 3.0 | 3.0 | 1276 | $2,300 | $1.80 | 20d | 1 | 0.57mi |
| 315 N Miro St New Orleans, LA | 3.0 | 3.0 | 1276 | $2,500 | $1.96 | 23d | 1 | 0.57mi |
| 2105 Bienville St New Orleans, LA | 3.0 | 3.0 | 1231 | $2,350 | $1.91 | 16d | 1 | 0.58mi |
| 2912 Palmyra St Unit D New Orleans, LA | 3.0 | 2.0 | 1257 | $1,650 | $1.31 | 23d | 1 | 0.58mi |
| 2320 Conti St New Orleans, LA | 3.0 | 2.0 | 1125 | $2,500 | $2.22 | 23d | 1 | 0.61mi |
| 2033 Conti St New Orleans, LA | 3.0 | 3.0 | 1249 | $2,250 | $1.80 | 14d | 1 | 0.64mi |
| 227 S Gayoso St Unit 2h New Orleans, LA | 3.0 | 2.0 | 1800 | $2,500 | $1.39 | 43d | 1 | 0.65mi |
| 324 N Roman St New Orleans, LA | 3.0 | 3.0 | 2100 | $2,500 | $1.19 | 43d | 1 | 0.65mi |
| 2738 Bienville St New Orleans, LA | 4.0 | 3.0 | 1671 | $2,200 | $1.32 | 23d | 1 | 0.67mi |
| 426 S Lopez St New Orleans, LA | 4.0 | 3.0 | 1400 | $2,300 | $1.64 | 23d | 1 | 0.68mi |
| 1908 Saint Louis St New Orleans, LA | 3.0 | 3.0 | 1234 | $2,300 | $1.86 | 23d | 1 | 0.71mi |
| 3218 Jackson Ave New Orleans, LA | 3.0 | 2.0 | 1267 | $1,750 | $1.38 | 23d | 1 | 0.78mi |
| 325 S Rendon St New Orleans, LA | 3.0 | 2.0 | 1130 | $2,000 | $1.77 | 23d | 1 | 0.79mi |
| 4120 Erato St New Orleans, LA | 3.0 | 2.0 | 2250 | $1,750 | $0.78 | 23d | 1 | 0.84mi |
| 1407 Magnolia St New Orleans, LA | 3.0 | 2.0 | 1824 | $1,500 | $0.82 | 23d | 1 | 0.86mi |
| 439 S Norman C. Francis Pkwy Unit 1A New Orleans, LA | 3.0 | 1.0 | 1200 | $1,700 | $1.42 | 21d | 1 | 0.88mi |
| 1318 S Salcedo St Unit 202 New Orleans, LA | 4.0 | 2.0 | 1152 | $1,975 | $1.71 | 23d | 1 | 0.90mi |
| 1318 S Salcedo St Unit 101 New Orleans, LA | 4.0 | 2.0 | 1152 | $1,775 | $1.54 | 16d | 1 | 0.90mi |
| 2722 Martin L King Bl New Orleans, LA | 3.0 | 2.5 | 1350 | $1,800 | $1.33 | 23d | 1 | 0.90mi |
| 2606 S Miro St New Orleans, LA | 3.0 | 2.0 | 1450 | $2,016 | $1.39 | 23d | 1 | 0.90mi |
| 305 S Norman C Francis Pkwy New Orleans, LA | 3.0 | 1.5 | 1730 | $2,500 | $1.45 | 14d | 1 | 0.91mi |
| 305 S Norman C Francis Pkwy New Orleans, LA | 3.0 | 1.5 | 1730 | $2,600 | $1.50 | 16d | 1 | 0.91mi |
| 518 S Rampart St New Orleans, LA | 3.0 | 2.0 | 1853 | $3,995 | $2.16 | 3d | 1 | 0.91mi |
| 3617 Fourth St Unit A New Orleans, LA | 3.0 | 2.0 | 1225 | $1,995 | $1.63 | 16d | 1 | 0.92mi |
| 1011 Canal St Unit 1513939P New Orleans, LA | 4.0 | 4.0 | 1765 | $11,253 | $6.38 | 23d | 1 | 0.93mi |
| 1011 Canal St Unit 1513926P New Orleans, LA | 1.0–4.0 | 1.0–4.0 | 1016 | $12,077 | $11.88 | 1d | 2 | 0.93mi |
| 334 S Clark St New Orleans, LA | 3.0 | 1.0 | 1065 | $1,750 | $1.64 | 21d | 1 | 0.93mi |
| 3232 Conti St New Orleans, LA | 3.0 | 2.0 | 1140 | $3,500 | $3.07 | 43d | 1 | 0.96mi |
| 2526 Martin Luther King Junior Blvd New Orleans, LA | 3.0 | 2.0 | 1200 | $2,200 | $1.83 | 3d | 1 | 0.96mi |
| 2614 S Johnson St New Orleans, LA | 3.0 | 2.0 | 1536 | $2,079 | $1.35 | 14d | 1 | 0.96mi |
| 3122 2nd St New Orleans, LA | 3.0 | 3.0 | 1206 | $2,075 | $1.72 | 23d | 1 | 0.96mi |
Listing history 24 events
-
2026-06-18days on market $290,000 Active 29 DOM
-
2026-06-17days on market $290,000 Active 28 DOM
-
2026-06-16days on market $290,000 Active 27 DOM
-
2026-06-15days on market $290,000 Active 26 DOM
-
2026-06-13days on market $290,000 Active 24 DOM
-
2026-06-10days on market $290,000 Active 21 DOM
-
2026-06-09days on market $290,000 Active 20 DOM
-
2026-06-08days on market $290,000 Active 19 DOM
-
2026-06-07days on market $290,000 Active 18 DOM
-
2026-06-05days on market $290,000 Active 15 DOM
-
2026-06-03days on market $290,000 Active 14 DOM
-
2026-06-02days on market $290,000 Active 13 DOM
-
2026-06-01days on market $290,000 Active 12 DOM
-
2026-05-31days on market $290,000 Active 11 DOM
-
2026-05-20$290,000 Active 738-char remark
Show marketing remark (738 chars)
NEW PRICE! Mid-city duplex centrally located minutes away from LSU Health, LCMC Health, VA hospital, downtown, City Park, and so much more. This is a great opportunity for an owner occupant looking to live in the property and rent the other unit or for an investor looking for an opportunity to invest in a great location. One unit is a 3 bedroom 2 bath with 12 foot ceilings, granite countertops, and wood floors. Very spacious with lots of natural light. The second unit is a 1 bedroom 1 bathroom with tile floors. Both units have washer and dryer hookups. The property also offers off street parking, fenced in, has a small courtyard area for entertaining. Great rent potential in a high demand location. Call for a private tour today.
-
2026-03-16price $310,000
-
2026-03-16price $310,000
-
2026-01-13price $330,000
-
2026-01-13price $330,000
-
2025-11-07$350,000 Active
-
2011-03-10soldstatus $20,000
-
2011-03-03soldstatus $20,000
-
2010-09-16$20,000
ⓘ Source: listings_history table (triggers on properties + properties_extension) + one-shot
backfill from property_details.listing_events for pre-trigger history.
Tax reassessment forecast LA · Resets to sale price
- Current annual tax
- $3,268 · $272/mo
- Projected year-2 tax
- $3,268 · $272/mo
- Expected delta
- $0/yr ($0/mo · 0.0%)
ⓘ Screening estimate from a state-policy table — verify with the county assessor before closing.
Climate risk First Street
- Flood 8/10 Severe FEMA zone AE · 76% chance over 30 yrs
- Wildfire 1/10 Low
- Heat 10/10 Extreme 7 d/yr ≥108°F today · 21 d/yr by 30 yrs out
- Wind 10/10 Extreme 99% chance of damaging wind over 30 yrs
- Air quality 4/10 Moderate 4 unhealthy d/yr today · 4 by 30 yrs out
Nearby sold comps map
Loading sold comps map…
Walkable amenities ~0.75 mi
Loading nearby amenities…
Taxation est. · year 1
- Rental income
- $38,004
- − Mortgage interest
- −$16,245
- − Property taxes
- −$3,268
- − Insurance
- −$6,568
- − Repairs & maintenance
- −$3,040
- − Management
- −$3,040
- − Depreciation
- −$8,436
- Taxable loss
- −$2,594
- Est. tax savings @ 24.0%
- +$622
- After-tax cash flow
- $2,560/yr
For passive investors: Depreciation is non-cash, so a rental often shows a tax loss while cash-flowing — sheltering income. Rental losses are passive: they offset passive income freely, and up to $25,000/yr can offset ordinary (W-2) income if you actively participate and your MAGI is under $100k (phasing out to $0 by $150k); unused losses carry forward. On sale, claimed depreciation is recaptured at up to 25%, and gains may owe capital-gains tax (a 1031 exchange can defer both). Figures are a year-1 estimate at your 24.0% rate — not tax advice; consult a CPA.
Schools (NCES district)
- District
- Orleans Parish
- NCES district ID
- 2201170
- Math proficiency
- 11% ▼ -52.00%
- Reading proficiency
- 27% ▼ -46.00%
- Median HH income
- $37,011
- Composite
- 15.78/100
- National rank
- #9271
- State rank
- #69 of 98 in LA
Livability — New Orleans
- Score
- 81/100
- State rank
- #3
- US rank
- #1383
Category grades
Schools grade is shown separately in the Schools card above.
Census & demographics
- Census place
- New Orleans, LA
- County
- Orleans Parish · 338,817 people
- City population
- 338,817
- Metro
- New Orleans-Metairie, LA
- Population (ZIP)
- 37,253
- Household income
- $53,143
- Rent vs Own
- Severe rent burden
- 3381.0
Population outlook (Orleans County) Hauer SSP2
- Today (2025)
- 513,025 people
- By 2030
- 575,781 · +12.2%
- By 2040
- 700,174 · +36.5%
- By 2050
- 826,541 · +61.1%
- By 2075
- 1,123,374 · +119.0%
- By 2100
- 1,355,609 · +164.2%
Race, ethnicity, and origin ACS 2023
- Neighborhood character
- Diverse neighborhood (Simpson 0.64)
- Race & ethnicity
- Black 44% White 40% Two or more races 10% Hispanic / Latino 9% Asian 1%
- Hispanic origin (detail)
- Mexican 2%
- Common ancestry
- Lithuanian 8% Slovak 2% Romanian 1%
- Foreign-born
- 6% · Canada, Jamaica
- Languages at home
- 91% English-only · Spanish 6% French/Haitian/Cajun 1% Other Indo-European 0%
Political lean MEDSL · Orleans
- 2024 margin
- Solid D (+67.0) · D 82.2% · R 15.2% · Other 2.7%
- 2008→2024 swing
- +6.7pp toward D · 2008: 60.3pp · 2024: 67.0pp
- All cycles
- 2024: D+67.0 2020: D+68.2 2016: D+66.2 2012: D+62.5 2008: D+60.3
Not yet ingested
- Civics
- —
Market trends
- HPI YoY
- ▼ -135.38%
- Current HPI
- 253.1929
- Rent YoY
- ▼ -0.20%
- Metro
- New Orleans-Metairie, LA
- State GDP YoY
- ▲ 3.29%
- F500 in state
- 10
Industry mix (Fortune 500 HQ in LA)
| Industry | F500 HQs | Revenue |
|---|---|---|
| Telecommunications | 2 | $23B |
|
||
| Utilities | 1 | $12B |
|
||
| Wholesale / Distribution | 1 | $5B |
|
||
| Advertising | 1 | $2B |
|
||
Price history
+1350.0% since first listed10 events — show timeline
- 2026-05-20 Listed $290,000 GSREIN
- 2026-05-20 Listed $290,000 AcadianaMLS
- 2026-03-16 Price Changed $310,000 AcadianaMLS
- 2026-03-16 Price Changed $310,000 GSREIN
- 2026-01-13 Price Changed $330,000 AcadianaMLS
- 2026-01-13 Price Changed $330,000 GSREIN
- 2025-11-07 Listed $350,000 AcadianaMLS
- 2011-03-10 Sold (Public Records) $20,000 Public Records
- 2011-03-03 Sold (MLS) $20,000 GSREIN
- 2010-09-16 Listed $20,000 GSREIN
Property tax history
+12.6%/yrLatest (2026): $3,268 · +88.1% YoY. Source: county tax records.
Cash-flow waterfall
monthlySold comps — $/sqft
last 12 mo · ≤1 miLoading sold comps…