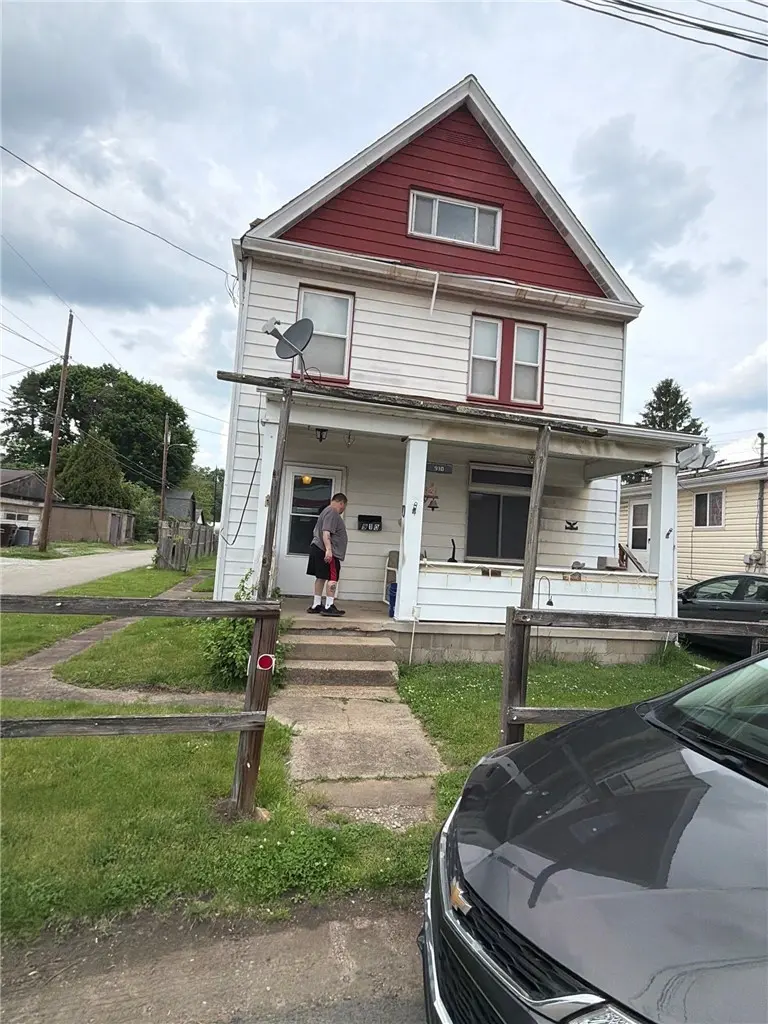
910 Lincoln Ave · Plum, PA
Flood risk 6/10 · Moderate
- FEMA flood zone
- X (unshaded)
- Chance of flooding over 30 yrs
- 0.66%
- Est. flood insurance / yr
- $473 – $860
Fire risk 1/10 · Minimal
- Est. fire insurance / yr
- $511 – $949
Heat risk 5/10 · Moderate
- Hot days now (above 98°F)
- 8 days/yr
- Hot days in 30 yrs
- 19 days/yr
Wind risk 2/10 · Minimal
- Chance of severe wind over 30 yrs
- —
Air-quality risk 4/10 · Minor
- Unhealthy air days now
- 5 days/yr
- Unhealthy air days in 30 yrs
- 7 days/yr
Risk factors via First Street. Map © Google.
Why this score? — see what drove the B- grade
The composite is a weighted blend of 9 inputs, each scored 0–100. Each bar is that input's sub-score; the figure is the points it added to the 100-point composite (weight × sub-score).
- Cash flow +30.0/30.0
- 1% rule +10.0/10.0
- DSCR +10.0/10.0
- ARV discount +7.5/15.0
- Livability +3.6/5.0
- Schools +3.5/10.0
- Rent growth +2.5/5.0
- Condition / age +2.5/5.0
- Appreciation +0.0/10.0
$85,000
🖨 Deal sheet (PDF) 📄 Offer letter ✓ Due diligence
Listing remarks
Investor Special – Endless Potential in Cheswick! Attention investors, flippers, and renovation enthusiasts! This spacious two-story home is ready for its next chapter. Featuring generous room sizes, original character, and a covered front porch, this property offers an excellent opportunity to restore and add value. The home requires significant updates and is being sold strictly as-is, making it ideal for a full renovation project. Conveniently located in the Allegheny Valley School District with easy access to Route 28, shopping, dining, and Pittsburgh. Whether you're looking for your next fix-and-flip, rental property, or value-add investment, this property has the bones and sq
Key facts
- 4,199 sq ft lot
- Built 1920
- Listed 5 days
Property features AI
Finance
- Financial info: Annual property tax around $725
Exterior
- Utilities: Public water; Public sewer
- Home design: 2-story frame house
- Construction: Frame construction
- Exterior features: Small yard on a roughly 0.096-acre lot; Resale condition
Interior
- Flooring: Carpet; Hardwood
- Bathrooms: 1 full bathroom
- Heating & cooling: Forced-air gas heating
- Interior features: Carpet and hardwood flooring
Neighborhood map
What this means for you Summary
Snapshot
- This is a 3-bed/1.0-bath single-family listed at $85k.
Deal economics
- At list price, monthly cash flow is $839 ($10k/yr) — positive.
- The deal already cash-flows at list — no discount required.
- Meets the 1% rule at list price ($2k rent vs $85k).
- Cap rate 18.1% vs local median 4.0% in Plum — top-decile yield for the area; either an underpriced asset or a hidden risk that comps aren't pricing in. Stress-test before assuming the spread holds.
Location & tenants
- Location reads 71/100 on livability (#730 in PA) — a middle-class / working-renter tenant base. Strengths: crime A+, employment A+, cost of living A+; Watch: amenities F, commute F, health & safety F.
- Allegheny Valley SD (suburban): math 29% / reading 53% proficiency, ranked #341 of 539 in PA (top 63%) — families likely to look elsewhere, expect single-tenant / working-renter base with shorter leases.
- Zoned schools: Acmetonia El Sch (math 26% / reading 56%, grade F, #932 of 1,518 statewide, top 62%, 484 students, 100% FRL); Springdale Jshs (math 32% / reading 47%, grade F, #265 of 437 statewide, top 63%, 387 students, 94% FRL) — zoned schools average 97% FRL vs 36% district-wide (61 pts higher); higher-poverty schools than district average — tighter screening recommended.
- Market conditions: 32 active listings in the ZIP; 2,996 units permitted in Allegheny County in 2024 (1,588 in 5+ unit buildings).
Forward outlook
- Local home prices are declining (-3.0%/yr); year-one equity from $588 of loan paydown is wiped out by about $3k of value loss. Plan a longer hold.
- At projected returns (-3.0% appreciation + 3.0% rent growth), your $24k cash investment doubles in ~3 years — after that, you're playing with house money.
Negotiation context
- Only 5 days on market — expect competitive offers; lowballing is unlikely to land.
- Current owner paid $29k; list at $85k implies a 193% gain — meaningful room to come down on a strong offer.
Risks & watch-outs
- Watch-outs: built in 1920 — expect roof / HVAC / electrical / plumbing capex.
- Climate carrying-cost: major flood risk; extreme-heat days projected 8→19/yr by 2055 (HVAC capex compounding) — expect insurance premiums to compound above CPI over the hold.
Questions for the listing agent
- Built in 1920 — when were the roof, HVAC, electrical panel, plumbing, and water heater last replaced?
- Is there a deadline driving the sale (1031 exchange, divorce, estate, relocation)? That informs how much negotiation room exists.
- Schools are A-rated — typically a magnet for longer-tenancy family renters. What's the average tenant stay here, and is there a school-zone premium baked into asking?
- What's the average days-on-market for RENTAL listings here right now (not sales)? A rising rental-DOM trend means longer vacancies and softer asking-rent achievability than the comps imply.
- What's the recent tenant-quality profile in this submarket — average credit score on applications, eviction rate, late-payment / NSF rate, and stable-employment percentage? A property-management company in the area should have these aggregated.
- How much new for-sale + rental construction is in the pipeline within 1–3 miles? Heavy new supply typically softens prices + rents 12–24 months out; constrained supply supports both.
Investment metrics
- 1% rule
- 2.06% ✓
- Cap rate
- 18.14%
- Cash-on-cash
- 42.32%
- DSCR
- 2.88
- GRM
- 4.1
CMA / ARV
- ARV (on-the-fly)
- $255,915
- Comps found
- 6
Show comp detail 6 sales within ~0.75 mi
| Address | Dist | Beds/Ba | Sqft | Sold | Price | $/sf | Match |
|---|---|---|---|---|---|---|---|
| 1425 Freeport Rd | 0.39mi | 3/2.0 | 1,979 (+9%) | 4mo | $187,000 | $94 | 59 |
| 139 Pearl Ave | 0.10mi | 3/3.0 | 1,562 (-14%) | 14mo | $190,000 | $122 | 52 |
| 114 Pillow Ave | 0.61mi | 4/2.0 (+1) | 1,850 (+2%) | 11mo | $260,000 | $141 | 50 |
| 210 Acme Ave | 0.15mi | 3/2.0 | 1,581 (-13%) | 22mo | $160,000 | $101 | 49 |
| 8 Harmar Dr | 0.75mi | 3/1.5 | 1,542 (-15%) | 10mo | $245,000 | $159 | 30 |
| 1215 Linden St | 0.71mi | 3/3.0 | 1,564 (-14%) | 22mo | $227,000 | $145 | 18 |
Match score weights: distance 35% · size 25% · config 20% · recency 20%. Top-matched comps best support the ARV.
Projected returns pro-forma
-3.0% appreciation · 3.0% rent growth · sell at horizon
- IRR
- 39.0%
- Equity multiple
- 2.67×
- Total profit
- $39,681
- Equity at exit
- $12,674
- IRR
- 45.4%
- Equity multiple
- 5.34×
- Total profit
- $103,381
- Equity at exit
- $7,349
Cash invested: $23,800 (down + closing). Projections, not guarantees.
Landlord ↔ Tenant lean methodology
- Overall (STATE)
- 62 Landlord-Friendly
- State Pennsylvania
- 62 Landlord-Friendly · EVEN
- County
- — inherits STATE
- City
- — inherits STATE
ZIP-level market 15024
- Home prices YoY
- -9.2%
- Active inventory
- 32
- Price-to-rent
- 4.1×
Monthly cashflow live
- Estimated rent
- $1,748 medium interval (Pro) →
- Mortgage (P&I)
- −$446
- Tax from tax record
- −$60 /mo · $725/yr
- Insurance
- −$35
- HOA
- −$0
- Vacancy / Maint / Mgmt
- −$367
- Net cashflow
- $839
Break-even live
Sensitivity live
| Price | -10% $887 | -5% $863 | +0% $839 | +5% $815 | +10% $791 |
|---|---|---|---|---|---|
| Rent | -10% $701 | -5% $770 | +0% $839 | +5% $908 | +10% $977 |
| Rate | -1.0pp $882 | -0.5pp $861 | base $839 | +0.5pp $817 | +1.0pp $795 |
UW: 25.0% down · 7.5% · 30yr · 1.5% tax · 5.0% vac · 8.0% maint · 8.0% mgmt
Financing live
Cash to close
- Down payment
- $21,250
- Closing costs
- $2,550
- Reserves months
- —
- Total cash needed
- —
Loan-product check · same deal, 3 products live
Conventional
25% down · 7.5% · 30yr
- Down + closing
- —
- Monthly P&I
- —
- Monthly cashflow
- —
- DSCR
- —
- Eligible?
- —
Personal DTI + credit; lowest rate.
DSCR
20% down · 8.5% · 30yr
- Down + closing
- —
- Monthly P&I
- —
- Monthly cashflow
- —
- DSCR
- —
- Eligible?
- —
No personal income docs; deal must DSCR.
Hard money
10% down · 12.0% · 12mo
- Down + closing
- —
- Monthly P&I
- —
- Monthly cashflow
- —
- DSCR
- —
- Eligible?
- —
Short-term bridge; refi at stabilization.
Listing history 4 events
-
2026-06-21days on market $85,000 Active 5 DOM
-
2026-06-18days on market $85,000 Active 2 DOM
-
2026-06-16remarks 693-char remark
-
2026-06-16$85,000 Active 1 DOM
ⓘ Source: listings_history table (triggers on properties + properties_extension) + one-shot
backfill from property_details.listing_events for pre-trigger history.
Tax reassessment forecast PA · Partial reset (capped growth)
- Current annual tax
- $725 · $60/mo
- Projected year-2 tax
- $1,034 · $86/mo
- Expected delta
- +$309/yr (+$26/mo · 42.6%)
ⓘ Screening estimate from a state-policy table — verify with the county assessor before closing.
Climate risk First Street
- Flood 6/10 Major FEMA zone X (unshaded) · 66% chance over 30 yrs
- Wildfire 1/10 Low
- Heat 5/10 Major 8 d/yr ≥98°F today · 19 d/yr by 30 yrs out
- Wind 2/10 Low
- Air quality 4/10 Moderate 5 unhealthy d/yr today · 7 by 30 yrs out
Nearby sold comps map
Loading sold comps map…
Walkable amenities ~0.75 mi
Loading nearby amenities…
Taxation est. · year 1
- Rental income
- $20,976
- − Mortgage interest
- −$4,761
- − Property taxes
- −$725
- − Insurance
- −$425
- − Repairs & maintenance
- −$1,678
- − Management
- −$1,678
- − Depreciation
- −$2,473
- Taxable income
- $9,236
- Est. tax owed @ 24.0%
- −$2,217
- After-tax cash flow
- $7,855/yr
For passive investors: Depreciation is non-cash, so a rental often shows a tax loss while cash-flowing — sheltering income. Rental losses are passive: they offset passive income freely, and up to $25,000/yr can offset ordinary (W-2) income if you actively participate and your MAGI is under $100k (phasing out to $0 by $150k); unused losses carry forward. On sale, claimed depreciation is recaptured at up to 25%, and gains may owe capital-gains tax (a 1031 exchange can defer both). Figures are a year-1 estimate at your 24.0% rate — not tax advice; consult a CPA.
Schools (NCES district)
- District
- Allegheny Valley SD
- NCES district ID
- 4202190
- Math proficiency
- 29% ▼ -15.00%
- Reading proficiency
- 53% ▼ -13.00%
- Median HH income
- $48,049
- Composite
- 35.04/100
- National rank
- #5037
- State rank
- #341 of 539 in PA
Livability — Plum
- Score
- 71/100
- State rank
- #730
- US rank
- #7292
Category grades
Schools grade is shown separately in the Schools card above.
Census & demographics
- City population
- 21,414
- Population (ZIP)
- 9,192
Population outlook (Allegheny County) Hauer SSP2
- Today (2025)
- 1,250,282 people
- By 2030
- 1,256,482 · +0.5%
- By 2040
- 1,256,318 · +0.5%
- By 2050
- 1,244,169 · -0.5%
- By 2075
- 1,197,693 · -4.2%
- By 2100
- 1,093,187 · -12.6%
Race, ethnicity, and origin ACS 2023
- Neighborhood character
- Predominantly White (92%)
- Race & ethnicity
- White 92% Asian 3% Two or more races 3% Black 2%
- Common ancestry
- Romanian 11% Italian 2% Lithuanian 2%
- Foreign-born
- 5% · China, Canada
- Languages at home
- 94% English-only · Chinese 2% Other Indo-European 2%
Political lean MEDSL · Allegheny
- 2024 margin
- Strong D (+20.3) · D 59.7% · R 39.4%
- 2008→2024 swing
- +4.8pp toward D · 2008: 15.5pp · 2024: 20.3pp
- All cycles
- 2024: D+20.3 2020: D+20.4 2016: D+16.4 2012: D+14.4 2008: D+15.5
Not yet ingested
- Civics
- —
Market trends
- HPI YoY
- ▼ -25.38%
- Current HPI
- 248.9181
- Rent YoY
- —
- Metro
- —
- State GDP YoY
- ▲ 1.68%
- F500 in state
- 34
Industry mix (Fortune 500 HQ in PA)
| Industry | F500 HQs | Revenue |
|---|---|---|
| Healthcare | 2 | $309B |
|
||
| Insurance | 2 | $27B |
|
||
| Telecommunications / Media | 1 | $124B |
|
||
| Industrial Distribution | 1 | $22B |
|
||
| Financial Services | 1 | $20B |
|
||
| Chemicals / Materials | 1 | $18B |
|
||
Price history
+193.1% since first listed2 events — show timeline
- 2026-06-16 Listed $85,000 West Penn MLS
- 2001-12-18 Sold (Public Records) $29,000 Public Records
Property tax history
-0.0%/yrLatest (2026): $725 · +1.8% YoY. Source: county tax records.
Cash-flow waterfall
monthlySold comps — $/sqft
last 12 mo · ≤1 miLoading sold comps…