21 Fisher Pl · Silver Springs Shores East, FL
Flood risk No data
- FEMA flood zone
- —
- Chance of flooding over 30 yrs
- —
- Est. flood insurance / yr
- —
Fire risk No data
- Est. fire insurance / yr
- —
Heat risk No data
- Hot days now (above threshold)
- —
- Hot days in 30 yrs
- —
Wind risk No data
- Chance of severe wind over 30 yrs
- —
Air-quality risk No data
- Unhealthy air days now
- —
- Unhealthy air days in 30 yrs
- —
Risk factors via First Street. Map © Google.
Why this score? — see what drove the D grade
The composite is a weighted blend of 9 inputs, each scored 0–100. Each bar is that input's sub-score; the figure is the points it added to the 100-point composite (weight × sub-score).
- Cash flow +11.3/30.0
- ARV discount +10.7/15.0
- Condition / age +5.0/5.0
- Schools +3.6/10.0
- 1% rule +3.3/10.0
- DSCR +3.3/10.0
- Rent growth +2.5/5.0
- Livability +2.5/5.0
- Appreciation +0.0/10.0
$215,000
🖨 Deal sheet (PDF) 📄 Offer letter ✓ Due diligence
Listing remarks MLS
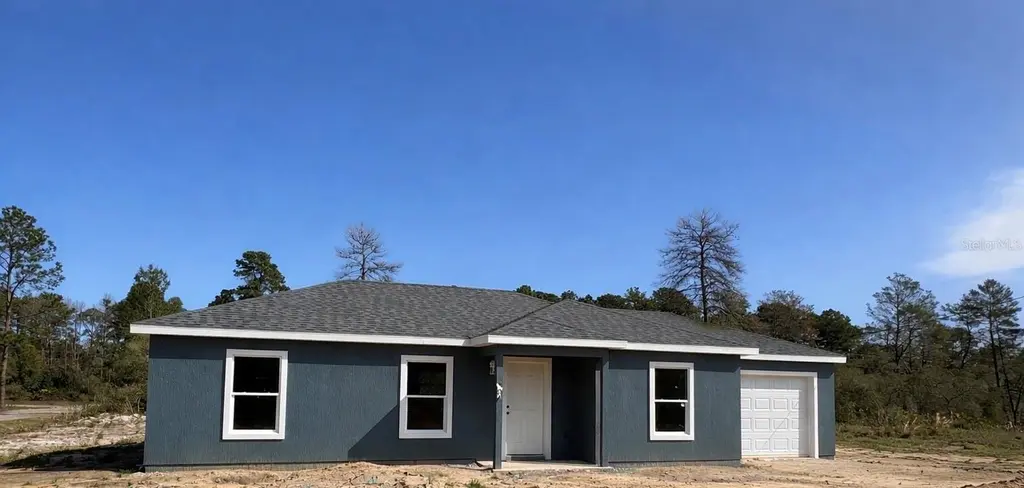
Under Construction. Welcome to the beautifully crafted “Legacy” model by Michael Alan Homes! This brand-new construction offers 3 bedrooms, 2 bathrooms, and a 1-car attached garage, perfectly situated on a desirable corner lot in Ocklawaha. Step inside to an open-concept floor plan featuring soaring cathedral ceilings and a split-bedroom layout for added privacy. The home is finished with luxury vinyl plank flooring throughout, complemented by granite countertops in both the kitchen and bathrooms. The modern kitchen includes a full stainless steel appliance package and overlooks the spacious living and dining areas—ideal for everyday living and entertaining. Additional highlights include an inside laundry room and quality finishes throughout. Don’t miss your opportunity to own this brand-new home! Estimated completion date 05/15/2026
Key facts
- 0.24 acre lot
- Garage
- Built 2026
Neighborhood map
What this means for you Summary
Snapshot
- This is a 3-bed/2.0-bath single-family listed at $215k. Condition is rated excellent.
Deal economics
- At list price, monthly cash flow is $-80 ($-962/yr) — negative.
- To cash-flow at today's rent, offer at most $203k (5.4% below list).
- To meet the 1% rule (rent ≥ 1% of price), the offer needs to be $178k (17.2% below list).
- Recommended offer: $178k (17.2% below list) — sets the bar for 1% rule.
Location & tenants
- Location reads: area grade D — affects rentability + tenant quality, not the cash-flow math above.
- Marion (rural): math 42% / reading 43% proficiency, ranked #61 of 73 in FL (top 84%) — families likely to look elsewhere, expect single-tenant / working-renter base with shorter leases; 61% free/reduced lunch — lower-income household profile, screen leases tightly.
- Zoned schools: Stanton-Weirsdale Elementary School (math 42% / reading 36%, grade F, #1,560 of 2,144 statewide, top 73%, 544 students, 70% FRL); Lake Weir Middle School (math 37% / reading 33%, grade F, #416 of 571 statewide, top 74%, 1,207 students, 76% FRL); Lake Weir High School (math 23% / reading 34%, grade F, #458 of 667 statewide, top 69%, 1,483 students, 68% FRL).
- Market conditions: 431 active listings in the ZIP; 9 comparable units currently listed for rent nearby; rentals at typical pace (median 23d on market — plan ~3-4 weeks tenant-placement turnaround); 7,071 units permitted in Marion County in 2024 (534 in 5+ unit buildings).
- At $1,779/mo this rent would consume 46% of the median local household income ($47k/yr) (locally 303% of renters already pay >50% of income on rent) — very limited rent-growth headroom before tenants either downsize or default.
Forward outlook
- Local home prices are declining (-3.0%/yr); year-one equity from $1k of loan paydown is wiped out by about $6k of value loss. Plan a longer hold.
- Marion County population projected at +13% by 2050 — modest demand growth; plan on rents tracking national, not racing it.
Negotiation context
- It's been on market 90 days — a 6% lower offer ($202k) is reasonable based on typical stale-listing flexibility.
Questions for the listing agent
- What do current leases actually rent for vs. the listed asking? Can we see a recent rent roll and the last 12 months of T-12 income?
- It's been on market 90 days. Have you received any prior offers? Is the seller open to a 17% concession, seller financing, or rate buy-down credit?
- Why hasn't it sold? Are there any deal-killer items the seller is aware of (foundation, flood, title, zoning, code violations)?
- Is there a deadline driving the sale (1031 exchange, divorce, estate, relocation)? That informs how much negotiation room exists.
- The area grade is low — what's the realistic commute time and amenity access for the typical tenant pool here? Any planned neighborhood developments (good or bad) we should know about?
- What's the average days-on-market for RENTAL listings here right now (not sales)? A rising rental-DOM trend means longer vacancies and softer asking-rent achievability than the comps imply.
- What's the recent tenant-quality profile in this submarket — average credit score on applications, eviction rate, late-payment / NSF rate, and stable-employment percentage? A property-management company in the area should have these aggregated.
- How much new for-sale + rental construction is in the pipeline within 1–3 miles? Heavy new supply typically softens prices + rents 12–24 months out; constrained supply supports both.
Investment metrics
- 1% rule
- 0.83% ✗
- Cap rate
- 5.85%
- Cash-on-cash
- -1.60%
- DSCR
- 0.93
- GRM
- 10.1
CMA / ARV
- ARV (median comp)
- $231,440
- List price
- $215,000
- Delta
- -7.10%
- Verdict
- FAIR
- Comps
- 13 within 1.0 mi
Show comp detail 2 sales within ~0.75 mi
| Address | Dist | Beds/Ba | Sqft | Sold | Price | $/sf | Match |
|---|---|---|---|---|---|---|---|
| 3 Malauka Radial Ct | 0.64mi | 3/2.0 | 1,170 (+7%) | 7mo | $214,000 | $183 | 52 |
| 41 Malauka Ln | 0.34mi | 3/2.0 | 1,231 (+13%) | 24mo | $225,000 | $183 | 43 |
Match score weights: distance 35% · size 25% · config 20% · recency 20%. Top-matched comps best support the ARV.
Projected returns pro-forma
-3.0% appreciation · 3.0% rent growth · sell at horizon
- IRR
- -18.9%
- Equity multiple
- 0.34×
- Total profit
- $-39,919
- Equity at exit
- $32,057
- IRR
- -11.4%
- Equity multiple
- 0.32×
- Total profit
- $-41,228
- Equity at exit
- $18,589
Cash invested: $60,200 (down + closing). Projections, not guarantees.
Landlord ↔ Tenant lean methodology
- Overall (STATE)
- 87 Strongly Landlord-Friendly
- State Florida
- 87 Strongly Landlord-Friendly · R+3
- County
- — inherits STATE
- City
- — inherits STATE
ZIP-level market 32179
- Home prices YoY
- -18.3%
- Active inventory
- 431
- Price-to-rent
- 10.1×
Monthly cashflow live
- Estimated rent
- $1,779 high interval (Pro) →
- Mortgage (P&I)
- −$1,127
- Tax est. 1.5%
- −$269 /mo · $3,225/yr
- Insurance
- −$90
- HOA
- −$0
- Vacancy / Maint / Mgmt
- −$374
- Net cashflow
- $-80
Break-even live
Sensitivity live
| Price | -10% $68 | -5% $-6 | +0% $-80 | +5% $-154 | +10% $-229 |
|---|---|---|---|---|---|
| Rent | -10% $-221 | -5% $-150 | +0% $-80 | +5% $-10 | +10% $60 |
| Rate | -1.0pp $28 | -0.5pp $-26 | base $-80 | +0.5pp $-136 | +1.0pp $-193 |
UW: 25.0% down · 7.5% · 30yr · 1.5% tax · 5.0% vac · 8.0% maint · 8.0% mgmt
Financing live
Cash to close
- Down payment
- $53,750
- Closing costs
- $6,450
- Reserves months
- —
- Total cash needed
- —
Loan-product check · same deal, 3 products live
Conventional
25% down · 7.5% · 30yr
- Down + closing
- —
- Monthly P&I
- —
- Monthly cashflow
- —
- DSCR
- —
- Eligible?
- —
Personal DTI + credit; lowest rate.
DSCR
20% down · 8.5% · 30yr
- Down + closing
- —
- Monthly P&I
- —
- Monthly cashflow
- —
- DSCR
- —
- Eligible?
- —
No personal income docs; deal must DSCR.
Hard money
10% down · 12.0% · 12mo
- Down + closing
- —
- Monthly P&I
- —
- Monthly cashflow
- —
- DSCR
- —
- Eligible?
- —
Short-term bridge; refi at stabilization.
Rent comps 9 comps
| Address | Beds | Baths | Sqft | Rent | $/sqft | DOM | Units | Dist |
|---|---|---|---|---|---|---|---|---|
| 3 Fisher Place Dr Ocklawaha, FL | 3.0 | 2.0 | 1350 | $1,640 | $1.21 | 23d | 1 | 0.11mi |
| 35 Malauka Cir Ocklawaha, FL | 3.0 | 2.0 | 1371 | $1,700 | $1.24 | 23d | 1 | 0.81mi |
| 122 Malauka Loop Ocklawaha, FL | 3.0 | 2.0 | 1323 | $1,675 | $1.27 | 23d | 1 | 0.81mi |
| 24 Malauka Loop Pl Ocklawaha, FL | 3.0 | 2.0 | 1319 | $1,625 | $1.23 | 15d | 1 | 1.04mi |
| 205 Malauka Loop Ocklawaha, FL | 3.0 | 2.0 | 1311 | $1,695 | $1.29 | 15d | 1 | 1.08mi |
| 17 Malauka Loop Pl Ocklawaha, FL | 3.0 | 2.0 | 1322 | $1,550 | $1.17 | 15d | 1 | 1.10mi |
| 338 Malauka Loop Ocklawaha, FL | 3.0 | 2.0 | 1311 | $1,895 | $1.45 | 15d | 1 | 1.22mi |
| 9 Malauka Loop Ocklawaha, FL | 3.0 | 2.0 | 1389 | $1,625 | $1.17 | 23d | 1 | 1.22mi |
| 9 Malauka Loop Ln Ocklawaha, FL | 3.0 | 2.0 | 1319 | $1,625 | $1.23 | 23d | 1 | 1.22mi |
Listing history 14 events
-
2026-06-15status $215,000 Pending 90 DOM
-
2026-06-15days on market $215,000 Active 90 DOM
-
2026-06-14days on market $215,000 Active 88 DOM
-
2026-06-13days on market $215,000 Active 87 DOM
-
2026-06-10days on market $215,000 Active 85 DOM
-
2026-06-09days on market $215,000 Active 84 DOM
-
2026-06-08days on market $215,000 Active 83 DOM
-
2026-06-07days on market $215,000 Active 82 DOM
-
2026-06-03days on market $215,000 Active 78 DOM
-
2026-06-02days on market $215,000 Active 77 DOM
-
2026-06-01days on market $215,000 Active 76 DOM
-
2026-05-31days on market $215,000 Active 75 DOM
-
2026-05-30days on market $215,000 Active 74 DOM
-
2026-03-17$215,000 Active 869-char remark
Show marketing remark (869 chars)
Under Construction. Welcome to the beautifully crafted “Legacy” model by Michael Alan Homes! This brand-new construction offers 3 bedrooms, 2 bathrooms, and a 1-car attached garage, perfectly situated on a desirable corner lot in Ocklawaha. Step inside to an open-concept floor plan featuring soaring cathedral ceilings and a split-bedroom layout for added privacy. The home is finished with luxury vinyl plank flooring throughout, complemented by granite countertops in both the kitchen and bathrooms. The modern kitchen includes a full stainless steel appliance package and overlooks the spacious living and dining areas—ideal for everyday living and entertaining. Additional highlights include an inside laundry room and quality finishes throughout. Don’t miss your opportunity to own this brand-new home! Estimated completion date 05/15/2026
ⓘ Source: listings_history table (triggers on properties + properties_extension) + one-shot
backfill from property_details.listing_events for pre-trigger history.
Nearby sold comps map
Loading sold comps map…
Walkable amenities ~0.75 mi
Loading nearby amenities…
Taxation est. · year 1
- Rental income
- $21,351
- − Mortgage interest
- −$12,043
- − Property taxes
- −$3,225
- − Insurance
- −$1,075
- − Repairs & maintenance
- −$1,708
- − Management
- −$1,708
- − Depreciation
- −$6,255
- Taxable loss
- −$4,663
- Est. tax savings @ 24.0%
- +$1,119
- After-tax cash flow
- $157/yr
For passive investors: Depreciation is non-cash, so a rental often shows a tax loss while cash-flowing — sheltering income. Rental losses are passive: they offset passive income freely, and up to $25,000/yr can offset ordinary (W-2) income if you actively participate and your MAGI is under $100k (phasing out to $0 by $150k); unused losses carry forward. On sale, claimed depreciation is recaptured at up to 25%, and gains may owe capital-gains tax (a 1031 exchange can defer both). Figures are a year-1 estimate at your 24.0% rate — not tax advice; consult a CPA.
Condition & rehab AI · 1 photo
This brand-new construction offers a beautifully crafted 'Legacy' model by Michael Alan Homes, featuring 3 bedrooms, 2 bathrooms, and a 1-car attached garage, all in excellent condition and ready for immediate occupancy.
Schools (NCES district)
- District
- Marion
- NCES district ID
- 1201260
- Math proficiency
- 42% ▼ -7.00%
- Reading proficiency
- 43% ▼ -4.00%
- Median HH income
- $40,015
- Composite
- 35.61/100
- National rank
- #4890
- State rank
- #61 of 73 in FL
Livability — Silver Springs Shores East
No livability data for this city. (Only ~50 U.S. cities are tracked.)
Census & demographics
- Census place
- Silver Springs Shores East, FL
- County
- Marion County · 315,796 people
- Metro
- Ocala, FL
- Population (ZIP)
- 9,318
- Household income
- $46,512
- Rent vs Own
- Severe rent burden
- 303.0
Population outlook (Marion County) Hauer SSP2
- Today (2025)
- 365,905 people
- By 2030
- 376,768 · +3.0%
- By 2040
- 396,555 · +8.4%
- By 2050
- 412,723 · +12.8%
- By 2075
- 446,090 · +21.9%
- By 2100
- 436,193 · +19.2%
Race, ethnicity, and origin ACS 2023
- Neighborhood character
- Predominantly White (81%)
- Race & ethnicity
- White 81% Two or more races 12% Hispanic / Latino 11%
- Hispanic origin (detail)
- Mexican 5% Puerto Rican 3% Cuban 3%
- Common ancestry
- Slovak 4% Romanian 2% Lithuanian 2%
- Foreign-born
- 5% · Canada
- Languages at home
- 93% English-only · Spanish 7%
Political lean MEDSL · Marion
- 2024 margin
- Solid R (+31.6) · D 33.8% · R 65.5%
- 2008→2024 swing
- -20.0pp toward R · 2008: -11.6pp · 2024: -31.6pp
- All cycles
- 2024: R+31.6 2020: R+25.9 2016: R+26.2 2012: R+16.2 2008: R+11.6
Not yet ingested
- Civics
- —
Market trends
- HPI YoY
- ▼ -54.21%
- Current HPI
- 242.0408
- Rent YoY
- —
- Metro
- Ocala, FL
- State GDP YoY
- ▲ 3.28%
- F500 in state
- 36
Industry mix (Fortune 500 HQ in FL)
| Industry | F500 HQs | Revenue |
|---|---|---|
| Industrial Technology | 2 | $29B |
|
||
| Insurance | 2 | $17B |
|
||
| Retail | 1 | $60B |
|
||
| Technology Distribution | 1 | $58B |
|
||
| Homebuilding | 1 | $35B |
|
||
| Technology Manufacturing | 1 | $35B |
|
||
Price history
1 event — show timeline
- 2026-03-17 Listed $215,000 Stellar MLS as Distributed by MLS Grid
Cash-flow waterfall
monthlySold comps — $/sqft
last 12 mo · ≤1 miLoading sold comps…