109 Merowey Ct · Chapin, SC
Flood risk 1/10 · Minimal
- FEMA flood zone
- X (unshaded)
- Chance of flooding over 30 yrs
- 0.0%
- Est. flood insurance / yr
- $507 – $1,088
Fire risk 4/10 · Minor
- Est. fire insurance / yr
- $783 – $1,453
Heat risk 7/10 · Major
- Hot days now (above 107°F)
- 7 days/yr
- Hot days in 30 yrs
- 17 days/yr
Wind risk 6/10 · Moderate
- Chance of severe wind over 30 yrs
- 56.0%
Air-quality risk 3/10 · Minor
- Unhealthy air days now
- 2 days/yr
- Unhealthy air days in 30 yrs
- 2 days/yr
Risk factors via First Street. Map © Google.
Why this score? — see what drove the D- grade
The composite is a weighted blend of 9 inputs, each scored 0–100. Each bar is that input's sub-score; the figure is the points it added to the 100-point composite (weight × sub-score).
- Cash flow +11.6/30.0
- ARV discount +7.5/15.0
- Schools +4.5/10.0
- 1% rule +4.2/10.0
- DSCR +3.4/10.0
- Livability +3.2/5.0
- Rent growth +2.5/5.0
- Condition / age +2.5/5.0
- Appreciation +0.0/10.0
$225,000
🖨 Deal sheet 📄 Offer letter ✓ Due diligence
Listing remarks
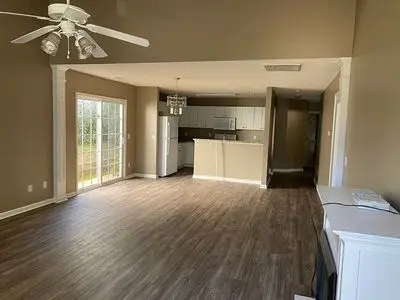
3 bedroom 2 full bath 1 car garage. The interior is freshly painted. The entire house has new flooring. New granite countertops. Porch is screened in. All appliances are provided including the washer and dryer. No smoking allowed in the unit. Renter is responsible for all utilities.
Key facts
- Screened in porch
- New flooring
- Built 2005
Tags
Neighborhood map
What this means for you Summary
Snapshot
- This is a 3-bed/2.0-bath single-family listed at $225k.
Deal economics
- At list price, monthly cash flow is $-72 ($-863/yr) — negative.
- To cash-flow at today's rent, offer at most $212k (5.6% below list).
- To meet the 1% rule (rent ≥ 1% of price), the offer needs to be $206k (8.3% below list).
- Recommended offer: $206k (8.3% below list) — sets the bar for 1% rule.
Location & tenants
- Location reads 65/100 on livability (#133 in SC) — a middle-class / working-renter tenant base. Strengths: schools A+, cost of living A+, housing A+; Watch: crime C-, employment C-, amenities F.
- Lexington 05 (suburban): math 47% / reading 55% proficiency, ranked #5 of 80 in SC (top 6%) — acceptable for families but not a draw, mixed tenant base, ~2y average lease.
- Market conditions: 434 active listings in the ZIP; 5 comparable units currently listed for rent nearby; rentals leasing fast (median 3d on market — plan ~1-2 weeks tenant-placement turnaround); high-income renter base; 1,712 units permitted in Lexington County in 2024 (0 in 5+ unit buildings).
Forward outlook
- Local home prices are declining (-3.0%/yr); year-one equity from $2k of loan paydown is wiped out by about $7k of value loss. Plan a longer hold.
- Lexington County population projected at +26% by 2050 — long-run rental-demand tailwind backs the buy-and-hold thesis.
Negotiation context
- Only 1 days on market — expect competitive offers; lowballing is unlikely to land.
- 4 sale attempts since 4y ago with the ask held roughly flat each time — persistent listings suggest the price (not the market) is what's stuck; bring a comps-based counter.
- Current owner paid $190k; 18% above their basis — modest negotiation headroom, anchor on the comps not their cost.
Risks & watch-outs
- Climate carrying-cost: major wind risk, 56% chance of damaging wind over 30y; extreme-heat days projected 7→17/yr by 2055 (HVAC capex compounding) — expect insurance premiums to compound above CPI over the hold.
Questions for the listing agent
- What do current leases actually rent for vs. the listed asking? Can we see a recent rent roll and the last 12 months of T-12 income?
- Is there a deadline driving the sale (1031 exchange, divorce, estate, relocation)? That informs how much negotiation room exists.
- Schools are A-rated — typically a magnet for longer-tenancy family renters. What's the average tenant stay here, and is there a school-zone premium baked into asking?
- The area grade is low — what's the realistic commute time and amenity access for the typical tenant pool here? Any planned neighborhood developments (good or bad) we should know about?
- What's the average days-on-market for RENTAL listings here right now (not sales)? A rising rental-DOM trend means longer vacancies and softer asking-rent achievability than the comps imply.
- What's the recent tenant-quality profile in this submarket — average credit score on applications, eviction rate, late-payment / NSF rate, and stable-employment percentage? A property-management company in the area should have these aggregated.
- How much new for-sale + rental construction is in the pipeline within 1–3 miles? Heavy new supply typically softens prices + rents 12–24 months out; constrained supply supports both.
Investment metrics
- 1% rule
- 0.92% ✗
- Cap rate
- 5.91%
- Cash-on-cash
- -1.37%
- DSCR
- 0.94
- GRM
- 9.1
CMA / ARV
No comps found within radius.
Projected returns pro-forma
-3.0% appreciation · 3.0% rent growth · sell at horizon
- IRR
- -18.5%
- Equity multiple
- 0.35×
- Total profit
- $-40,922
- Equity at exit
- $33,548
- IRR
- -10.7%
- Equity multiple
- 0.35×
- Total profit
- $-41,044
- Equity at exit
- $19,454
Cash invested: $63,000 (down + closing). Projections, not guarantees.
Landlord ↔ Tenant lean methodology
- Overall (STATE)
- 90 Strongly Landlord-Friendly
- State South Carolina
- 90 Strongly Landlord-Friendly · R+6
- County
- — inherits STATE
- City
- — inherits STATE
ZIP-level market 29036
- Active inventory
- 434
- Price-to-rent
- 9.1×
Monthly cashflow live
- Estimated rent
- $2,062 high interval (Pro) →
- Mortgage (P&I)
- −$1,180
- Tax from tax record
- −$427 /mo · $5,129/yr
- Insurance
- −$94
- HOA
- −$0
- Vacancy / Maint / Mgmt
- −$433
- Net cashflow
- $-72
Break-even live
UW: 25.0% down · 7.5% · 30yr · 1.5% tax · 5.0% vac · 8.0% maint · 8.0% mgmt
Financing live
Cash to close
- Down payment
- $56,250
- Closing costs
- $6,750
- Reserves months
- —
- Total cash needed
- —
Loan-product check · same deal, 3 products live
Conventional
25% down · 7.5% · 30yr
- Down + closing
- —
- Monthly P&I
- —
- Monthly cashflow
- —
- DSCR
- —
- Eligible?
- —
Personal DTI + credit; lowest rate.
DSCR
20% down · 8.5% · 30yr
- Down + closing
- —
- Monthly P&I
- —
- Monthly cashflow
- —
- DSCR
- —
- Eligible?
- —
No personal income docs; deal must DSCR.
Hard money
10% down · 12.0% · 12mo
- Down + closing
- —
- Monthly P&I
- —
- Monthly cashflow
- —
- DSCR
- —
- Eligible?
- —
Short-term bridge; refi at stabilization.
Rent comps 5 comps
| Address | Beds | Baths | Sqft | Rent | $/sqft | DOM | Units | Dist |
|---|---|---|---|---|---|---|---|---|
| 120 W Horn Ct Chapin, SC | 2.0 | 2.0 | 1080 | $1,995 | $1.85 | 21d | 1 | 0.12mi |
| 151 Fair Haven Way Chapin, SC | 2.0 | 2.0 | 1080 | $1,625 | $1.50 | 3d | 1 | 0.14mi |
| 129 Fair Haven Way Chapin, SC | 2.0 | 2.0 | 1080 | $1,550 | $1.44 | 3d | 1 | 0.18mi |
| 305 Clark St Chapin, SC | 3.0 | 2.0 | 1650 | $1,750 | $1.06 | 3d | 1 | 0.46mi |
| 206 Columbia Ave Chapin, SC | 3.0 | 2.0 | 1435 | $1,625 | $1.13 | 3d | 1 | 0.63mi |
Listing history 8 events
-
2026-05-26$225,000 Active
-
2022-09-02soldstatus $190,000
-
2022-08-24historical
-
2022-08-23status Active
-
2022-08-20historical
-
2022-08-17status Active
-
2022-07-03historical
-
2022-06-29$200,000 Active
ⓘ Source: listings_history table (triggers on properties + properties_extension) + one-shot
backfill from property_details.listing_events for pre-trigger history.
Tax reassessment forecast SC · Resets to sale price
- Current annual tax
- $5,129 · $427/mo
- Projected year-2 tax
- $5,129 · $427/mo
- Expected delta
- $0/yr ($0/mo · 0.0%)
ⓘ Screening estimate from a state-policy table — verify with the county assessor before closing.
Climate risk First Street
- Flood 1/10 Low FEMA zone X (unshaded) · 0% chance over 30 yrs
- Wildfire 4/10 Moderate
- Heat 7/10 Severe 7 d/yr ≥107°F today · 17 d/yr by 30 yrs out
- Wind 6/10 Major 56% chance of damaging wind over 30 yrs
- Air quality 3/10 Moderate 2 unhealthy d/yr today · 2 by 30 yrs out
Nearby sold comps map
Loading sold comps map…
Walkable amenities ~0.75 mi
Loading nearby amenities…
Taxation est. · year 1
- Rental income
- $24,747
- − Mortgage interest
- −$12,603
- − Property taxes
- −$5,129
- − Insurance
- −$1,125
- − Repairs & maintenance
- −$1,980
- − Management
- −$1,980
- − Depreciation
- −$6,545
- Taxable loss
- −$4,616
- Est. tax savings @ 24.0%
- +$1,108
- After-tax cash flow
- $244/yr
For passive investors: Depreciation is non-cash, so a rental often shows a tax loss while cash-flowing — sheltering income. Rental losses are passive: they offset passive income freely, and up to $25,000/yr can offset ordinary (W-2) income if you actively participate and your MAGI is under $100k (phasing out to $0 by $150k); unused losses carry forward. On sale, claimed depreciation is recaptured at up to 25%, and gains may owe capital-gains tax (a 1031 exchange can defer both). Figures are a year-1 estimate at your 24.0% rate — not tax advice; consult a CPA.
Schools (NCES district)
- District
- Lexington 05
- NCES district ID
- 4502820
- Math proficiency
- 47% ▼ -7.00%
- Reading proficiency
- 55% ▼ -4.00%
- Median HH income
- $67,732
- Composite
- 45.28/100
- National rank
- #2656
- State rank
- #5 of 80 in SC
Livability — Chapin
- Score
- 65/100
- State rank
- #133
- US rank
- #12994
Category grades
Schools grade is shown separately in the Schools card above.
Census & demographics
- Census place
- Chapin, SC
- County
- Lexington County · 232,571 people
- City population
- 26,620
- Metro
- Columbia, SC
- Population (ZIP)
- 26,620
- Household income
- $113,986
- Rent vs Own
- Severe rent burden
- 212.0
Population outlook (Lexington County) Hauer SSP2
- Today (2025)
- 322,999 people
- By 2030
- 342,356 · +6.0%
- By 2040
- 377,715 · +16.9%
- By 2050
- 406,984 · +26.0%
- By 2075
- 465,447 · +44.1%
- By 2100
- 485,674 · +50.4%
Race, ethnicity, and origin ACS 2023
- Neighborhood character
- Predominantly White (86%)
- Race & ethnicity
- White 86% Asian 5% Two or more races 4% Black 3% Hispanic / Latino 3%
- Common ancestry
- Lithuanian 4% Slovak 4% Italian 2%
- Foreign-born
- 6% · Canada, South Korea, China
- Languages at home
- 95% English-only · Other Indo-European 2% Spanish 1% Korean 1%
Political lean MEDSL · Lexington
- 2024 margin
- Solid R (+33.5) · D 32.5% · R 66.0% · Other 1.4%
- 2008→2024 swing
- +4.6pp toward D · 2008: -38.0pp · 2024: -33.5pp
- All cycles
- 2024: R+33.5 2020: R+30.1 2016: R+36.7 2012: R+37.8 2008: R+38.0
Not yet ingested
- Civics
- —
Market trends
- HPI YoY
- ▼ -134.76%
- Current HPI
- 248.3807
- Rent YoY
- —
- Metro
- Columbia, SC
- State GDP YoY
- ▲ 4.51%
- F500 in state
- 2
Industry mix (Fortune 500 HQ in SC)
| Industry | F500 HQs | Revenue |
|---|---|---|
| Packaging | 1 | $7B |
|
||
Price history
+12.5% since first listed8 events — show timeline
- 2026-05-26 Listed $225,000 FSBO.com
- 2022-09-02 Sold (Public Records) $190,000 Public Records
- 2022-08-24 Delisted — Consolidated MLS
- 2022-08-23 Relisted — Consolidated MLS
- 2022-08-20 Delisted — Consolidated MLS
- 2022-08-17 Relisted — Consolidated MLS
- 2022-07-03 Delisted — Consolidated MLS
- 2022-06-29 Listed $200,000 Consolidated MLS
Property tax history
+10.9%/yrLatest (2024): $5,129 · +0.2% YoY. Source: county tax records.
Cash-flow waterfall
monthlySold comps — $/sqft
last 12 mo · ≤1 miLoading sold comps…