14105 Whispering Mdws · Sherwood Shores, TX
Flood risk 1/10 · Minimal
- FEMA flood zone
- —
- Chance of flooding over 30 yrs
- 0.0%
- Est. flood insurance / yr
- —
Fire risk 4/10 · Minor
- Est. fire insurance / yr
- $2,463 – $4,575
Heat risk 6/10 · Moderate
- Hot days now (above 110°F)
- 7 days/yr
- Hot days in 30 yrs
- 21 days/yr
Wind risk 4/10 · Minor
- Chance of severe wind over 30 yrs
- 19.0%
Air-quality risk 3/10 · Minor
- Unhealthy air days now
- 3 days/yr
- Unhealthy air days in 30 yrs
- 3 days/yr
Risk factors via First Street. Map © Google.
Why this score? — see what drove the B- grade
The composite is a weighted blend of 9 inputs, each scored 0–100. Each bar is that input's sub-score; the figure is the points it added to the 100-point composite (weight × sub-score).
- Cash flow +20.3/30.0
- ARV discount +15.0/15.0
- Appreciation +10.0/10.0
- DSCR +6.4/10.0
- 1% rule +4.2/10.0
- Rent growth +2.5/5.0
- Schools +2.5/10.0
- Livability +2.5/5.0
- Condition / age +2.5/5.0
$249,000
🖨 Deal sheet 📄 Offer letter ✓ Due diligence
Listing remarks
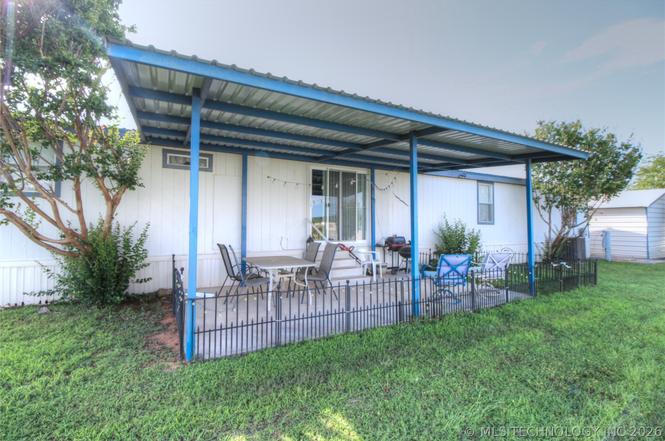
End-of-the-Road Comfort with a Shop Built for Lake Life! Welcome to this well-maintained Palm Harbor manufactured home tucked away at the end of a quiet road in the highly desirable Twin Ponds Development—a golf cart friendly community just minutes from Buncombe Creek Marina. This property offers the perfect blend of functionality and fun: Covered front porch for morning coffee Covered back patio for relaxing evenings Covered side parking for extra convenience And best of all—a 1,500 sq ft shop building ready to store all your lake toys, tools, and gear! Built on concrete runners, this home is already positioned for better financing options. Whether you're looking for a we
Key facts
- Covered front porch
- Shop building
- Covered side parking
Tags
Property features AI
Finance
- Other: Boat ramp/lift access to Texoma Lake
- HOA & community: Marina access; Less than 5 miles to water
Exterior
- Parking: Detached garage; Carport; 1 garage space
- Security: Smoke detector(s); No safety shelter
- Utilities: Electricity available; Water available (rural); Septic tank
- Home design: Double wide manufactured home; Single-story; Faces west; Crawlspace / permanent foundation
- Construction: HardiPlank-type siding; Manufactured construction; Metal roof; Built (year per public records)
- Exterior features: Covered patio/porch; Patio; Porch; Workshop; No other listed exterior features
Interior
- Kitchen: Dishwasher; Oven; Range; Electric water heater
- Flooring: Carpet; Vinyl
- Bathrooms: 2 full bathrooms
- Heating & cooling: Central heating (electric); Central air conditioning
- Interior features: Granite counters; Laminate counters; Ceiling fan(s); Electric range connection; Wood-burning fireplace (1)
- Laundry & utility: Washer hookup; Electric dryer hookup
Neighborhood map
What this means for you Summary
Snapshot
- This is a 3-bed/2.0-bath manufactured listed at $249k.
Deal economics
- At list price, monthly cash flow is $318 ($4k/yr) — positive.
- The deal already cash-flows at list — no discount required.
- To meet the 1% rule (rent ≥ 1% of price), the offer needs to be $228k (8.5% below list).
- Recommended offer: $219k (12.0% below list) — sets the bar for market timing.
- Cap rate 7.8% vs local median 2.8% in Sherwood Shores — top-decile yield for the area; either an underpriced asset or a hidden risk that comps aren't pricing in. Stress-test before assuming the spread holds.
Location & tenants
- Location reads 49/100 on livability (#1,519 in TX) — a working-class tenant base; expect higher turnover. Strengths: cost of living A+, housing A+; Watch: schools F, crime F, amenities F.
- Kingston (rural): math 27% / reading 32% proficiency, ranked #70 of 270 in OK (top 26%) — low school quality limits family demand, transient renter base, plan for 1-2y turnover; 76% free/reduced lunch — lower-income household profile, screen leases tightly.
- Market conditions: 42 units permitted in Marshall County in 2024 (0 in 5+ unit buildings).
Forward outlook
- In year one you build about $27k of equity ($2k loan paydown + $25k appreciation (10.0% local appreciation)).
- Marshall County population projected at +22% by 2050 — long-run rental-demand tailwind backs the buy-and-hold thesis.
- At projected returns (10.0% appreciation + 3.0% rent growth), your $70k cash investment doubles in ~3 years — after that, you're playing with house money.
- By year 2, paydown + projected appreciation supports a ~$43k cash-out refi (75% LTV) — recoverable capital for the next deal without selling this one.
Negotiation context
- It's been on market 165 days — a 12% lower offer ($219k) is reasonable based on typical stale-listing flexibility.
- 4 sale attempts since 2y ago; this cycle's ask has dropped $20k (7%) from the opening price — seller is motivated, your offer sets the floor, not the list.
Risks & watch-outs
- Climate carrying-cost: extreme-heat days projected 7→21/yr by 2055 (HVAC capex compounding) — expect insurance premiums to compound above CPI over the hold.
Questions for the listing agent
- It's been on market 165 days. Have you received any prior offers? Is the seller open to a 12% concession, seller financing, or rate buy-down credit?
- Why hasn't it sold? Are there any deal-killer items the seller is aware of (foundation, flood, title, zoning, code violations)?
- Is there a deadline driving the sale (1031 exchange, divorce, estate, relocation)? That informs how much negotiation room exists.
- Schools are F-rated, which usually means shorter tenancies and higher turnover. Who's the typical renter profile here, and what's been the actual vacancy rate?
- Crime grade is F in this area — have there been break-ins, vandalism, or insurance claims at this property in the last 3 years? What carrier currently insures it and at what premium?
- What's the average days-on-market for RENTAL listings here right now (not sales)? A rising rental-DOM trend means longer vacancies and softer asking-rent achievability than the comps imply.
- What's the recent tenant-quality profile in this submarket — average credit score on applications, eviction rate, late-payment / NSF rate, and stable-employment percentage? A property-management company in the area should have these aggregated.
- How much new for-sale + rental construction is in the pipeline within 1–3 miles? Heavy new supply typically softens prices + rents 12–24 months out; constrained supply supports both.
Investment metrics
- 1% rule
- 0.92% ✗
- Cap rate
- 7.83%
- Cash-on-cash
- 5.47%
- DSCR
- 1.24
- GRM
- 9.1
CMA / ARV
- ARV (on-the-fly)
- $392,224
- Comps found
- 4
Show comp detail 4 sales within ~0.75 mi
| Address | Dist | Beds/Ba | Sqft | Sold | Price | $/sf | Match |
|---|---|---|---|---|---|---|---|
| 4648 Angler Cir | 0.17mi | 3/2.5 | 1,792 (-6%) | 7mo | $370,000 | $206 | 75 |
| 14314 Whispering Mdws | 0.23mi | 3/2.0 | 1,680 (-12%) | 3mo | $365,000 | $217 | 67 |
| 14113 Baldwin Ln | 0.08mi | 3/2.0 | 1,680 (-12%) | 22mo | $310,000 | $185 | 59 |
| 14049 Pond View Dr | 0.13mi | 4/2.0 (+1) | 1,680 (-12%) | 24mo | $179,000 | $107 | 50 |
Match score weights: distance 35% · size 25% · config 20% · recency 20%. Top-matched comps best support the ARV.
Projected returns pro-forma
10.0% appreciation · 3.0% rent growth · sell at horizon
- IRR
- 28.2%
- Equity multiple
- 3.23×
- Total profit
- $155,755
- Equity at exit
- $224,319
- IRR
- 24.6%
- Equity multiple
- 7.35×
- Total profit
- $442,522
- Equity at exit
- $483,752
Cash invested: $69,720 (down + closing). Projections, not guarantees.
Landlord ↔ Tenant lean methodology
- Overall (STATE)
- 87 Strongly Landlord-Friendly
- State Texas
- 87 Strongly Landlord-Friendly · R+5
- County
- — inherits STATE
- City
- — inherits STATE
ZIP-level market 73439
- Home prices YoY
- 12.3%
- Price-to-rent
- 9.1×
Monthly cashflow live
- Estimated rent
- $2,279 medium interval (Pro) →
- Mortgage (P&I)
- −$1,306
- Tax from tax record
- −$73 /mo · $874/yr
- Insurance
- −$104
- HOA
- −$0
- Vacancy / Maint / Mgmt
- −$479
- Net cashflow
- $318
Break-even live
UW: 25.0% down · 7.5% · 30yr · 1.5% tax · 5.0% vac · 8.0% maint · 8.0% mgmt
Financing live
Cash to close
- Down payment
- $62,250
- Closing costs
- $7,470
- Reserves months
- —
- Total cash needed
- —
Loan-product check · same deal, 3 products live
Conventional
25% down · 7.5% · 30yr
- Down + closing
- —
- Monthly P&I
- —
- Monthly cashflow
- —
- DSCR
- —
- Eligible?
- —
Personal DTI + credit; lowest rate.
DSCR
20% down · 8.5% · 30yr
- Down + closing
- —
- Monthly P&I
- —
- Monthly cashflow
- —
- DSCR
- —
- Eligible?
- —
No personal income docs; deal must DSCR.
Hard money
10% down · 12.0% · 12mo
- Down + closing
- —
- Monthly P&I
- —
- Monthly cashflow
- —
- DSCR
- —
- Eligible?
- —
Short-term bridge; refi at stabilization.
Listing history 25 events
-
2026-06-19days on market $249,000 Active 165 DOM
-
2026-06-18days on market $249,000 Active 164 DOM
-
2026-06-17days on market $249,000 Active 163 DOM
-
2026-06-16days on market $249,000 Active 162 DOM
-
2026-06-15days on market $249,000 Active 161 DOM
-
2026-06-14days on market $249,000 Active 159 DOM
-
2026-06-13days on market $249,000 Active 158 DOM
-
2026-06-10days on market $249,000 Active 156 DOM
-
2026-06-09days on market $249,000 Active 155 DOM
-
2026-06-08days on market $249,000 Active 154 DOM
-
2026-06-07days on market $249,000 Active 153 DOM
-
2026-06-05days on market $249,000 Active 150 DOM
-
2026-06-02days on market $249,000 Active 148 DOM
-
2026-06-01days on market $249,000 Active 147 DOM
-
2026-05-31days on market $249,000 Active 146 DOM
-
2026-05-30days on market $249,000 Active 145 DOM
-
2026-03-19price $249,000
-
2026-01-05$269,000 Active
-
2026-01-02historical
-
2025-07-02$269,000 Active
-
2025-05-25historical
-
2024-11-25$285,000 Active
-
2024-11-24historical
-
2024-07-01price $285,000
-
2024-05-24$315,000 Active
ⓘ Source: listings_history table (triggers on properties + properties_extension) + one-shot
backfill from property_details.listing_events for pre-trigger history.
Tax reassessment forecast TX · Resets to sale price
- Current annual tax
- $874 · $73/mo
- Projected year-2 tax
- $4,557 · $380/mo
- Expected delta
- +$3,683/yr (+$307/mo · 421.4%)
ⓘ Screening estimate from a state-policy table — verify with the county assessor before closing.
Climate risk First Street
- Flood 1/10 Low 0% chance over 30 yrs
- Wildfire 4/10 Moderate
- Heat 6/10 Major 7 d/yr ≥110°F today · 21 d/yr by 30 yrs out
- Wind 4/10 Moderate 19% chance of damaging wind over 30 yrs
- Air quality 3/10 Moderate 3 unhealthy d/yr today · 3 by 30 yrs out
Nearby sold comps map
Loading sold comps map…
Walkable amenities ~0.75 mi
Loading nearby amenities…
Taxation est. · year 1
- Rental income
- $27,348
- − Mortgage interest
- −$13,948
- − Property taxes
- −$874
- − Insurance
- −$1,245
- − Repairs & maintenance
- −$2,188
- − Management
- −$2,188
- − Depreciation
- −$7,244
- Taxable loss
- −$338
- Est. tax savings @ 24.0%
- +$81
- After-tax cash flow
- $3,898/yr
For passive investors: Depreciation is non-cash, so a rental often shows a tax loss while cash-flowing — sheltering income. Rental losses are passive: they offset passive income freely, and up to $25,000/yr can offset ordinary (W-2) income if you actively participate and your MAGI is under $100k (phasing out to $0 by $150k); unused losses carry forward. On sale, claimed depreciation is recaptured at up to 25%, and gains may owe capital-gains tax (a 1031 exchange can defer both). Figures are a year-1 estimate at your 24.0% rate — not tax advice; consult a CPA.
Schools (NCES district)
- District
- Kingston
- NCES district ID
- 4016590
- Math proficiency
- 27% ▼ -7.00%
- Reading proficiency
- 32% ▼ -7.00%
- Median HH income
- $40,655
- Composite
- 24.88/100
- National rank
- #7585
- State rank
- #70 of 270 in OK
Livability — Sherwood Shores
- Score
- 49/100
- State rank
- #1519
- US rank
- #25941
Category grades
Schools grade is shown separately in the Schools card above.
Census & demographics
- Population (ZIP)
- 7,011
Population outlook (Marshall County) Hauer SSP2
- Today (2025)
- 17,405 people
- By 2030
- 18,038 · +3.6%
- By 2040
- 19,513 · +12.1%
- By 2050
- 21,283 · +22.3%
- By 2075
- 27,884 · +60.2%
- By 2100
- 35,435 · +103.6%
Race, ethnicity, and origin ACS 2023
- Neighborhood character
- Predominantly White (75%)
- Race & ethnicity
- White 75% Two or more races 16% Native American 5% Hispanic / Latino 4%
- Common ancestry
- Lithuanian 3% Italian 2% Serbian 1%
- Foreign-born
- 1% · Canada
- Languages at home
- 97% English-only · Spanish 3%
Political lean MEDSL · Marshall
- 2024 margin
- Solid R (+63.4) · D 17.7% · R 81.2% · Other 1.1%
- 2008→2024 swing
- -24.6pp toward R · 2008: -38.8pp · 2024: -63.4pp
- All cycles
- 2024: R+63.4 2020: R+62.5 2016: R+56.6 2012: R+45.7 2008: R+38.8
Not yet ingested
- Civics
- —
Market trends
- HPI YoY
- ▲ 26.96%
- Current HPI
- 246.2253
- Rent YoY
- —
- Metro
- —
- State GDP YoY
- ▲ 3.95%
- F500 in state
- 110
Industry mix (Fortune 500 HQ in TX)
| Industry | F500 HQs | Revenue |
|---|---|---|
| Energy | 16 | $1,198B |
|
||
| Technology | 5 | $198B |
|
||
| Engineering / Construction | 4 | $72B |
|
||
| Energy Services | 3 | $60B |
|
||
| Utilities | 3 | $41B |
|
||
| Healthcare | 2 | $330B |
|
||
Price history
-21.0% since first listed9 events — show timeline
- 2026-03-19 Price Changed $249,000 MLS Technology, Inc.
- 2026-01-05 Listed $269,000 MLS Technology, Inc.
- 2026-01-02 Listing Removed — MLS Technology, Inc.
- 2025-07-02 Listed $269,000 MLS Technology, Inc.
- 2025-05-25 Listing Removed — MLS Technology, Inc.
- 2024-11-25 Listed $285,000 MLS Technology, Inc.
- 2024-11-24 Listing Removed — MLS Technology, Inc.
- 2024-07-01 Price Changed $285,000 MLS Technology, Inc.
- 2024-05-24 Listed $315,000 MLS Technology, Inc.
Property tax history
+2.7%/yrLatest (2025): $874 · +4.3% YoY. Source: county tax records.
Cash-flow waterfall
monthlySold comps — $/sqft
last 12 mo · ≤1 miLoading sold comps…