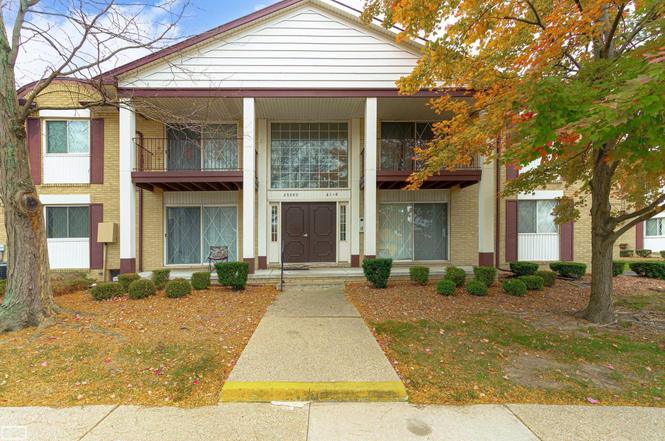
29200 Gloede St #135 · Warren, MI
Flood risk 1/10 · Minimal
- FEMA flood zone
- X (unshaded)
- Chance of flooding over 30 yrs
- 0.0%
- Est. flood insurance / yr
- $507 – $1,088
Fire risk 1/10 · Minimal
- Est. fire insurance / yr
- $784 – $1,456
Heat risk 3/10 · Minor
- Hot days now (above 96°F)
- 7 days/yr
- Hot days in 30 yrs
- 15 days/yr
Wind risk 1/10 · Minimal
- Chance of severe wind over 30 yrs
- —
Air-quality risk 3/10 · Minor
- Unhealthy air days now
- 3 days/yr
- Unhealthy air days in 30 yrs
- 4 days/yr
Risk factors via First Street. Map © Google.
Why this score? — see what drove the C grade
The composite is a weighted blend of 9 inputs, each scored 0–100. Each bar is that input's sub-score; the figure is the points it added to the 100-point composite (weight × sub-score).
- Cash flow +21.2/30.0
- 1% rule +10.0/10.0
- ARV discount +7.5/15.0
- DSCR +6.7/10.0
- Livability +3.7/5.0
- Schools +2.7/10.0
- Rent growth +2.5/5.0
- Condition / age +2.5/5.0
- Appreciation +0.0/10.0
$74,900
🖨 Deal sheet 📄 Offer letter ✓ Due diligence
Listing remarks
Welcome home to Lancaster Woods! This inviting and cozy FIRST FLOOR condo has recent updates including new Furnace, new drywall, brand-new carpet, new laminate flooring, new tile flooring and vanity in the bathroom, and new lighting with updated electrical wiring—giving the entire space a fresh, modern feel. The spacious, open-concept layout is filled with natural light. Enjoy sunsets on your patio or in the Living Room through the large sliding door. Community amenities include parking spaces, a swimming pool and clubhouse, common basement with coin laundry and secured storage. The monthly association fee covers gas, water, and common area maintenance. Rentals are permitted after 2 y
Key facts
- New drywall
- New tile flooring
- New furnace
Tags
Neighborhood map
What this means for you Summary
Snapshot
- This is a 1-bed/1.0-bath condo listed at $75k.
Deal economics
- At list price, monthly cash flow is $108 ($1k/yr) — positive.
- The deal already cash-flows at list — no discount required.
- Meets the 1% rule at list price ($1k rent vs $75k).
- Cap rate 8.0% vs local median 5.3% in Warren — top-decile yield for the area; either an underpriced asset or a hidden risk that comps aren't pricing in. Stress-test before assuming the spread holds.
Location & tenants
- Location reads 74/100 on livability (#171 in MI, #4,491 nationally) — a middle-class / working-renter tenant base. Strengths: commute A+, cost of living A+, housing A+; Watch: schools D, amenities D, employment D.
- Warren Woods Public Schools (urban): math 23% / reading 40% proficiency, ranked #336 of 540 in MI (top 62%) — families likely to look elsewhere, expect single-tenant / working-renter base with shorter leases.
- Market conditions: 109 active listings in the ZIP; 4 comparable units currently listed for rent nearby; rentals lingering (median 44d on market — plan ~5-8 weeks vacancy on turnover, expect pricing pressure); 75% of comp listings sitting > 30 days — soft ceiling on asking rent; 1,321 units permitted in Macomb County in 2024 (86 in 5+ unit buildings).
Forward outlook
- Local home prices are declining (-3.0%/yr); year-one equity from $518 of loan paydown is wiped out by about $2k of value loss. Plan a longer hold.
- Macomb County population projected at +9% by 2050 — modest demand growth; plan on rents tracking national, not racing it.
Negotiation context
- Only 1 days on market — expect competitive offers; lowballing is unlikely to land.
- 8 sale attempts since 14y ago; this cycle's ask has dropped $4k (5%) from the opening price — seller is motivated, your offer sets the floor, not the list.
- Current owner paid $19k; list at $75k implies a 294% gain — meaningful room to come down on a strong offer.
Risks & watch-outs
- Watch-outs: HOA is 28% of rent.
Questions for the listing agent
- Built in 1968 — when were the roof, HVAC, electrical panel, plumbing, and water heater last replaced?
- What does the HOA fee cover, when was the last increase, and are there any pending special assessments or reserve-fund shortfalls?
- Any open or pending special assessments — roof, HVAC, plumbing, elevator, façade? What's the per-unit balance and payoff schedule, and is the seller paying it off at close or rolling it to the buyer?
- Is there a deadline driving the sale (1031 exchange, divorce, estate, relocation)? That informs how much negotiation room exists.
- Schools are D-rated, which usually means shorter tenancies and higher turnover. Who's the typical renter profile here, and what's been the actual vacancy rate?
- Crime grade is D in this area — have there been break-ins, vandalism, or insurance claims at this property in the last 3 years? What carrier currently insures it and at what premium?
- What's the average days-on-market for RENTAL listings here right now (not sales)? A rising rental-DOM trend means longer vacancies and softer asking-rent achievability than the comps imply.
- What's the recent tenant-quality profile in this submarket — average credit score on applications, eviction rate, late-payment / NSF rate, and stable-employment percentage? A property-management company in the area should have these aggregated.
- How much new apartment / multifamily construction is in the pipeline within 1–3 miles? Heavy new supply (>2% of stock underway) typically softens rents 12–24 months out; light construction supports rent growth.
Investment metrics
- 1% rule
- 1.61% ✓
- Cap rate
- 8.02%
- Cash-on-cash
- 6.18%
- DSCR
- 1.27
- GRM
- 5.2
CMA / ARV
No comps found within radius.
Projected returns pro-forma
-3.0% appreciation · 3.0% rent growth · sell at horizon
- IRR
- -6.5%
- Equity multiple
- 0.76×
- Total profit
- $-5,038
- Equity at exit
- $11,168
- IRR
- 3.5%
- Equity multiple
- 1.26×
- Total profit
- $5,367
- Equity at exit
- $6,476
Cash invested: $20,972 (down + closing). Projections, not guarantees.
Landlord ↔ Tenant lean methodology
- Overall (STATE)
- 62 Landlord-Friendly
- State Michigan
- 62 Landlord-Friendly · EVEN
- County
- — inherits STATE
- City
- — inherits STATE
ZIP-level market 48088
- Active inventory
- 109
- Price-to-rent
- 5.2×
Monthly cashflow live
- Estimated rent
- $1,209 medium interval (Pro) →
- Mortgage (P&I)
- −$393
- Tax from tax record
- −$83 /mo · $1,000/yr
- Insurance
- −$31
- HOA
- −$340
- Vacancy / Maint / Mgmt
- −$254
- Net cashflow
- $108
Break-even live
UW: 25.0% down · 7.5% · 30yr · 1.5% tax · 5.0% vac · 8.0% maint · 8.0% mgmt
Financing live
Cash to close
- Down payment
- $18,725
- Closing costs
- $2,247
- Reserves months
- —
- Total cash needed
- —
Loan-product check · same deal, 3 products live
Conventional
25% down · 7.5% · 30yr
- Down + closing
- —
- Monthly P&I
- —
- Monthly cashflow
- —
- DSCR
- —
- Eligible?
- —
Personal DTI + credit; lowest rate.
DSCR
20% down · 8.5% · 30yr
- Down + closing
- —
- Monthly P&I
- —
- Monthly cashflow
- —
- DSCR
- —
- Eligible?
- —
No personal income docs; deal must DSCR.
Hard money
10% down · 12.0% · 12mo
- Down + closing
- —
- Monthly P&I
- —
- Monthly cashflow
- —
- DSCR
- —
- Eligible?
- —
Short-term bridge; refi at stabilization.
Rent comps 4 comps
| Address | Beds | Baths | Sqft | Rent | $/sqft | DOM | Units | Dist |
|---|---|---|---|---|---|---|---|---|
| 29157 Hayes Rd Warren, MI | 1.0 | 1.0 | 720 | $1,250 | $1.74 | 43d | 1 | 0.12mi |
| 16425 12 Mile Rd Roseville, MI | 1.0 | 1.0 | 600 | $950 | $1.58 | 43d | 1 | 0.85mi |
| 16435 Twelve Mile Rd Roseville, MI | 1.0 | 1.0 | 600 | $950 | $1.58 | 43d | 1 | 0.87mi |
| 28368 Rosemont St Roseville, MI | 2.0 | 1.0 | 696 | $1,500 | $2.16 | 22d | 1 | 1.44mi |
HOA detail condo
- Monthly dues
- $340 · $4,080/yr
- Likely covers
- watergaselectricpool
- Assessments
- None detected in remarks — confirm with the listing agent.
Listing history 29 events
-
2026-06-17statusdays on market $74,900 Active 1 DOM
-
2026-05-18historical
-
2026-04-08price $74,900
-
2026-02-18$79,000 Active
-
2025-03-06historical
-
2025-03-05historical
-
2025-03-05price $85,000
-
2025-03-05price $85,000
-
2025-03-04price $74,900
-
2025-03-03status Active
-
2025-03-03status Active
-
2025-03-03price $74,900
-
2025-01-17historical
-
2025-01-17historical
-
2024-12-12price $79,990
-
2024-12-12price $79,990
-
2024-11-01$85,000 Active
-
2024-11-01$85,000 Active
-
2013-06-13soldstatus $19,000
-
2013-01-29historical
-
2013-01-28$24,900
-
2012-09-20soldstatus $15,000
-
2012-03-28historical
-
2012-03-28historical
-
2012-01-16$12,900
-
2012-01-16$12,900
-
2003-08-13soldstatus $60,000
-
2002-11-26soldstatus $50,000
-
1997-02-03soldstatus $38,000
ⓘ Source: listings_history table (triggers on properties + properties_extension) + one-shot
backfill from property_details.listing_events for pre-trigger history.
Tax reassessment forecast MI · Partial reset (capped growth)
- Current annual tax
- $1,000 · $83/mo
- Projected year-2 tax
- $1,077 · $90/mo
- Expected delta
- +$77/yr (+$6/mo · 7.7%)
ⓘ Screening estimate from a state-policy table — verify with the county assessor before closing.
Climate risk First Street
- Flood 1/10 Low FEMA zone X (unshaded) · 0% chance over 30 yrs
- Wildfire 1/10 Low
- Heat 3/10 Moderate 7 d/yr ≥96°F today · 15 d/yr by 30 yrs out
- Wind 1/10 Low
- Air quality 3/10 Moderate 3 unhealthy d/yr today · 4 by 30 yrs out
Nearby sold comps map
Loading sold comps map…
Walkable amenities ~0.75 mi
Loading nearby amenities…
Taxation est. · year 1
- Rental income
- $14,512
- − Mortgage interest
- −$4,196
- − Property taxes
- −$1,000
- − Insurance
- −$374
- − Repairs & maintenance
- −$1,161
- − Management
- −$1,161
- − HOA
- −$4,080
- − Depreciation
- −$2,179
- Taxable income
- $360
- Est. tax owed @ 24.0%
- −$86
- After-tax cash flow
- $1,209/yr
For passive investors: Depreciation is non-cash, so a rental often shows a tax loss while cash-flowing — sheltering income. Rental losses are passive: they offset passive income freely, and up to $25,000/yr can offset ordinary (W-2) income if you actively participate and your MAGI is under $100k (phasing out to $0 by $150k); unused losses carry forward. On sale, claimed depreciation is recaptured at up to 25%, and gains may owe capital-gains tax (a 1031 exchange can defer both). Figures are a year-1 estimate at your 24.0% rate — not tax advice; consult a CPA.
Schools (NCES district)
- District
- Warren Woods Public Schools
- NCES district ID
- 2635220
- Math proficiency
- 23% ▼ -9.00%
- Reading proficiency
- 40% ▼ -5.00%
- Median HH income
- $49,013
- Composite
- 27.29/100
- National rank
- #7003
- State rank
- #336 of 540 in MI
Livability — Warren
- Score
- 74/100
- State rank
- #171
- US rank
- #4491
Category grades
Schools grade is shown separately in the Schools card above.
Census & demographics
- Census place
- Warren, MI
- City population
- 114,937
- Population (ZIP)
- 23,443
Population outlook (Macomb County) Hauer SSP2
- Today (2025)
- 925,296 people
- By 2030
- 948,226 · +2.5%
- By 2040
- 983,961 · +6.3%
- By 2050
- 1,010,200 · +9.2%
- By 2075
- 1,076,222 · +16.3%
- By 2100
- 1,077,065 · +16.4%
Race, ethnicity, and origin ACS 2023
- Neighborhood character
- Predominantly White (74%)
- Race & ethnicity
- White 74% Black 13% Asian 6% Hispanic / Latino 5% Two or more races 5%
- Common ancestry
- Romanian 14% Lithuanian 4% Slovak 2%
- Foreign-born
- 11% · Canada
- Languages at home
- 84% English-only · Arabic 4% Other Indo-European 3% Spanish 3%
Political lean MEDSL · Macomb
- 2024 margin
- R (+13.7) · D 42.2% · R 55.9% · Other 1.9%
- 2008→2024 swing
- -22.3pp toward R · 2008: 8.6pp · 2024: -13.7pp
- All cycles
- 2024: R+13.7 2020: R+8.1 2016: R+11.6 2012: D+4.0 2008: D+8.6
Not yet ingested
- Civics
- —
Market trends
- HPI YoY
- ▼ -213.65%
- Current HPI
- 206.4018
- Rent YoY
- —
- Metro
- —
- State GDP YoY
- ▲ 1.37%
- F500 in state
- 28
Industry mix (Fortune 500 HQ in MI)
| Industry | F500 HQs | Revenue |
|---|---|---|
| Automotive Parts | 3 | $48B |
|
||
| Automotive | 2 | $372B |
|
||
| Chemicals | 1 | $45B |
|
||
| Automotive Retail | 1 | $29B |
|
||
| Healthcare / Medical Devices | 1 | $23B |
|
||
| Automotive Technology | 1 | $20B |
|
||
Price history
+97.1% since first listed28 events — show timeline
- 2026-05-18 Listing Removed — MiRealSource-MiMLS
- 2026-04-08 Price Changed $74,900 MiRealSource-MiMLS
- 2026-02-18 Listed $79,000 MiRealSource-MiMLS
- 2025-03-06 Listing Removed — REALCOMP
- 2025-03-05 Price Changed $85,000 REALCOMP
- 2025-03-05 Price Changed $85,000 MiRealSource-MiMLS
- 2025-03-05 Listing Removed — MiRealSource-MiMLS
- 2025-03-04 Price Changed $74,900 MiRealSource-MiMLS
- 2025-03-03 Relisted — MiRealSource-MiMLS
- 2025-03-03 Relisted — REALCOMP
- 2025-03-03 Price Changed $74,900 REALCOMP
- 2025-01-17 Listing Removed — REALCOMP
- 2025-01-17 Listing Removed — MiRealSource-MiMLS
- 2024-12-12 Price Changed $79,990 MiRealSource-MiMLS
- 2024-12-12 Price Changed $79,990 REALCOMP
- 2024-11-01 Listed $85,000 REALCOMP
- 2024-11-01 Listed $85,000 MiRealSource-MiMLS
- 2013-06-13 Sold (Public Records) $19,000 Public Records
- 2013-01-29 Listing Removed — REALCOMP
- 2013-01-28 Listed $24,900 REALCOMP
- 2012-09-20 Sold (Public Records) $15,000 Public Records
- 2012-03-28 Listing Removed — REALCOMP
- 2012-03-28 Listing Removed — MiRealSource-MiMLS
- 2012-01-16 Listed $12,900 REALCOMP
- 2012-01-16 Listed $12,900 MiRealSource-MiMLS
- 2003-08-13 Sold (Public Records) $60,000 Public Records
- 2002-11-26 Sold (Public Records) $50,000 Public Records
- 1997-02-03 Sold (Public Records) $38,000 Public Records
Property tax history
+2.6%/yrLatest (2025): $1,000 · +2.6% YoY. Source: county tax records.
Cash-flow waterfall
monthlySold comps — $/sqft
last 12 mo · ≤1 miLoading sold comps…