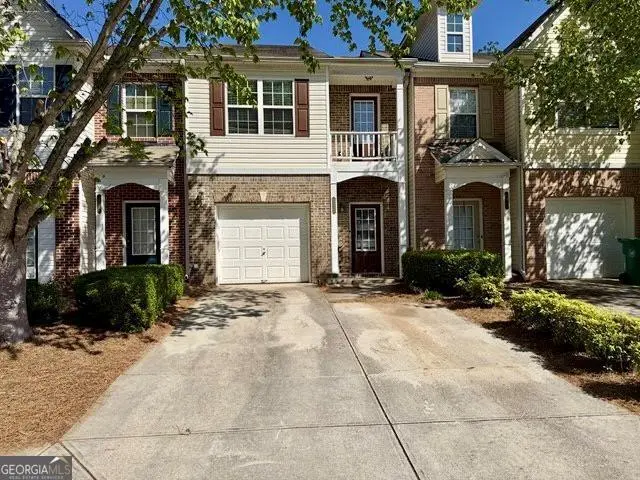
2915 Snapfinger Mnr · Stonecrest, GA
Flood risk 1/10 · Minimal
- FEMA flood zone
- X (unshaded)
- Chance of flooding over 30 yrs
- 0.0%
- Est. flood insurance / yr
- $507 – $1,088
Fire risk 1/10 · Minimal
- Est. fire insurance / yr
- $963 – $1,789
Heat risk 6/10 · Moderate
- Hot days now (above 105°F)
- 7 days/yr
- Hot days in 30 yrs
- 19 days/yr
Wind risk 5/10 · Moderate
- Chance of severe wind over 30 yrs
- 26.0%
Air-quality risk 5/10 · Moderate
- Unhealthy air days now
- 7 days/yr
- Unhealthy air days in 30 yrs
- 10 days/yr
Risk factors via First Street. Map © Google.
Why this score? — see what drove the C+ grade
The composite is a weighted blend of 9 inputs, each scored 0–100. Each bar is that input's sub-score; the figure is the points it added to the 100-point composite (weight × sub-score).
- Cash flow +26.1/30.0
- ARV discount +11.6/15.0
- DSCR +8.8/10.0
- 1% rule +7.6/10.0
- Rent growth +2.7/5.0
- Livability +2.5/5.0
- Condition / age +2.5/5.0
- Schools +2.1/10.0
- Appreciation +0.0/10.0
$169,900
🖨 Deal sheet 📄 Offer letter ✓ Due diligence
Listing remarks
Spacious 3-bedroom, 2- and 1/2bath townhome located in a gated community offering added security and a well-maintained neighborhood setting. Enjoy a generously sized kitchen with a pantry, plus an open-concept family room with plenty of space for relaxing or entertaining. The primary bedroom features a vaulted ceiling and a nice-sized closet for added comfort and storage. Designated parking spaces are conveniently located right outside your door. Residents also enjoy access to a charming gazebo area that may be reserved for gatherings, while the community handles exterior maintenance for easy, low-maintenance living. Conveniently located with quick access to I-285, I-20, shopping, dining, a
Key facts
- Gated community
- Charming gazebo area
- $240 HOA
Tags
Property features AI
Finance
- HOA & community: Homeowners association with annual fee; Association fee covers structure and grounds maintenance
Exterior
- Parking: Garage (1 parking space)
- Utilities: Public water; Public sewer; Electricity available; Cable available
- Home design: Townhouse (residential); Two levels; Resale property
- Construction: Built in 2004; Vinyl siding; Composition roof
- Exterior features: No notable lot features; Sidewalks; Street lights
Interior
- Kitchen: Dishwasher; Refrigerator
- Bedrooms: 3 bedrooms
- Flooring: Carpet; Laminate; Tile
- Bathrooms: 2 full bathrooms; 1 half bathroom (2.5 total)
- Heating & cooling: Forced air heating; Central air conditioning; Ceiling fans
- Interior features: Separate shower; Soaking tub; Fireplace (1)
- Laundry & utility: Laundry closet
Neighborhood map
What this means for you Summary
Snapshot
- This is a 3-bed/2.5-bath condo listed at $170k.
Deal economics
- At list price, monthly cash flow is $430 ($5k/yr) — positive.
- The deal already cash-flows at list — no discount required.
- Meets the 1% rule at list price ($2k rent vs $170k).
- Recommended offer: $165k (3.0% below list) — sets the bar for market timing.
- Cap rate 9.3% vs local median 5.1% in Stonecrest — top-decile yield for the area; either an underpriced asset or a hidden risk that comps aren't pricing in. Stress-test before assuming the spread holds.
Location & tenants
- Location reads: area grade C — affects rentability + tenant quality, not the cash-flow math above.
- Dekalb County (suburban): math 19% / reading 28% proficiency, ranked #125 of 174 in GA (top 72%) — low school quality limits family demand, transient renter base, plan for 1-2y turnover; 68% free/reduced lunch — lower-income household profile, screen leases tightly.
- Zoned schools: Fairington Elementary School (math 2% / reading 2%, grade F, #1,204 of 1,228 statewide, top 100%, 546 students, 100% FRL); Miller Grove Middle School (math 8% / reading 18%, grade F, #410 of 470 statewide, top 87%, 722 students, 100% FRL); Miller Grove High School (math 5% / reading 5%, grade F, #394 of 424 statewide, top 97%, 1,188 students, 100% FRL) — zoned schools average 100% FRL vs 68% district-wide (32 pts higher); higher-poverty schools than district average — tighter screening recommended.
- Zoned-school proficiency averages 7% at this address vs 24% district-wide (-17 pts) — the specific schools serving this property underperform the Dekalb County average; the district grade overstates school quality for this exact location.
- Market conditions: Rents flat; 180 active listings in the ZIP; 35 comparable units currently listed for rent nearby; rentals at typical pace (median 25d on market — plan ~3-4 weeks tenant-placement turnaround); 49% of comp listings sitting > 30 days — soft ceiling on asking rent; 1,240 units permitted in DeKalb County in 2024 (385 in 5+ unit buildings).
- This rent runs 39% of the median local income ($67k/yr) — at the standard rent-burdened threshold; future hikes will face affordability resistance.
Forward outlook
- Local home prices are declining (-3.0%/yr); year-one equity from $1k of loan paydown is wiped out by about $5k of value loss. Plan a longer hold.
- DeKalb County population projected at +28% by 2050 — long-run rental-demand tailwind backs the buy-and-hold thesis.
Negotiation context
- It's been on market 50 days — a 3% lower offer ($165k) is reasonable based on typical stale-listing flexibility.
Risks & watch-outs
- Climate carrying-cost: moderate wind risk, 26% chance of damaging wind over 30y; extreme-heat days projected 7→19/yr by 2055 (HVAC capex compounding) — expect insurance premiums to compound above CPI over the hold.
Questions for the listing agent
- It's been on market 50 days. Have you received any prior offers? Is the seller open to a 3% concession, seller financing, or rate buy-down credit?
- What does the HOA fee cover, when was the last increase, and are there any pending special assessments or reserve-fund shortfalls?
- Any open or pending special assessments — roof, HVAC, plumbing, elevator, façade? What's the per-unit balance and payoff schedule, and is the seller paying it off at close or rolling it to the buyer?
- Is there a deadline driving the sale (1031 exchange, divorce, estate, relocation)? That informs how much negotiation room exists.
- What's the average days-on-market for RENTAL listings here right now (not sales)? A rising rental-DOM trend means longer vacancies and softer asking-rent achievability than the comps imply.
- What's the recent tenant-quality profile in this submarket — average credit score on applications, eviction rate, late-payment / NSF rate, and stable-employment percentage? A property-management company in the area should have these aggregated.
- How much new apartment / multifamily construction is in the pipeline within 1–3 miles? Heavy new supply (>2% of stock underway) typically softens rents 12–24 months out; light construction supports rent growth.
Investment metrics
- 1% rule
- 1.26% ✓
- Cap rate
- 9.33%
- Cash-on-cash
- 10.84%
- DSCR
- 1.48
- GRM
- 6.6
CMA / ARV
- ARV (median comp)
- $186,897
- List price
- $169,900
- Delta
- -9.09%
- Verdict
- FAIR
- Comps
- 20 within 1.0 mi
Projected returns pro-forma
-3.0% appreciation · 0.87% rent growth · sell at horizon
- IRR
- -2.6%
- Equity multiple
- 0.90×
- Total profit
- $-4,584
- Equity at exit
- $25,333
- IRR
- 4.4%
- Equity multiple
- 1.29×
- Total profit
- $13,881
- Equity at exit
- $14,690
Cash invested: $47,572 (down + closing). Projections, not guarantees.
Landlord ↔ Tenant lean methodology
- Overall (STATE)
- 90 Strongly Landlord-Friendly
- State Georgia
- 90 Strongly Landlord-Friendly · R+3
- County
- — inherits STATE
- City
- — inherits STATE
ZIP-level market 30035
- Home prices YoY
- -33.8%
- Rents YoY
- 0.9%
- Active inventory
- 180
- Price-to-rent
- 6.6×
Monthly cashflow live
- Estimated rent
- $2,149 high interval (Pro) →
- Mortgage (P&I)
- −$891
- Tax from tax record
- −$66 /mo · $796/yr
- Insurance
- −$71
- HOA
- −$240
- Vacancy / Maint / Mgmt
- −$451
- Net cashflow
- $430
Break-even live
UW: 25.0% down · 7.5% · 30yr · 1.5% tax · 5.0% vac · 8.0% maint · 8.0% mgmt
Financing live
Cash to close
- Down payment
- $42,475
- Closing costs
- $5,097
- Reserves months
- —
- Total cash needed
- —
Loan-product check · same deal, 3 products live
Conventional
25% down · 7.5% · 30yr
- Down + closing
- —
- Monthly P&I
- —
- Monthly cashflow
- —
- DSCR
- —
- Eligible?
- —
Personal DTI + credit; lowest rate.
DSCR
20% down · 8.5% · 30yr
- Down + closing
- —
- Monthly P&I
- —
- Monthly cashflow
- —
- DSCR
- —
- Eligible?
- —
No personal income docs; deal must DSCR.
Hard money
10% down · 12.0% · 12mo
- Down + closing
- —
- Monthly P&I
- —
- Monthly cashflow
- —
- DSCR
- —
- Eligible?
- —
Short-term bridge; refi at stabilization.
Rent comps 35 comps
| Address | Beds | Baths | Sqft | Rent | $/sqft | DOM | Units | Dist |
|---|---|---|---|---|---|---|---|---|
| 2878 Snapfinger Mnr Decatur, GA | 3.0 | 2.5 | 1670 | $1,780 | $1.07 | 3d | 1 | 0.11mi |
| 2559 Walden Lake Dr Unit 1 Decatur, GA | 3.0 | 2.5 | 1464 | $2,000 | $1.37 | 44d | 1 | 0.18mi |
| 2545 Walden Lake Dr Unit 1 Decatur, GA | 3.0 | 2.5 | 1464 | $2,000 | $1.37 | 44d | 1 | 0.21mi |
| 4936 Longview Run Decatur, GA | 4.0 | 2.5 | 2238 | $2,900 | $1.30 | 44d | 1 | 0.31mi |
| 4948 Longview Run Decatur, GA | 3.0 | 2.0 | 1892 | $2,135 | $1.13 | 5d | 1 | 0.33mi |
| 5038 Longview Walk Decatur, GA | 3.0 | 2.5 | 1577 | $1,995 | $1.27 | 44d | 1 | 0.35mi |
| 4917 Longview Walk Decatur, GA | 3.0 | 2.5 | 1486 | $2,000 | $1.35 | 21d | 1 | 0.37mi |
| 4908 Longview Walk Decatur, GA | 3.0 | 2.5 | 1480 | $2,000 | $1.35 | 44d | 1 | 0.38mi |
| 5108 Jack Dr Decatur, GA | 3.0 | 2.5 | 1872 | $2,185 | $1.17 | 24d | 1 | 0.41mi |
| 2569 Terrace Trl Decatur, GA | 3.0 | 3.0 | 1752 | $1,800 | $1.03 | 44d | 1 | 0.41mi |
| 2658 Avanti Way Decatur, GA | 3.0 | 2.5 | 1616 | $2,000 | $1.24 | 44d | 1 | 0.42mi |
| 2563 Terrace Trl Decatur, GA | 3.0 | 3.0 | 1752 | $1,950 | $1.11 | 13d | 1 | 0.43mi |
| 2553 Terrace Trl Unit 2553 Decatur, GA | 3.0 | 2.0 | 1865 | $1,950 | $1.05 | 13d | 1 | 0.45mi |
| 2525 Terrace Trl Unit 2525 Decatur, GA | 3.0 | 3.0 | 1593 | $1,850 | $1.16 | 13d | 1 | 0.47mi |
| 2564 Treadway Dr Decatur, GA | 3.0 | 2.0 | 1927 | $2,950 | $1.53 | 44d | 1 | 0.51mi |
| 2481 Terrace Trl Decatur, GA | 3.0 | 3.0 | 1752 | $2,050 | $1.17 | 44d | 1 | 0.58mi |
| 4946 Snapfinger Woods Dr Decatur, GA | 1.0–2.0 | 1.0–2.5 | 965 | $1,259 | $1.30 | 1d | 18 | 0.62mi |
| 2937 Thompson Cir Decatur, GA | 3.0 | 2.0 | 1480 | $1,860 | $1.26 | 2d | 1 | 0.71mi |
| 4955 Windsor Downs Ln Decatur, GA | 4.0 | 2.0 | 1888 | $2,050 | $1.09 | 5d | 1 | 0.77mi |
| 2450 Northmill Ln Decatur, GA | 4.0 | 2.5 | 2046 | $2,135 | $1.04 | 44d | 1 | 0.85mi |
| 4909 Truitt Ln Decatur, GA | 3.0 | 2.0 | 1697 | $2,500 | $1.47 | 44d | 1 | 0.86mi |
| 3095 Riders Trl Decatur, GA | 3.0 | 2.0 | 1800 | $4,500 | $2.50 | 1d | 1 | 0.89mi |
| 4919 Wilkins Station Dr Decatur, GA | 3.0 | 2.0 | 1770 | $2,161 | $1.22 | 21d | 1 | 0.93mi |
| 4433 Golf Vista Cir Decatur, GA | 3.0 | 2.5 | 1495 | $1,350 | $0.90 | 24d | 1 | 0.94mi |
| 2272 Ramblewood Cir Decatur, GA | 4.0 | 2.5 | 2198 | $2,111 | $0.96 | 5d | 1 | 1.08mi |
| 4336 Pleasant Point Dr Decatur, GA | 1.0–3.0 | 1.0–2.0 | 1010 | $1,235 | $1.22 | 2d | 4 | 1.10mi |
| 5049 Donnell Way Decatur, GA | 3.0 | 2.0 | 1566 | $1,923 | $1.23 | 44d | 1 | 1.11mi |
| 2314 Hampton Dr Decatur, GA | 3.0 | 3.0 | 1600 | $2,030 | $1.27 | 44d | 1 | 1.12mi |
| 5047 Chadwick Ct Decatur, GA | 3.0 | 2.5 | 1488 | $1,645 | $1.11 | 3d | 1 | 1.16mi |
| 2692 Paxton PL #14 Decatur, GA | 3.0 | 2.5 | 1611 | $2,299 | $1.43 | 44d | 1 | 1.17mi |
| 4292 Callum Ct Decatur, GA | 3.0 | 2.5 | 1611 | $2,200 | $1.37 | 44d | 1 | 1.22mi |
| 4282 Callum Ct Decatur, GA | 3.0 | 2.5 | 1611 | $2,200 | $1.37 | 44d | 1 | 1.24mi |
| 100 Cavalier Xing Stonecrest, GA | 3.0 | 2.0 | 1558 | $1,990 | $1.28 | 24d | 1 | 1.28mi |
| 5301 W Fairington Pkwy Lithonia, GA | 1.0–3.0 | 1.0–2.0 | 1020 | $1,946 | $1.91 | 2d | 37 | 1.48mi |
| 4505 Dover Castle Dr Decatur, GA | 4.0 | 2.0 | 1532 | $1,923 | $1.26 | 44d | 1 | 1.48mi |
HOA detail condo
- Monthly dues
- $240 · $2,880/yr
- Likely covers
- exterior maint.security
- Assessments
- None detected in remarks — confirm with the listing agent.
Listing history 14 events
-
2026-06-18days on market $169,900 Active 50 DOM
-
2026-06-17days on market $169,900 Active 49 DOM
-
2026-06-16days on market $169,900 Active 48 DOM
-
2026-06-15days on market $169,900 Active 47 DOM
-
2026-06-13days on market $169,900 Active 45 DOM
-
2026-06-09days on market $169,900 Active 41 DOM
-
2026-06-08days on market $169,900 Active 40 DOM
-
2026-06-07statusdays on market $169,900 Active 39 DOM
-
2026-06-04days on market $169,900 Price Change 36 DOM
-
2026-06-03days on market $169,900 Price Change 35 DOM
-
2026-06-02pricestatusdays on market $169,900 Price Change 34 DOM
-
2026-06-01days on market $199,900 Active 33 DOM
-
2026-05-31days on market $199,900 Active 32 DOM
-
2026-04-29$199,900 New 900-char remark
ⓘ Source: listings_history table (triggers on properties + properties_extension) + one-shot
backfill from property_details.listing_events for pre-trigger history.
Tax reassessment forecast GA · Resets to sale price
- Current annual tax
- $796 · $66/mo
- Projected year-2 tax
- $1,563 · $130/mo
- Expected delta
- +$767/yr (+$64/mo · 96.4%)
ⓘ Screening estimate from a state-policy table — verify with the county assessor before closing.
Climate risk First Street
- Flood 1/10 Low FEMA zone X (unshaded) · 0% chance over 30 yrs
- Wildfire 1/10 Low
- Heat 6/10 Major 7 d/yr ≥105°F today · 19 d/yr by 30 yrs out
- Wind 5/10 Major 26% chance of damaging wind over 30 yrs
- Air quality 5/10 Major 7 unhealthy d/yr today · 10 by 30 yrs out
Nearby sold comps map
Loading sold comps map…
Walkable amenities ~0.75 mi
Loading nearby amenities…
Taxation est. · year 1
- Rental income
- $25,789
- − Mortgage interest
- −$9,517
- − Property taxes
- −$796
- − Insurance
- −$850
- − Repairs & maintenance
- −$2,063
- − Management
- −$2,063
- − HOA
- −$2,880
- − Depreciation
- −$4,943
- Taxable income
- $2,678
- Est. tax owed @ 24.0%
- −$643
- After-tax cash flow
- $4,514/yr
For passive investors: Depreciation is non-cash, so a rental often shows a tax loss while cash-flowing — sheltering income. Rental losses are passive: they offset passive income freely, and up to $25,000/yr can offset ordinary (W-2) income if you actively participate and your MAGI is under $100k (phasing out to $0 by $150k); unused losses carry forward. On sale, claimed depreciation is recaptured at up to 25%, and gains may owe capital-gains tax (a 1031 exchange can defer both). Figures are a year-1 estimate at your 24.0% rate — not tax advice; consult a CPA.
Schools (NCES district)
- District
- Dekalb County
- NCES district ID
- 1301740
- Math proficiency
- 19% ▼ -12.00%
- Reading proficiency
- 28% ▼ -7.00%
- Median HH income
- $51,448
- Composite
- 20.92/100
- National rank
- #8482
- State rank
- #125 of 174 in GA
Livability — Stonecrest
No livability data for this city. (Only ~50 U.S. cities are tracked.)
Census & demographics
- County
- Dekalb County · 782,738 people
- City population
- 106,165
- Metro
- Atlanta-Sandy Springs-Alpharetta, GA
- Population (ZIP)
- 21,569
- Household income
- $66,799
- Rent vs Own
- Severe rent burden
- 1304.0
Population outlook (DeKalb County) Hauer SSP2
- Today (2025)
- 839,977 people
- By 2030
- 891,768 · +6.2%
- By 2040
- 988,894 · +17.7%
- By 2050
- 1,074,583 · +27.9%
- By 2075
- 1,245,026 · +48.2%
- By 2100
- 1,303,135 · +55.1%
Race, ethnicity, and origin ACS 2023
- Neighborhood character
- Predominantly Black (91%)
- Race & ethnicity
- Black 91% White 4% Hispanic / Latino 4% Two or more races 3%
- Common ancestry
- Italian 1% Swiss 0%
- Foreign-born
- 12% · Canada, Jamaica
- Languages at home
- 86% English-only · Spanish 4% French/Haitian/Cajun 2%
Political lean MEDSL · DeKalb
- 2024 margin
- Solid D (+64.8) · D 81.9% · R 17.1% · Other 1.0%
- 2008→2024 swing
- +6.1pp toward D · 2008: 58.6pp · 2024: 64.8pp
- All cycles
- 2024: D+64.8 2020: D+67.4 2016: D+64.8 2012: D+56.8 2008: D+58.6
Not yet ingested
- Civics
- —
Market trends
- HPI YoY
- ▼ -111.60%
- Current HPI
- 218.8323
- Rent YoY
- ▲ 0.87%
- Metro
- Atlanta-Sandy Springs-Alpharetta, GA
- State GDP YoY
- ▲ 2.66%
- F500 in state
- 28
Industry mix (Fortune 500 HQ in GA)
| Industry | F500 HQs | Revenue |
|---|---|---|
| Paper / Packaging | 2 | $29B |
|
||
| Retail | 1 | $160B |
|
||
| Transportation / Logistics | 1 | $91B |
|
||
| Airlines | 1 | $62B |
|
||
| Consumer Goods | 1 | $47B |
|
||
| Utilities | 1 | $25B |
|
||
Price history
-15.0% since first listed2 events — show timeline
- 2026-06-02 Price Changed $169,900 GAMLS
- 2026-04-29 Listed $199,900 GAMLS
Property tax history
-2.0%/yrLatest (2025): $796 · -6.2% YoY. Source: county tax records.
Cash-flow waterfall
monthlySold comps — $/sqft
last 12 mo · ≤1 miLoading sold comps…