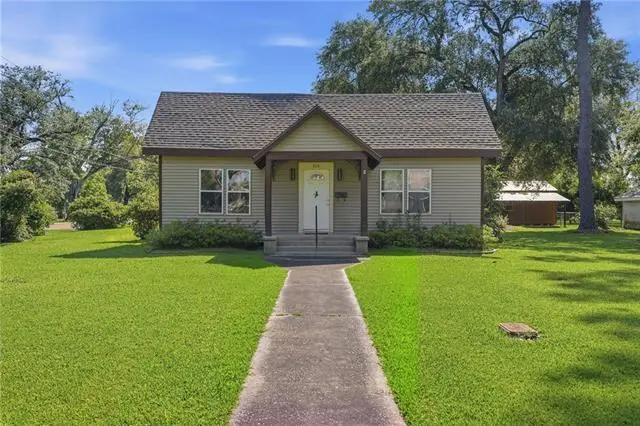
204 S Second St · Ponchatoula, LA
Flood risk 1/10 · Minimal
- FEMA flood zone
- X (unshaded)
- Chance of flooding over 30 yrs
- 0.0%
- Est. flood insurance / yr
- $507 – $1,088
Fire risk 3/10 · Minor
- Est. fire insurance / yr
- $1,269 – $2,357
Heat risk 9/10 · Severe
- Hot days now (above 109°F)
- 7 days/yr
- Hot days in 30 yrs
- 22 days/yr
Wind risk 9/10 · Severe
- Chance of severe wind over 30 yrs
- 99.0%
Air-quality risk 2/10 · Minimal
- Unhealthy air days now
- 0 days/yr
- Unhealthy air days in 30 yrs
- 1 days/yr
Risk factors via First Street. Map © Google.
Why this score? — see what drove the C- grade
The composite is a weighted blend of 9 inputs, each scored 0–100. Each bar is that input's sub-score; the figure is the points it added to the 100-point composite (weight × sub-score).
- Cash flow +17.1/30.0
- ARV discount +15.0/15.0
- DSCR +5.3/10.0
- 1% rule +3.4/10.0
- Livability +3.4/5.0
- Rent growth +2.7/5.0
- Condition / age +2.5/5.0
- Schools +2.0/10.0
- Appreciation +0.0/10.0
$225,000
🖨 Deal sheet (PDF) 📄 Offer letter ✓ Due diligence
Listing remarks MLS
MOTIVATED SELLER. Older home with large rooms and plenty of closet space. Hardwood, ceramic, and vinyl floors with lots of potential. Located on a corner lot and situated on two city lots (100 X 200. Newer, nice large storage shed/work shop. Great location, quiet neighborhood, near school and about 4 blocks to downtown area. Central A/C recently checked and working. Heater does not work. Will need some updating, priced accordingly.
Key facts
- Large rooms
- Quiet neighborhood
- Two city lots
Tags
Property features AI
Exterior
- Parking: Carport with two spaces; Boat parking; RV access/parking
- Utilities: Public water; Public sewer
- Home design: Single-story house; Property has had additions and some remodeling since built
- Construction: Brick veneer, frame, and vinyl siding exterior; Asphalt shingle roof; Raised and slab foundation; Average condition
- Exterior features: Covered patio/porch; Shed(s); Workshop; Corner lot; City lot; Rectangular lot; Lot dimensions approximately 100 x 200
Interior
- Kitchen: Cooktop; Oven; Range; Dishwasher; Refrigerator
- Bedrooms: Total rooms: 8
- Bathrooms: 2 full bathrooms; 1 half bathroom
- Heating & cooling: Central heating (gas); Central air conditioning
- Interior features: Ceiling fans; Pantry; Wood-burning fireplace
- Laundry & utility: Washer hookup; Dryer hookup
Neighborhood map
What this means for you Summary
Snapshot
- This is a 3-bed/2.5-bath single-family listed at $225k.
Deal economics
- At list price, monthly cash flow is $155 ($2k/yr) — positive.
- The deal already cash-flows at list — no discount required.
- To meet the 1% rule (rent ≥ 1% of price), the offer needs to be $190k (15.8% below list).
- Recommended offer: $190k (15.8% below list) — sets the bar for 1% rule.
- Cap rate 7.1% vs local median 5.2% in Ponchatoula — top-decile yield for the area; either an underpriced asset or a hidden risk that comps aren't pricing in. Stress-test before assuming the spread holds.
Location & tenants
- Location reads 68/100 on livability (#91 in LA) — a middle-class / working-renter tenant base. Strengths: cost of living A+, health & safety A+, housing A-; Watch: employment D, crime D-, amenities F.
- Tangipahoa Parish (rural): math 18% / reading 29% proficiency, ranked #63 of 98 in LA (top 64%) — low school quality limits family demand, transient renter base, plan for 1-2y turnover; 73% free/reduced lunch — lower-income household profile, screen leases tightly.
- Zoned schools: Tucker Memorial Elementary School (709 students, 67% FRL); Ponchatoula Junior High School (math 18% / reading 37%, grade F, #127 of 218 statewide, top 60%, 770 students, 60% FRL); Ponchatoula High School (math 29% / reading 40%, grade F, #106 of 265 statewide, top 43%, 2,262 students, 51% FRL).
- Market conditions: Rents flat; 527 active listings in the ZIP; 1 comparable units currently listed for rent nearby; 1,085 units permitted in Tangipahoa Parish in 2024 (378 in 5+ unit buildings).
- This rent runs 32% of the median local income ($72k/yr) — at the standard rent-burdened threshold; future hikes will face affordability resistance.
Forward outlook
- Local home prices are declining (-3.0%/yr); year-one equity from $2k of loan paydown is wiped out by about $7k of value loss. Plan a longer hold.
- Tangipahoa County population projected at +22% by 2050 — long-run rental-demand tailwind backs the buy-and-hold thesis.
Negotiation context
- It's been on market 28 days — a 2% lower offer ($222k) is reasonable based on typical stale-listing flexibility.
- 4 sale attempts with the ask held roughly flat each time — persistent listings suggest the price (not the market) is what's stuck; bring a comps-based counter.
- Current owner paid $72k; list at $225k implies a 212% gain — meaningful room to come down on a strong offer.
Risks & watch-outs
- Watch-outs: built in 1949 — expect roof / HVAC / electrical / plumbing capex.
- Climate carrying-cost: severe wind risk, 99% chance of damaging wind over 30y; extreme-heat days projected 7→22/yr by 2055 (HVAC capex compounding) — expect insurance premiums to compound above CPI over the hold.
Questions for the listing agent
- Built in 1949 — when were the roof, HVAC, electrical panel, plumbing, and water heater last replaced?
- Is there a deadline driving the sale (1031 exchange, divorce, estate, relocation)? That informs how much negotiation room exists.
- Schools are B-rated — typically a magnet for longer-tenancy family renters. What's the average tenant stay here, and is there a school-zone premium baked into asking?
- Crime grade is D in this area — have there been break-ins, vandalism, or insurance claims at this property in the last 3 years? What carrier currently insures it and at what premium?
- What's the average days-on-market for RENTAL listings here right now (not sales)? A rising rental-DOM trend means longer vacancies and softer asking-rent achievability than the comps imply.
- What's the recent tenant-quality profile in this submarket — average credit score on applications, eviction rate, late-payment / NSF rate, and stable-employment percentage? A property-management company in the area should have these aggregated.
- How much new for-sale + rental construction is in the pipeline within 1–3 miles? Heavy new supply typically softens prices + rents 12–24 months out; constrained supply supports both.
Investment metrics
- 1% rule
- 0.84% ✗
- Cap rate
- 7.12%
- Cash-on-cash
- 2.95%
- DSCR
- 1.13
- GRM
- 9.9
CMA / ARV
- ARV (on-the-fly)
- $380,162
- Comps found
- 7
Show comp detail 7 sales within ~0.75 mi
| Address | Dist | Beds/Ba | Sqft | Sold | Price | $/sf | Match |
|---|---|---|---|---|---|---|---|
| 119 Colver Dr | 0.28mi | 3/2.5 | 2,740 (-6%) | 1mo | $320,000 | $117 | 77 |
| 25282 Kingfisher Dr | 0.44mi | 4/2.5 (+1) | 2,782 (-4%) | 10mo | $365,275 | $131 | 59 |
| 42311 Blue Bay Dr | 0.44mi | 4/2.0 (+1) | 2,750 (-5%) | 24mo | $336,795 | $122 | 44 |
| 215 N 6th St | 0.60mi | 3/2.0 | 2,493 (-14%) | 9mo | $495,000 | $199 | 39 |
| 301 N 7th St | 0.71mi | 3/2.5 | 2,477 (-15%) | 4mo | $418,700 | $169 | 39 |
| 333 N 7th St | 0.74mi | 2/2.0 (-1) | 2,802 (-3%) | 17mo | $455,000 | $162 | 38 |
| 150 Camarosa Dr | 0.71mi | 4/2.5 (+1) | 2,800 (-4%) | 23mo | $336,000 | $120 | 36 |
Match score weights: distance 35% · size 25% · config 20% · recency 20%. Top-matched comps best support the ARV.
Projected returns pro-forma
-3.0% appreciation · 0.66% rent growth · sell at horizon
- IRR
- -14.0%
- Equity multiple
- 0.51×
- Total profit
- $-31,069
- Equity at exit
- $33,548
- IRR
- -9.0%
- Equity multiple
- 0.49×
- Total profit
- $-31,853
- Equity at exit
- $19,454
Cash invested: $63,000 (down + closing). Projections, not guarantees.
Landlord ↔ Tenant lean methodology
- Overall (STATE)
- 90 Strongly Landlord-Friendly
- State Louisiana
- 90 Strongly Landlord-Friendly · R+12
- County
- — inherits STATE
- City
- — inherits STATE
ZIP-level market 70454
- Rents YoY
- 0.7%
- Active inventory
- 527
- Price-to-rent
- 9.9×
Monthly cashflow live
- Estimated rent
- $1,895 medium interval (Pro) →
- Mortgage (P&I)
- −$1,180
- Tax from tax record
- −$69 /mo · $825/yr
- Insurance
- −$94
- HOA
- −$0
- Vacancy / Maint / Mgmt
- −$398
- Net cashflow
- $155
Break-even live
Sensitivity live
| Price | -10% $282 | -5% $218 | +0% $155 | +5% $91 | +10% $27 |
|---|---|---|---|---|---|
| Rent | -10% $5 | -5% $80 | +0% $155 | +5% $230 | +10% $304 |
| Rate | -1.0pp $268 | -0.5pp $212 | base $155 | +0.5pp $96 | +1.0pp $37 |
UW: 25.0% down · 7.5% · 30yr · 1.5% tax · 5.0% vac · 8.0% maint · 8.0% mgmt
Financing live
Cash to close
- Down payment
- $56,250
- Closing costs
- $6,750
- Reserves months
- —
- Total cash needed
- —
Loan-product check · same deal, 3 products live
Conventional
25% down · 7.5% · 30yr
- Down + closing
- —
- Monthly P&I
- —
- Monthly cashflow
- —
- DSCR
- —
- Eligible?
- —
Personal DTI + credit; lowest rate.
DSCR
20% down · 8.5% · 30yr
- Down + closing
- —
- Monthly P&I
- —
- Monthly cashflow
- —
- DSCR
- —
- Eligible?
- —
No personal income docs; deal must DSCR.
Hard money
10% down · 12.0% · 12mo
- Down + closing
- —
- Monthly P&I
- —
- Monthly cashflow
- —
- DSCR
- —
- Eligible?
- —
Short-term bridge; refi at stabilization.
Rent comps 1 comps
| Address | Beds | Baths | Sqft | Rent | $/sqft | DOM | Units | Dist |
|---|---|---|---|---|---|---|---|---|
| 18158-0 Logan Ct Ponchatoula, LA | 4.0 | 2.0 | 2079 | $2,000 | $0.96 | 16d | 1 | 1.32mi |
Listing history 18 events
-
2026-06-21days on market $225,000 Active 28 DOM
-
2026-06-19days on market $225,000 Active 26 DOM
-
2026-06-18days on market $225,000 Active 25 DOM
-
2026-06-17days on market $225,000 Active 24 DOM
-
2026-06-16days on market $225,000 Active 23 DOM
-
2026-06-15days on market $225,000 Active 22 DOM
-
2026-06-14days on market $225,000 Active 20 DOM
-
2026-06-13remarks 436-char remark
-
2026-06-13statusdays on market $225,000 Active 19 DOM
-
2026-06-05statusdays on market $225,000 Pending 17 DOM
-
2026-06-03days on market $225,000 Active 16 DOM
-
2026-06-02days on market $225,000 Active 15 DOM
-
2026-06-01days on market $225,000 Active 14 DOM
-
2026-05-31days on market $225,000 Active 13 DOM
-
2026-05-30days on market $225,000 Active 12 DOM
-
2026-05-18$225,000 Active
Show marketing remark (435 chars)
MOTIVATED SELLER. Older home with large rooms and plenty of closet space. Hardwood, ceramic, and vinyl floors with lots of potential. Located on a corner lot and situated on two city lots (100 X 200. Newer, nice large storage shed/work shop. Great location, quiet neighborhood, near school and about 4 blocks to downtown area. Central A/C recently checked and working. Heater does not work. Will need some updating, priced accordingly.
-
2026-05-18$225,000 Active 417-char remark
Show marketing remark (435 chars)
MOTIVATED SELLER. Older home with large rooms and plenty of closet space. Hardwood, ceramic, and vinyl floors with lots of potential. Located on a corner lot and situated on two city lots (100 X 200. Newer, nice large storage shed/work shop. Great location, quiet neighborhood, near school and about 4 blocks to downtown area. Central A/C recently checked and working. Heater does not work. Will need some updating, priced accordingly.
-
1993-11-15soldstatus $72,000
ⓘ Source: listings_history table (triggers on properties + properties_extension) + one-shot
backfill from property_details.listing_events for pre-trigger history.
Tax reassessment forecast LA · Resets to sale price
- Current annual tax
- $825 · $69/mo
- Projected year-2 tax
- $1,238 · $103/mo
- Expected delta
- +$413/yr (+$34/mo · 50.0%)
ⓘ Screening estimate from a state-policy table — verify with the county assessor before closing.
Climate risk First Street
- Flood 1/10 Low FEMA zone X (unshaded) · 0% chance over 30 yrs
- Wildfire 3/10 Moderate
- Heat 9/10 Extreme 7 d/yr ≥109°F today · 22 d/yr by 30 yrs out
- Wind 9/10 Extreme 99% chance of damaging wind over 30 yrs
- Air quality 2/10 Low 0 unhealthy d/yr today · 1 by 30 yrs out
Nearby sold comps map
Loading sold comps map…
Walkable amenities ~0.75 mi
Loading nearby amenities…
Taxation est. · year 1
- Rental income
- $22,741
- − Mortgage interest
- −$12,603
- − Property taxes
- −$825
- − Insurance
- −$1,125
- − Repairs & maintenance
- −$1,819
- − Management
- −$1,819
- − Depreciation
- −$6,545
- Taxable loss
- −$1,996
- Est. tax savings @ 24.0%
- +$479
- After-tax cash flow
- $2,336/yr
For passive investors: Depreciation is non-cash, so a rental often shows a tax loss while cash-flowing — sheltering income. Rental losses are passive: they offset passive income freely, and up to $25,000/yr can offset ordinary (W-2) income if you actively participate and your MAGI is under $100k (phasing out to $0 by $150k); unused losses carry forward. On sale, claimed depreciation is recaptured at up to 25%, and gains may owe capital-gains tax (a 1031 exchange can defer both). Figures are a year-1 estimate at your 24.0% rate — not tax advice; consult a CPA.
Schools (NCES district)
- District
- Tangipahoa Parish
- NCES district ID
- 2201680
- Math proficiency
- 18% ▼ -32.00%
- Reading proficiency
- 29% ▼ -31.00%
- Median HH income
- $41,283
- Composite
- 19.94/100
- National rank
- #8676
- State rank
- #63 of 98 in LA
Livability — Ponchatoula
- Score
- 68/100
- State rank
- #91
- US rank
- #9755
Category grades
Schools grade is shown separately in the Schools card above.
Census & demographics
- Census place
- Ponchatoula, LA
- County
- Tangipahoa Parish · 85,958 people
- City population
- 34,564
- Metro
- Hammond, LA
- Population (ZIP)
- 34,564
- Household income
- $71,611
- Rent vs Own
- Severe rent burden
- 479.0
Population outlook (Tangipahoa County) Hauer SSP2
- Today (2025)
- 144,204 people
- By 2030
- 151,413 · +5.0%
- By 2040
- 164,374 · +14.0%
- By 2050
- 175,427 · +21.7%
- By 2075
- 195,165 · +35.3%
- By 2100
- 201,641 · +39.8%
Race, ethnicity, and origin ACS 2023
- Neighborhood character
- Predominantly White (73%)
- Race & ethnicity
- White 73% Black 16% Two or more races 8% Hispanic / Latino 8%
- Hispanic origin (detail)
- Mexican 2%
- Common ancestry
- Lithuanian 15% Slovak 1% Portuguese 1%
- Foreign-born
- 3% · Canada
- Languages at home
- 94% English-only · Spanish 5%
Political lean MEDSL · Tangipahoa
- 2024 margin
- Solid R (+37.4) · D 30.6% · R 68.0% · Other 1.3%
- 2008→2024 swing
- -6.5pp toward R · 2008: -30.9pp · 2024: -37.4pp
- All cycles
- 2024: R+37.4 2020: R+32.8 2016: R+32.6 2012: R+27.7 2008: R+30.9
Not yet ingested
- Civics
- —
Market trends
- HPI YoY
- ▼ -83.55%
- Current HPI
- 129.6069
- Rent YoY
- ▲ 0.66%
- Metro
- Hammond, LA
- State GDP YoY
- ▲ 3.29%
- F500 in state
- 10
Industry mix (Fortune 500 HQ in LA)
| Industry | F500 HQs | Revenue |
|---|---|---|
| Telecommunications | 2 | $23B |
|
||
| Utilities | 1 | $12B |
|
||
| Wholesale / Distribution | 1 | $5B |
|
||
| Advertising | 1 | $2B |
|
||
Price history
+212.5% since first listed7 events — show timeline
- 2026-06-10 Relisted — AcadianaMLS
- 2026-06-10 Relisted — GSREIN
- 2026-06-04 Pending — AcadianaMLS
- 2026-06-04 Pending — GSREIN
- 2026-05-18 Listed $225,000 GSREIN
- 2026-05-18 Listed $225,000 AcadianaMLS
- 1993-11-15 Sold (Public Records) $72,000 Public Records
Property tax history
+0.9%/yrLatest (2025): $825 · +1.5% YoY. Source: county tax records.
Cash-flow waterfall
monthlySold comps — $/sqft
last 12 mo · ≤1 miLoading sold comps…