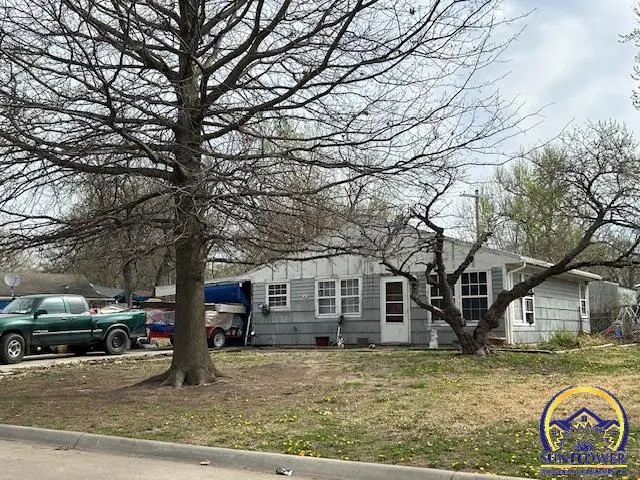
3326 SE Massachusetts Ave · Topeka, KS
Flood risk 1/10 · Minimal
- FEMA flood zone
- X (unshaded)
- Chance of flooding over 30 yrs
- 0.0%
- Est. flood insurance / yr
- $507 – $1,088
Fire risk 2/10 · Minimal
- Est. fire insurance / yr
- $1,154 – $2,142
Heat risk 4/10 · Minor
- Hot days now (above 108°F)
- 7 days/yr
- Hot days in 30 yrs
- 17 days/yr
Wind risk 2/10 · Minimal
- Chance of severe wind over 30 yrs
- —
Air-quality risk 3/10 · Minor
- Unhealthy air days now
- 3 days/yr
- Unhealthy air days in 30 yrs
- 4 days/yr
Risk factors via First Street. Map © Google.
Why this score? — see what drove the B- grade
The composite is a weighted blend of 9 inputs, each scored 0–100. Each bar is that input's sub-score; the figure is the points it added to the 100-point composite (weight × sub-score).
- Cash flow +30.0/30.0
- DSCR +10.0/10.0
- 1% rule +8.9/10.0
- ARV discount +7.5/15.0
- Livability +3.5/5.0
- Rent growth +2.5/5.0
- Condition / age +2.5/5.0
- Schools +1.7/10.0
- Appreciation +0.0/10.0
$80,000
🖨 Deal sheet 📄 Offer letter ✓ Due diligence
Listing remarks
Great opportunity for sweat equity and this 3 bedroom/ 1 bathroom ranch style home. Close to schools close to Highway access close to shopping. Home is occupied and showings are not allowed.
Key facts
- 7,405 sq ft lot
- Garage
- Built 1955
Property features AI
Finance
- Other: Listing broker: NextHome Professionals
- Financial info: Annual tax amount provided
- HOA & community: HOA details not provided
Exterior
- Parking: 1-car garage
- Security: Security details not provided
- Utilities: Utilities details not provided
- Home design: Single family residence (single house); Residential property
- Construction: Frame construction; Built with composition roof; Above-grade finished area approximately 900
- Exterior features: Lot approximately 0.17 acres; Subdivision: Highland Crest; Property located on the east side of Massachusetts Ave (directions available)
Interior
- Kitchen: Kitchen details not provided
- Bedrooms: Bedroom count not provided
- Flooring: Flooring details not provided
- Bathrooms: 1 full bathroom
- Heating & cooling: Heating and cooling details not provided
- Interior features: Composition roof
- Laundry & utility: Laundry details not provided
Neighborhood map
What this means for you Summary
Snapshot
- This is a 3-bed/1.0-bath single-family listed at $80k.
Deal economics
- At list price, monthly cash flow is $300 ($4k/yr) — positive.
- The deal already cash-flows at list — no discount required.
- Meets the 1% rule at list price ($1k rent vs $80k).
- Recommended offer: $75k (6.0% below list) — sets the bar for market timing.
- Cap rate 10.8% vs local median 4.3% in Topeka — top-decile yield for the area; either an underpriced asset or a hidden risk that comps aren't pricing in. Stress-test before assuming the spread holds.
Location & tenants
- Location reads 69/100 on livability (#195 in KS) — a middle-class / working-renter tenant base. Strengths: cost of living A+, housing A+, health & safety A+; Watch: employment C-, crime F, commute F.
- Topeka Public Schools (urban): math 17% / reading 23% proficiency, ranked #158 of 169 in KS (top 94%) — low school quality limits family demand, transient renter base, plan for 1-2y turnover; 69% free/reduced lunch — lower-income household profile, screen leases tightly.
- Zoned schools: Ross Elementary (math 8% / reading 12%, grade F, #660 of 684 statewide, top 98%, 558 students, 91% FRL); Eisenhower Middle School (math 10% / reading 8%, grade F, #204 of 219 statewide, top 94%, 486 students, 90% FRL); Highland Park High (math 8% / reading 12%, grade F, #306 of 327 statewide, top 95%, 857 students, 85% FRL) — zoned schools average 89% FRL vs 69% district-wide (20 pts higher); higher-poverty schools than district average — tighter screening recommended.
- Market conditions: 52 active listings in the ZIP; 12 comparable units currently listed for rent nearby; rentals at typical pace (median 21d on market — plan ~3-4 weeks tenant-placement turnaround); 219 units permitted in Shawnee County in 2024 (25 in 5+ unit buildings).
Forward outlook
- Local home prices are declining (-3.0%/yr); year-one equity from $553 of loan paydown is wiped out by about $2k of value loss. Plan a longer hold.
- Shawnee County population projected to shrink 7% by 2050 — rents likely to lag national; underwrite the cash flow, not the appreciation.
- At projected returns (-3.0% appreciation + 3.0% rent growth), your $22k cash investment doubles in ~8 years — after that, you're playing with house money.
Negotiation context
- It's been on market 71 days — a 6% lower offer ($75k) is reasonable based on typical stale-listing flexibility.
Risks & watch-outs
- Watch-outs: built in 1955 — expect roof / HVAC / electrical / plumbing capex.
Questions for the listing agent
- It's been on market 71 days. Have you received any prior offers? Is the seller open to a 6% concession, seller financing, or rate buy-down credit?
- Built in 1955 — when were the roof, HVAC, electrical panel, plumbing, and water heater last replaced?
- Why hasn't it sold? Are there any deal-killer items the seller is aware of (foundation, flood, title, zoning, code violations)?
- Is there a deadline driving the sale (1031 exchange, divorce, estate, relocation)? That informs how much negotiation room exists.
- Schools are D-rated, which usually means shorter tenancies and higher turnover. Who's the typical renter profile here, and what's been the actual vacancy rate?
- Crime grade is F in this area — have there been break-ins, vandalism, or insurance claims at this property in the last 3 years? What carrier currently insures it and at what premium?
- What's the average days-on-market for RENTAL listings here right now (not sales)? A rising rental-DOM trend means longer vacancies and softer asking-rent achievability than the comps imply.
- What's the recent tenant-quality profile in this submarket — average credit score on applications, eviction rate, late-payment / NSF rate, and stable-employment percentage? A property-management company in the area should have these aggregated.
- How much new for-sale + rental construction is in the pipeline within 1–3 miles? Heavy new supply typically softens prices + rents 12–24 months out; constrained supply supports both.
Investment metrics
- 1% rule
- 1.39% ✓
- Cap rate
- 10.80%
- Cash-on-cash
- 16.10%
- DSCR
- 1.72
- GRM
- 6.0
CMA / ARV
- ARV (on-the-fly)
- $173,700
- Comps found
- 1
Show comp detail 1 sale within ~0.75 mi
| Address | Dist | Beds/Ba | Sqft | Sold | Price | $/sf | Match |
|---|---|---|---|---|---|---|---|
| 3127 SE Michigan Ave | 0.60mi | 2/1.0 (-1) | 960 (+7%) | 10mo | $185,000 | $193 | 47 |
Match score weights: distance 35% · size 25% · config 20% · recency 20%. Top-matched comps best support the ARV.
Projected returns pro-forma
-3.0% appreciation · 3.0% rent growth · sell at horizon
- IRR
- 7.1%
- Equity multiple
- 1.28×
- Total profit
- $6,205
- Equity at exit
- $11,928
- IRR
- 16.4%
- Equity multiple
- 2.35×
- Total profit
- $30,171
- Equity at exit
- $6,917
Cash invested: $22,400 (down + closing). Projections, not guarantees.
Landlord ↔ Tenant lean methodology
- Overall (STATE)
- 83 Strongly Landlord-Friendly
- State Kansas
- 83 Strongly Landlord-Friendly · R+10
- County
- — inherits STATE
- City
- — inherits STATE
ZIP-level market 66605
- Active inventory
- 52
- Price-to-rent
- 6.0×
Monthly cashflow live
- Estimated rent
- $1,110 high interval (Pro) →
- Mortgage (P&I)
- −$420
- Tax from tax record
- −$123 /mo · $1,480/yr
- Insurance
- −$33
- HOA
- −$0
- Vacancy / Maint / Mgmt
- −$233
- Net cashflow
- $300
Break-even live
UW: 25.0% down · 7.5% · 30yr · 1.5% tax · 5.0% vac · 8.0% maint · 8.0% mgmt
Financing live
Cash to close
- Down payment
- $20,000
- Closing costs
- $2,400
- Reserves months
- —
- Total cash needed
- —
Loan-product check · same deal, 3 products live
Conventional
25% down · 7.5% · 30yr
- Down + closing
- —
- Monthly P&I
- —
- Monthly cashflow
- —
- DSCR
- —
- Eligible?
- —
Personal DTI + credit; lowest rate.
DSCR
20% down · 8.5% · 30yr
- Down + closing
- —
- Monthly P&I
- —
- Monthly cashflow
- —
- DSCR
- —
- Eligible?
- —
No personal income docs; deal must DSCR.
Hard money
10% down · 12.0% · 12mo
- Down + closing
- —
- Monthly P&I
- —
- Monthly cashflow
- —
- DSCR
- —
- Eligible?
- —
Short-term bridge; refi at stabilization.
Rent comps 12 comps
| Address | Beds | Baths | Sqft | Rent | $/sqft | DOM | Units | Dist |
|---|---|---|---|---|---|---|---|---|
| 3317 SE Bryant St Topeka, KS | 3.0 | 1.0 | 1000 | $1,050 | $1.05 | 21d | 1 | 0.17mi |
| 3365 SE Girard St Topeka, KS | 2.0 | 1.0 | 1023 | $950 | $0.93 | 21d | 1 | 0.57mi |
| 2704 SE Massachusetts Ave Topeka, KS | 3.0 | 1.0 | 936 | $950 | $1.01 | 21d | 1 | 0.86mi |
| 1003 SE 26th St Topeka, KS | 2.0 | 1.0 | 656 | $700 | $1.07 | 21d | 1 | 1.03mi |
| 3024 SE Swygart St Apt F Topeka, KS | 2.0 | 1.0 | 800 | $895 | $1.12 | 21d | 1 | 1.10mi |
| 3831 SW South Park Ave Unit 34 Topeka, KS | 2.0 | 2.0 | 840 | $950 | $1.13 | 21d | 1 | 1.15mi |
| 3570 SW Kerry Ave Topeka, KS | 3.0 | 1.0 | 1080 | $1,350 | $1.25 | 21d | 1 | 1.20mi |
| 3423 SW Clare Ave Topeka, KS | 3.0 | 1.0 | 1030 | $1,395 | $1.35 | 21d | 1 | 1.23mi |
| 3635 SW Devon Ave Topeka, KS | 3.0 | 1.0 | 1118 | $1,250 | $1.12 | 21d | 1 | 1.24mi |
| 1400 SW Afton St Topeka, KS | 3.0 | 1.0 | 1030 | $1,075 | $1.04 | 21d | 1 | 1.41mi |
| 1407 SW Glencoe St Topeka, KS | 3.0 | 1.0 | 1030 | $1,295 | $1.26 | 21d | 1 | 1.42mi |
| 2435 SE Colorado Ave Topeka, KS | 3.0 | 1.0 | 1100 | $1,200 | $1.09 | 21d | 1 | 1.43mi |
Listing history 9 events
-
2026-06-10days on market $80,000 Active 71 DOM
-
2026-06-09days on market $80,000 Active 70 DOM
-
2026-06-08days on market $80,000 Active 69 DOM
-
2026-06-07days on market $80,000 Active 68 DOM
-
2026-06-02days on market $80,000 Active 63 DOM
-
2026-06-01days on market $80,000 Active 62 DOM
-
2026-05-31days on market $80,000 Active 61 DOM
-
2026-05-30days on market $80,000 Active 60 DOM
-
2026-03-31$80,000 Active
ⓘ Source: listings_history table (triggers on properties + properties_extension) + one-shot
backfill from property_details.listing_events for pre-trigger history.
Tax reassessment forecast KS · Resets to sale price
- Current annual tax
- $1,480 · $123/mo
- Projected year-2 tax
- $1,480 · $123/mo
- Expected delta
- $0/yr ($0/mo · 0.0%)
ⓘ Screening estimate from a state-policy table — verify with the county assessor before closing.
Climate risk First Street
- Flood 1/10 Low FEMA zone X (unshaded) · 0% chance over 30 yrs
- Wildfire 2/10 Low
- Heat 4/10 Moderate 7 d/yr ≥108°F today · 17 d/yr by 30 yrs out
- Wind 2/10 Low
- Air quality 3/10 Moderate 3 unhealthy d/yr today · 4 by 30 yrs out
Nearby sold comps map
Loading sold comps map…
Walkable amenities ~0.75 mi
Loading nearby amenities…
Taxation est. · year 1
- Rental income
- $13,316
- − Mortgage interest
- −$4,481
- − Property taxes
- −$1,480
- − Insurance
- −$400
- − Repairs & maintenance
- −$1,065
- − Management
- −$1,065
- − Depreciation
- −$2,327
- Taxable income
- $2,497
- Est. tax owed @ 24.0%
- −$599
- After-tax cash flow
- $3,006/yr
For passive investors: Depreciation is non-cash, so a rental often shows a tax loss while cash-flowing — sheltering income. Rental losses are passive: they offset passive income freely, and up to $25,000/yr can offset ordinary (W-2) income if you actively participate and your MAGI is under $100k (phasing out to $0 by $150k); unused losses carry forward. On sale, claimed depreciation is recaptured at up to 25%, and gains may owe capital-gains tax (a 1031 exchange can defer both). Figures are a year-1 estimate at your 24.0% rate — not tax advice; consult a CPA.
Schools (NCES district)
- District
- Topeka Public Schools
- NCES district ID
- 2012260
- Math proficiency
- 17% ▼ -8.00%
- Reading proficiency
- 23% ▼ -2.00%
- Median HH income
- $37,405
- Composite
- 16.69/100
- National rank
- #9167
- State rank
- #158 of 169 in KS
Livability — Topeka
- Score
- 69/100
- State rank
- #195
- US rank
- #8848
Category grades
Schools grade is shown separately in the Schools card above.
Census & demographics
- Census place
- Topeka, KS
- County
- Shawnee County · 118,130 people
- City population
- 118,130
- Metro
- Topeka, KS
- Population (ZIP)
- 20,891
- Household income
- $59,106
- Rent vs Own
- Severe rent burden
- 490.0
Population outlook (Shawnee County) Hauer SSP2
- Today (2025)
- 179,277 people
- By 2030
- 177,762 · -0.8%
- By 2040
- 172,341 · -3.9%
- By 2050
- 166,330 · -7.2%
- By 2075
- 152,417 · -15.0%
- By 2100
- 134,782 · -24.8%
Race, ethnicity, and origin ACS 2023
- Neighborhood character
- Diverse neighborhood (Simpson 0.58)
- Race & ethnicity
- White 60% Hispanic / Latino 20% Black 13% Two or more races 10%
- Hispanic origin (detail)
- Mexican 17% Puerto Rican 2%
- Common ancestry
- Lithuanian 3% Slovak 1% Italian 1%
- Foreign-born
- 6% · Canada
- Languages at home
- 90% English-only · Spanish 9% Other Indo-European 1%
Political lean MEDSL · Shawnee
- 2024 margin
- Toss-up / Even · D 49.3% · R 48.8% · Other 2.0%
- 2008→2024 swing
- +0.8pp no change · 2008: -0.3pp · 2024: 0.5pp
- All cycles
- 2024: D+0.5 2020: D+3.0 2016: R+2.8 2012: R+1.7 2008: R+0.3
Not yet ingested
- Civics
- —
Market trends
- HPI YoY
- ▼ -150.37%
- Current HPI
- 206.375
- Rent YoY
- —
- Metro
- Topeka, KS
- State GDP YoY
- —
- F500 in state
- 0
Price history
1 event — show timeline
- 2026-03-31 Listed $80,000 Sunflower MLS as distributed by MLS GRID
Property tax history
+5.2%/yrLatest (2025): $1,480 · +42.8% YoY. Source: county tax records.
Cash-flow waterfall
monthlySold comps — $/sqft
last 12 mo · ≤1 miLoading sold comps…