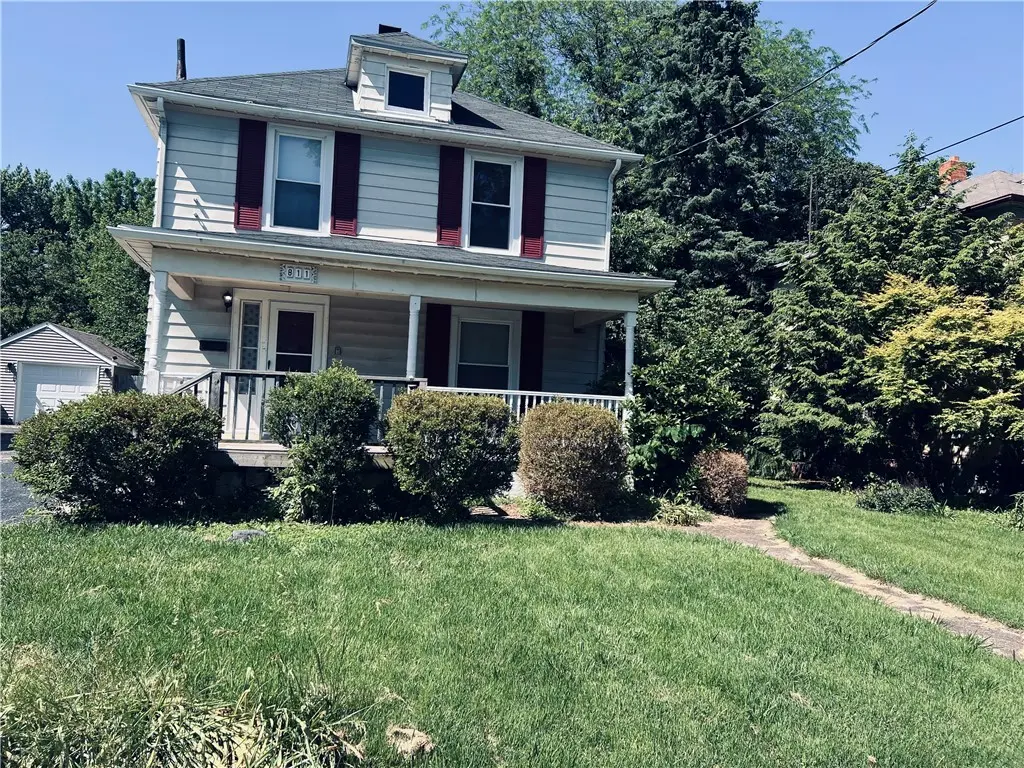
811 Bellaire Ave · Dayton, OH
Flood risk 1/10 · Minimal
- FEMA flood zone
- X (unshaded)
- Chance of flooding over 30 yrs
- 0.0%
- Est. flood insurance / yr
- $473 – $860
Fire risk 1/10 · Minimal
- Est. fire insurance / yr
- $713 – $1,323
Heat risk 3/10 · Minor
- Hot days now (above 100°F)
- 7 days/yr
- Hot days in 30 yrs
- 17 days/yr
Wind risk 2/10 · Minimal
- Chance of severe wind over 30 yrs
- 0.0%
Air-quality risk 3/10 · Minor
- Unhealthy air days now
- 2 days/yr
- Unhealthy air days in 30 yrs
- 3 days/yr
Risk factors via First Street. Map © Google.
Why this score? — see what drove the D+ grade
The composite is a weighted blend of 9 inputs, each scored 0–100. Each bar is that input's sub-score; the figure is the points it added to the 100-point composite (weight × sub-score).
- ARV discount +15.0/15.0
- Cash flow +14.5/30.0
- 1% rule +4.5/10.0
- DSCR +4.4/10.0
- Rent growth +3.7/5.0
- Livability +3.2/5.0
- Condition / age +2.5/5.0
- Schools +1.3/10.0
- Appreciation +0.0/10.0
$164,900
🖨 Deal sheet (PDF) 📄 Offer letter ✓ Due diligence
Listing remarks MLS
This wonderfully well maintained 2 story has many added features including: Totally updated kitchen with bar seating added, natural hardwood thru-out, updated bath & added 1st floor bath, inviting front porch, oversized garage & storage shed/pool house, sparkling inground pool, entertraining deck & oversized landspaced yard, updated mechanicals including electric, a/c, furnace, etc. First floor laundry room. A real beauty - A must see.
Key facts
- Fenced yard
- Storage shed
- Expansive deck
Tags
Property features AI
Finance
- Financial info: Property is listed for sale
Exterior
- Parking: Detached one-car garage
- Security: No specific security features listed
- Utilities: Natural gas heating; Central air (electric)
- Home design: Two-story residence; Aluminum and vinyl siding
- Construction: Aluminum siding; Vinyl siding
- Exterior features: Fenced yard; Porch; Storage; Shed(s)
Interior
- Kitchen: Dishwasher; Range; Refrigerator; Kitchen (approx. 13 x 11)
- Bedrooms: Main level bedroom (approx. 11 x 13); Second level bedroom (approx. 11 x 11); Second level large room (approx. 21 x 15) — could be used as bedroom/bonus space
- Flooring: Laminate counters noted (flooring type not specified)
- Bathrooms: One full bathroom; One half bathroom; One main level bathroom
- Heating & cooling: Forced air heating (natural gas); Central air conditioning
- Interior features: Double-pane windows; Ceiling fan(s); Laminate countertops; Walk-in closet(s); Full unfinished basement; One fireplace
- Laundry & utility: Basement utility space
Neighborhood map
What this means for you Summary
Snapshot
- This is a 3-bed/1.5-bath single-family listed at $165k.
Deal economics
- At list price, monthly cash flow is $37 ($443/yr) — positive.
- The deal already cash-flows at list — no discount required.
- To meet the 1% rule (rent ≥ 1% of price), the offer needs to be $157k (4.8% below list).
- Recommended offer: $157k (4.8% below list) — sets the bar for 1% rule.
Location & tenants
- Location reads 65/100 on livability (#716 in OH) — a middle-class / working-renter tenant base. Strengths: cost of living A+, housing A+, health & safety A; Watch: amenities C-, crime F, commute F.
- Dayton City (urban): math 12% / reading 21% proficiency, ranked #641 of 656 in OH (top 98%) — low school quality limits family demand, transient renter base, plan for 1-2y turnover; 74% free/reduced lunch — lower-income household profile, screen leases tightly.
- Zoned schools: River'S Edge Montessori Elementary School (math 22% / reading 32%, grade F, #1,193 of 1,584 statewide, top 76%, 494 students, 0% FRL); Belmont High School (math 5% / reading 20%, grade F, #720 of 781 statewide, top 93%, 1,100 students, 0% FRL) — zoned schools average 0% FRL vs 74% district-wide (74 pts lower); this property's tenant base skews higher-income than the district average.
- Market conditions: Rents rising fast (+4.8%/yr); 106 active listings in the ZIP; 40 comparable units currently listed for rent nearby; rentals at typical pace (median 26d on market — plan ~3-4 weeks tenant-placement turnaround); 907 units permitted in Montgomery County in 2024 (416 in 5+ unit buildings).
- This rent runs 31% of the median local income ($61k/yr) — at the standard rent-burdened threshold; future hikes will face affordability resistance.
Forward outlook
- Local home prices are declining (-3.0%/yr); year-one equity from $1k of loan paydown is wiped out by about $5k of value loss. Plan a longer hold.
- Montgomery County population projected at -10% by 2050 — secular population decline; favor cash flow + early exit over multi-decade hold.
Negotiation context
- It's been on market 16 days — a 2% lower offer ($162k) is reasonable based on typical stale-listing flexibility.
- 3 sale attempts since 16y ago with the ask held roughly flat each time — persistent listings suggest the price (not the market) is what's stuck; bring a comps-based counter.
Risks & watch-outs
- Watch-outs: built in 1928 — expect roof / HVAC / electrical / plumbing capex.
Questions for the listing agent
- Built in 1928 — when were the roof, HVAC, electrical panel, plumbing, and water heater last replaced?
- Is there a deadline driving the sale (1031 exchange, divorce, estate, relocation)? That informs how much negotiation room exists.
- Crime grade is F in this area — have there been break-ins, vandalism, or insurance claims at this property in the last 3 years? What carrier currently insures it and at what premium?
- The area grade is low — what's the realistic commute time and amenity access for the typical tenant pool here? Any planned neighborhood developments (good or bad) we should know about?
- What's the average days-on-market for RENTAL listings here right now (not sales)? A rising rental-DOM trend means longer vacancies and softer asking-rent achievability than the comps imply.
- What's the recent tenant-quality profile in this submarket — average credit score on applications, eviction rate, late-payment / NSF rate, and stable-employment percentage? A property-management company in the area should have these aggregated.
- How much new for-sale + rental construction is in the pipeline within 1–3 miles? Heavy new supply typically softens prices + rents 12–24 months out; constrained supply supports both.
Investment metrics
- 1% rule
- 0.95% ✗
- Cap rate
- 6.56%
- Cash-on-cash
- 0.96%
- DSCR
- 1.04
- GRM
- 8.8
CMA / ARV
- ARV (on-the-fly)
- $224,532
- Comps found
- 12
Show comp detail 12 sales within ~0.75 mi
| Address | Dist | Beds/Ba | Sqft | Sold | Price | $/sf | Match |
|---|---|---|---|---|---|---|---|
| 412 Nordale Ave | 0.26mi | 3/2.0 | 1,544 (+6%) | 1mo | $250,000 | $162 | 75 |
| 2804 Winburn Ave | 0.20mi | 3/1.0 | 1,264 (-13%) | 2mo | $195,000 | $154 | 65 |
| 4408 Woodbine Ave | 0.75mi | 3/1.5 | 1,458 (0%) | 2mo | $195,000 | $134 | 63 |
| 208 Nordale Ave | 0.41mi | 3/2.5 | 1,344 (-8%) | 1mo | $215,000 | $160 | 63 |
| 2828 Dwight Ave | 0.39mi | 3/1.0 | 1,308 (-10%) | 2mo | $187,000 | $143 | 61 |
| 135 Puritan Pl | 0.56mi | 4/3.0 (+1) | 1,429 (-2%) | 2mo | $166,000 | $116 | 58 |
| 922 Broadmoor Dr | 0.70mi | 4/2.0 (+1) | 1,485 (+2%) | 1mo | $272,000 | $183 | 57 |
| 3229 Kenmore Ave | 0.41mi | 3/2.0 | 1,272 (-13%) | 3mo | $205,000 | $161 | 55 |
| 3605 Woodbine Ave | 0.49mi | 3/1.0 | 1,284 (-12%) | 1mo | $135,000 | $105 | 54 |
| 934 Weng Ave | 0.39mi | 3/2.0 | 1,253 (-14%) | 4mo | $157,000 | $125 | 54 |
| 724 Patterson Rd | 0.72mi | 3/1.5 | 1,367 (-6%) | 4mo | $258,500 | $189 | 52 |
| 2225 Revere Ave | 0.51mi | 4/1.5 (+1) | 1,608 (+10%) | 4mo | $160,000 | $100 | 51 |
Match score weights: distance 35% · size 25% · config 20% · recency 20%. Top-matched comps best support the ARV.
Projected returns pro-forma
-3.0% appreciation · 4.82% rent growth · sell at horizon
- IRR
- -12.6%
- Equity multiple
- 0.54×
- Total profit
- $-21,380
- Equity at exit
- $24,587
- IRR
- -0.8%
- Equity multiple
- 0.94×
- Total profit
- $-2,871
- Equity at exit
- $14,258
Cash invested: $46,172 (down + closing). Projections, not guarantees.
Landlord ↔ Tenant lean methodology
- Overall (STATE)
- 73 Landlord-Friendly
- State Ohio
- 73 Landlord-Friendly · R+6
- County
- — inherits STATE
- City
- — inherits STATE
ZIP-level market 45420
- Rents YoY
- 4.8%
- Active inventory
- 106
- Price-to-rent
- 8.8×
Monthly cashflow live
- Estimated rent
- $1,570 high interval (Pro) →
- Mortgage (P&I)
- −$865
- Tax from tax record
- −$270 /mo · $3,234/yr
- Insurance
- −$69
- HOA
- −$0
- Vacancy / Maint / Mgmt
- −$330
- Net cashflow
- $37
Break-even live
Sensitivity live
| Price | -10% $130 | -5% $84 | +0% $37 | +5% $-10 | +10% $-56 |
|---|---|---|---|---|---|
| Rent | -10% $-87 | -5% $-25 | +0% $37 | +5% $99 | +10% $161 |
| Rate | -1.0pp $120 | -0.5pp $79 | base $37 | +0.5pp $-6 | +1.0pp $-49 |
UW: 25.0% down · 7.5% · 30yr · 1.5% tax · 5.0% vac · 8.0% maint · 8.0% mgmt
Financing live
Cash to close
- Down payment
- $41,225
- Closing costs
- $4,947
- Reserves months
- —
- Total cash needed
- —
Loan-product check · same deal, 3 products live
Conventional
25% down · 7.5% · 30yr
- Down + closing
- —
- Monthly P&I
- —
- Monthly cashflow
- —
- DSCR
- —
- Eligible?
- —
Personal DTI + credit; lowest rate.
DSCR
20% down · 8.5% · 30yr
- Down + closing
- —
- Monthly P&I
- —
- Monthly cashflow
- —
- DSCR
- —
- Eligible?
- —
No personal income docs; deal must DSCR.
Hard money
10% down · 12.0% · 12mo
- Down + closing
- —
- Monthly P&I
- —
- Monthly cashflow
- —
- DSCR
- —
- Eligible?
- —
Short-term bridge; refi at stabilization.
Rent comps 40 comps
| Address | Beds | Baths | Sqft | Rent | $/sqft | DOM | Units | Dist |
|---|---|---|---|---|---|---|---|---|
| 906 Nordale Ave Dayton, OH | 3.0 | 2.0 | 1262 | $2,200 | $1.74 | 46d | 1 | 0.07mi |
| 1121 Colwick Dr Dayton, OH | 3.0 | 2.0 | 1272 | $1,875 | $1.47 | 23d | 1 | 0.31mi |
| 2212 Fauver Ave Dayton, OH | 3.0 | 1.0 | 1300 | $1,795 | $1.38 | 46d | 1 | 0.48mi |
| 3311 S Smithville Rd Dayton, OH | 3.0 | 1.0 | 1019 | $1,295 | $1.27 | 46d | 1 | 0.49mi |
| 1053 Wilmington Ave Dayton, OH | 2.0–3.0 | 1.0–1.5 | 1025 | $1,495 | $1.46 | 4d | 5 | 0.54mi |
| 1059 Wilmington Ave Unit 1059 1 Dayton, OH | 3.0 | 1.5 | 1100 | $1,495 | $1.36 | 46d | 1 | 0.54mi |
| 933 Wilmington Ave Dayton, OH | 1.0–2.0 | 1.0–1.5 | 802 | $980 | $1.22 | 5d | 8 | 0.61mi |
| 2029 Brookline Ave Dayton, OH | 2.0 | 1.0 | 990 | $1,270 | $1.28 | 16d | 1 | 0.65mi |
| 1828 Hazel Ave Dayton, OH | 2.0 | 1.0 | 960 | $1,435 | $1.49 | 4d | 1 | 0.66mi |
| 809 Patterson Rd Dayton, OH | 2.0 | 1.0–1.5 | 895 | $1,075 | $1.20 | 4d | 7 | 0.67mi |
| 737 Wilmington Ave Dayton, OH | 2.0 | 1.0 | 1000 | $950 | $0.95 | 25d | 1 | 0.71mi |
| 2526 Kennedy Ave Dayton, OH | 3.0 | 1.0 | 1232 | $1,300 | $1.06 | 46d | 1 | 0.72mi |
| 1905 Coventry Rd Dayton, OH | 2.0 | 1.0 | 1000 | $1,250 | $1.25 | 25d | 1 | 0.72mi |
| 2112 Patterson Rd Dayton, OH | 3.0 | 1.0 | 1008 | $1,425 | $1.41 | 4d | 1 | 0.74mi |
| 3603 S Smithville Rd Kettering, OH | 2.0 | 1.0 | 950 | $1,100 | $1.16 | 25d | 1 | 0.78mi |
| 4253 Pleasant View Ave Dayton, OH | 3.0 | 2.0 | 1440 | $1,695 | $1.18 | 46d | 1 | 0.84mi |
| 4249 Pleasant View Ave Dayton, OH | 3.0 | 2.0 | 1440 | $1,695 | $1.18 | 46d | 1 | 0.84mi |
| 2600 Wayne Ave Dayton, OH | 4.0 | 1.5 | 1328 | $1,500 | $1.13 | 25d | 1 | 0.93mi |
| 1410 Phillips Ave Unit 1 Dayton, OH | 2.0 | 1.0 | 1000 | $950 | $0.95 | 46d | 1 | 0.96mi |
| 344 Firwood Dr Dayton, OH | 1.0–3.0 | 1.0–1.5 | 739 | $1,350 | $1.83 | 4d | 15 | 0.96mi |
| 2274 Broadmoor Dr Dayton, OH | 3.0 | 1.5 | 1188 | $2,145 | $1.81 | 4d | 1 | 1.02mi |
| 2306 Alice St Dayton, OH | 3.0 | 1.0 | 918 | $1,200 | $1.31 | 5d | 1 | 1.06mi |
| 1659 Hearthstone Dr Dayton, OH | 3.0 | 1.0 | 1102 | $1,195 | $1.08 | 4d | 1 | 1.21mi |
| 440 Lonsdale Ave #1 Dayton, OH | 2.0 | 1.0 | 1050 | $1,450 | $1.38 | 13d | 1 | 1.22mi |
| 4500 Elliot Ave Dayton, OH | 2.0 | 1.5 | 1283 | $1,250 | $0.97 | 4d | 1 | 1.22mi |
| 1520 S Smithville Rd Dayton, OH | 3.0 | 2.0 | 1481 | $1,345 | $0.91 | 4d | 1 | 1.24mi |
| 854 Santa Cruz Ave Dayton, OH | 3.0 | 1.0 | 1060 | $1,300 | $1.23 | 46d | 1 | 1.26mi |
| 1430 Coventry Rd Dayton, OH | 2.0 | 1.0 | 1106 | $1,125 | $1.02 | 16d | 1 | 1.27mi |
| 1101 Phillips Ave Unit 1101 Dayton, OH | 3.0 | 1.5 | 1300 | $1,450 | $1.12 | 46d | 1 | 1.27mi |
| 313 Illinois Ave Dayton, OH | 3.0 | 1.0 | 1142 | $975 | $0.85 | 5d | 1 | 1.30mi |
| 920 E Stewart St Dayton, OH | 4.0 | 1.0 | 1322 | $1,425 | $1.08 | 46d | 1 | 1.32mi |
| 2132 Wayne Ave Dayton, OH | 3.0 | 2.0 | 1484 | $1,350 | $0.91 | 4d | 1 | 1.33mi |
| 3100 Linden Ave Unit 3102 Dayton, OH | 2.0 | 1.0 | 1035 | $995 | $0.96 | 46d | 1 | 1.34mi |
| 534 Beckman St Dayton, OH | 3.0 | 2.0 | 1452 | $1,400 | $0.96 | 4d | 1 | 1.35mi |
| 2212 Farmside Dr Dayton, OH | 3.0 | 1.0 | 1008 | $1,395 | $1.38 | 46d | 1 | 1.36mi |
| 2114 Wayne Ave Dayton, OH | 4.0 | 2.0 | 1723 | $1,595 | $0.93 | 46d | 1 | 1.36mi |
| 136 Indiana Ave Dayton, OH | 3.0 | 1.0 | 1194 | $1,250 | $1.05 | 25d | 1 | 1.37mi |
| 1901 Shroyer Rd Oakwood, OH | 2.0 | 2.0 | 1262 | $2,000 | $1.58 | 4d | 1 | 1.40mi |
| 2012 Saint Charles Ave Dayton, OH | 2.0 | 1.0 | 945 | $1,250 | $1.32 | 46d | 1 | 1.41mi |
| 706 Kolping Ave Unit 706 Dayton, OH | 3.0 | 1.5 | 1172 | $1,300 | $1.11 | 4d | 1 | 1.42mi |
Listing history 12 events
-
2026-06-22days on market $164,900 Active 16 DOM
-
2026-06-18days on market $164,900 Active 13 DOM
-
2026-06-17days on market $164,900 Active 12 DOM
-
2026-06-16days on market $164,900 Active 11 DOM
-
2026-06-15days on market $164,900 Active 10 DOM
-
2026-06-14days on market $164,900 Active 8 DOM
-
2026-06-13days on market $164,900 Active 7 DOM
-
2026-06-10days on market $164,900 Active 5 DOM
-
2026-06-09days on market $164,900 Active 4 DOM
-
2026-06-08days on market $164,900 Active 3 DOM
-
2026-06-07remarks 699-char remark
-
2026-06-07$164,900 Active 2 DOM
ⓘ Source: listings_history table (triggers on properties + properties_extension) + one-shot
backfill from property_details.listing_events for pre-trigger history.
Tax reassessment forecast OH · Partial reset (capped growth)
- Current annual tax
- $3,234 · $270/mo
- Projected year-2 tax
- $3,234 · $270/mo
- Expected delta
- $0/yr ($0/mo · 0.0%)
ⓘ Screening estimate from a state-policy table — verify with the county assessor before closing.
Climate risk First Street
- Flood 1/10 Low FEMA zone X (unshaded) · 0% chance over 30 yrs
- Wildfire 1/10 Low
- Heat 3/10 Moderate 7 d/yr ≥100°F today · 17 d/yr by 30 yrs out
- Wind 2/10 Low 0% chance of damaging wind over 30 yrs
- Air quality 3/10 Moderate 2 unhealthy d/yr today · 3 by 30 yrs out
Nearby sold comps map
Loading sold comps map…
Walkable amenities ~0.75 mi
Loading nearby amenities…
Taxation est. · year 1
- Rental income
- $18,834
- − Mortgage interest
- −$9,237
- − Property taxes
- −$3,234
- − Insurance
- −$824
- − Repairs & maintenance
- −$1,507
- − Management
- −$1,507
- − Depreciation
- −$4,797
- Taxable loss
- −$2,272
- Est. tax savings @ 24.0%
- +$545
- After-tax cash flow
- $989/yr
For passive investors: Depreciation is non-cash, so a rental often shows a tax loss while cash-flowing — sheltering income. Rental losses are passive: they offset passive income freely, and up to $25,000/yr can offset ordinary (W-2) income if you actively participate and your MAGI is under $100k (phasing out to $0 by $150k); unused losses carry forward. On sale, claimed depreciation is recaptured at up to 25%, and gains may owe capital-gains tax (a 1031 exchange can defer both). Figures are a year-1 estimate at your 24.0% rate — not tax advice; consult a CPA.
Schools (NCES district)
- District
- Dayton City
- NCES district ID
- 3904384
- Math proficiency
- 12% ▼ -12.00%
- Reading proficiency
- 21% ▼ -11.00%
- Median HH income
- $28,688
- Composite
- 12.94/100
- National rank
- #9579
- State rank
- #641 of 656 in OH
Livability — Dayton
- Score
- 65/100
- State rank
- #716
- US rank
- #12895
Category grades
Schools grade is shown separately in the Schools card above.
Census & demographics
- Census place
- Dayton, OH
- County
- Montgomery County · 459,541 people
- City population
- 164,387
- Metro
- Dayton-Kettering, OH
- Population (ZIP)
- 24,411
- Household income
- $60,588
- Rent vs Own
- Severe rent burden
- 856.0
Population outlook (Montgomery County) Hauer SSP2
- Today (2025)
- 523,241 people
- By 2030
- 514,948 · -1.6%
- By 2040
- 493,378 · -5.7%
- By 2050
- 469,639 · -10.2%
- By 2075
- 418,360 · -20.0%
- By 2100
- 353,315 · -32.5%
Race, ethnicity, and origin ACS 2023
- Neighborhood character
- Predominantly White (83%)
- Race & ethnicity
- White 83% Black 7% Two or more races 6% Hispanic / Latino 3% Asian 3%
- Common ancestry
- Lithuanian 3% Slovak 2% Italian 2%
- Foreign-born
- 7% · Canada, China
- Languages at home
- 93% English-only · Other Indo-European 2% Spanish 2% Chinese 0%
Political lean MEDSL · Montgomery
- 2024 margin
- Toss-up / Even · D 49.8% · R 49.3%
- 2008→2024 swing
- -5.8pp toward R · 2008: 6.2pp · 2024: 0.5pp
- All cycles
- 2024: D+0.5 2020: D+2.2 2016: R+1.2 2012: D+3.1 2008: D+6.2
Not yet ingested
- Civics
- —
Market trends
- HPI YoY
- ▼ -192.56%
- Current HPI
- 241.6543
- Rent YoY
- ▲ 4.82%
- Metro
- Dayton-Kettering, OH
- State GDP YoY
- ▲ 1.98%
- F500 in state
- 48
Industry mix (Fortune 500 HQ in OH)
| Industry | F500 HQs | Revenue |
|---|---|---|
| Insurance | 3 | $145B |
|
||
| Industrial Machinery | 3 | $49B |
|
||
| Financial Services | 3 | $24B |
|
||
| Consumer Goods | 2 | $93B |
|
||
| Aerospace / Defense | 2 | $47B |
|
||
| Utilities | 2 | $33B |
|
||
Price history
+50.0% since first listed11 events — show timeline
- 2026-06-05 Listed $164,900 Dayton MLS
- 2024-09-23 Sold (Public Records) $12,422,000 Public Records
- 2019-05-31 Sold (Public Records) $66,500 Public Records
- 2019-05-31 Sold (Public Records) $48,000 Public Records
- 2012-02-16 Sold (Public Records) $101,000 Public Records
- 2012-02-10 Sold (MLS) $101,000 Dayton MLS
- 2012-02-10 Sold (MLS) $101,000 Dayton MLS
- 2011-11-01 Listing Removed — Dayton MLS
- 2011-07-22 Listed $106,250 Dayton MLS
- 2011-07-20 Listing Removed — Dayton MLS
- 2010-10-11 Listed $109,900 Dayton MLS
Property tax history
+2.8%/yrLatest (2025): $3,234 · -0.2% YoY. Source: county tax records.
Cash-flow waterfall
monthlySold comps — $/sqft
last 12 mo · ≤1 miLoading sold comps…