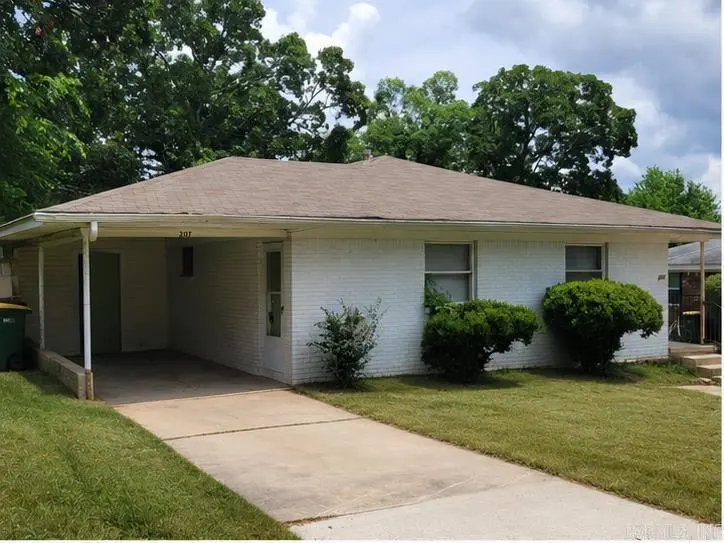
205 / 207 W J Ave · North Little Rock, AR
Flood risk 1/10 · Minimal
- FEMA flood zone
- X (unshaded)
- Chance of flooding over 30 yrs
- 0.0%
- Est. flood insurance / yr
- $507 – $1,088
Fire risk 1/10 · Minimal
- Est. fire insurance / yr
- $1,499 – $2,785
Heat risk 7/10 · Major
- Hot days now (above 112°F)
- 7 days/yr
- Hot days in 30 yrs
- 18 days/yr
Wind risk 4/10 · Minor
- Chance of severe wind over 30 yrs
- 9.0%
Air-quality risk 2/10 · Minimal
- Unhealthy air days now
- 1 days/yr
- Unhealthy air days in 30 yrs
- 1 days/yr
Risk factors via First Street. Map © Google.
Why this score? — see what drove the D grade
The composite is a weighted blend of 9 inputs, each scored 0–100. Each bar is that input's sub-score; the figure is the points it added to the 100-point composite (weight × sub-score).
- Cash flow +15.4/30.0
- ARV discount +7.5/15.0
- DSCR +4.7/10.0
- Livability +3.7/5.0
- 1% rule +3.6/10.0
- Rent growth +3.6/5.0
- Condition / age +2.5/5.0
- Schools +2.0/10.0
- Appreciation +0.0/10.0
$179,900
🖨 Deal sheet (PDF) 📄 Offer letter ✓ Due diligence
Listing remarks MLS
Awesome income producing property. Both units are occupied. Units include a porch, storage area, patio and carport. Two year old roof and unit 207 has a new HVAC. Refrigerators convey. Bring your investors!
Key facts
- Private carport
- 6,534 sq ft lot
- Built 1955
Tags
Property features AI
Finance
- Other: Approximate lot size 0.15 acres (per tax records); Approximate building size 1,782 (per tax records); Minimum 2-bedroom rent: $745; Maximum 2-bedroom rent: $850
- Financial info: Potential financing: Cash, FHA, Conventional, VA; Two-unit multifamily property; Tenant pays all utilities; Management expenses included
Exterior
- Parking: Carport; Parking pads
- Utilities: Municipal electric; Public water; Public sewer
- Home design: Brick and frame combination exterior; Brick exterior
- Construction: Crawl space foundation; Composition roof
- Exterior features: Level lot; Paved road access; Lot dimensions approximately 62 x 120 x 64 x 120; Lot inside city limits; Zoned R-3
Interior
- Kitchen: Free-standing stove; Gas range; Disposal
- Bedrooms: Two 2-bedroom units
- Flooring: Laminate; Luxury vinyl; Tile
- Heating & cooling: Central heating (gas); Central cooling (electric)
- Interior features: Washer connection; Electric dryer connection
- Laundry & utility: Washer connection; Electric dryer connection
Neighborhood map
What this means for you Summary
Snapshot
- This is a 4-bed/2.0-bath other listed at $180k.
Deal economics
- At list price, monthly cash flow is $68 ($817/yr) — positive.
- The deal already cash-flows at list — no discount required.
- To meet the 1% rule (rent ≥ 1% of price), the offer needs to be $155k (14.0% below list).
- Recommended offer: $155k (14.0% below list) — sets the bar for 1% rule.
- Cap rate 6.7% vs local median 5.0% in North Little Rock — top-decile yield for the area; either an underpriced asset or a hidden risk that comps aren't pricing in. Stress-test before assuming the spread holds.
Location & tenants
- Location reads 73/100 on livability (#24 in AR) — a middle-class / working-renter tenant base. Strengths: commute A+, cost of living A+, housing A+; Watch: crime F, amenities F, employment D-.
- N. Little Rock School District (urban): math 21% / reading 26% proficiency, ranked #191 of 238 in AR (top 80%) — low school quality limits family demand, transient renter base, plan for 1-2y turnover; 66% free/reduced lunch — lower-income household profile, screen leases tightly.
- Zoned schools: Ridgeroad Elementary School (math 13% / reading 10%, grade F, #423 of 454 statewide, top 93%, 535 students, 100% FRL); Lakewood Middle School (math 23% / reading 32%, grade F, #155 of 201 statewide, top 77%, 1,115 students, 100% FRL); North Little Rock High School (math 12% / reading 26%, grade F, #248 of 292 statewide, top 86%, 1,949 students, 100% FRL) — zoned schools average 100% FRL vs 66% district-wide (33 pts higher); higher-poverty schools than district average — tighter screening recommended.
- Market conditions: Rents rising fast (+4.2%/yr); 85 active listings in the ZIP; 26 comparable units currently listed for rent nearby; rentals lingering (median 46d on market — plan ~5-8 weeks vacancy on turnover, expect pricing pressure); 50% of comp listings sitting > 30 days — soft ceiling on asking rent; solid renter incomes; 1,006 units permitted in Pulaski County in 2024 (0 in 5+ unit buildings).
Forward outlook
- Local home prices are declining (-3.0%/yr); year-one equity from $1k of loan paydown is wiped out by about $5k of value loss. Plan a longer hold.
- Pulaski County population projected at +6% by 2050 — modest demand growth; plan on rents tracking national, not racing it.
Negotiation context
- It's been on market 19 days — a 2% lower offer ($177k) is reasonable based on typical stale-listing flexibility.
- 3 sale attempts since 9y ago with the ask held roughly flat each time — persistent listings suggest the price (not the market) is what's stuck; bring a comps-based counter.
- Current owner paid $71k; list at $180k implies a 152% gain — meaningful room to come down on a strong offer.
Risks & watch-outs
- Watch-outs: built in 1955 — expect roof / HVAC / electrical / plumbing capex.
- Climate carrying-cost: extreme-heat days projected 7→18/yr by 2055 (HVAC capex compounding) — expect insurance premiums to compound above CPI over the hold.
Questions for the listing agent
- Built in 1955 — when were the roof, HVAC, electrical panel, plumbing, and water heater last replaced?
- Is there a deadline driving the sale (1031 exchange, divorce, estate, relocation)? That informs how much negotiation room exists.
- Schools are D-rated, which usually means shorter tenancies and higher turnover. Who's the typical renter profile here, and what's been the actual vacancy rate?
- Crime grade is F in this area — have there been break-ins, vandalism, or insurance claims at this property in the last 3 years? What carrier currently insures it and at what premium?
- The area grade is low — what's the realistic commute time and amenity access for the typical tenant pool here? Any planned neighborhood developments (good or bad) we should know about?
- What's the average days-on-market for RENTAL listings here right now (not sales)? A rising rental-DOM trend means longer vacancies and softer asking-rent achievability than the comps imply.
- What's the recent tenant-quality profile in this submarket — average credit score on applications, eviction rate, late-payment / NSF rate, and stable-employment percentage? A property-management company in the area should have these aggregated.
- How much new for-sale + rental construction is in the pipeline within 1–3 miles? Heavy new supply typically softens prices + rents 12–24 months out; constrained supply supports both.
Investment metrics
- 1% rule
- 0.86% ✗
- Cap rate
- 6.75%
- Cash-on-cash
- 1.62%
- DSCR
- 1.07
- GRM
- 9.7
CMA / ARV
No comps found within radius.
Projected returns pro-forma
-3.0% appreciation · 4.21% rent growth · sell at horizon
- IRR
- -12.5%
- Equity multiple
- 0.54×
- Total profit
- $-22,942
- Equity at exit
- $26,824
- IRR
- -1.8%
- Equity multiple
- 0.87×
- Total profit
- $-6,503
- Equity at exit
- $15,554
Cash invested: $50,372 (down + closing). Projections, not guarantees.
Landlord ↔ Tenant lean methodology
- Overall (STATE)
- 92 Strongly Landlord-Friendly
- State Arkansas
- 92 Strongly Landlord-Friendly · R+14
- County
- — inherits STATE
- City
- — inherits STATE
ZIP-level market 72116
- Rents YoY
- 4.2%
- Active inventory
- 85
- Price-to-rent
- 9.7×
Monthly cashflow live
- Estimated rent
- $1,548 high interval (Pro) →
- Mortgage (P&I)
- −$943
- Tax from tax record
- −$136 /mo · $1,634/yr
- Insurance
- −$75
- HOA
- −$0
- Vacancy / Maint / Mgmt
- −$325
- Net cashflow
- $68
Break-even live
Sensitivity live
| Price | -10% $170 | -5% $119 | +0% $68 | +5% $17 | +10% $-34 |
|---|---|---|---|---|---|
| Rent | -10% $-54 | -5% $7 | +0% $68 | +5% $129 | +10% $190 |
| Rate | -1.0pp $159 | -0.5pp $114 | base $68 | +0.5pp $21 | +1.0pp $-26 |
UW: 25.0% down · 7.5% · 30yr · 1.5% tax · 5.0% vac · 8.0% maint · 8.0% mgmt
Financing live
Cash to close
- Down payment
- $44,975
- Closing costs
- $5,397
- Reserves months
- —
- Total cash needed
- —
Loan-product check · same deal, 3 products live
Conventional
25% down · 7.5% · 30yr
- Down + closing
- —
- Monthly P&I
- —
- Monthly cashflow
- —
- DSCR
- —
- Eligible?
- —
Personal DTI + credit; lowest rate.
DSCR
20% down · 8.5% · 30yr
- Down + closing
- —
- Monthly P&I
- —
- Monthly cashflow
- —
- DSCR
- —
- Eligible?
- —
No personal income docs; deal must DSCR.
Hard money
10% down · 12.0% · 12mo
- Down + closing
- —
- Monthly P&I
- —
- Monthly cashflow
- —
- DSCR
- —
- Eligible?
- —
Short-term bridge; refi at stabilization.
Rent comps 26 comps
| Address | Beds | Baths | Sqft | Rent | $/sqft | DOM | Units | Dist |
|---|---|---|---|---|---|---|---|---|
| 3815 Idlewild Ave North Little Rock, AR | 3.0 | 2.5 | 1925 | $1,681 | $0.87 | 25d | 1 | 0.33mi |
| 4612 N Cypress St North Little Rock, AR | 3.0 | 2.0 | 1636 | $1,450 | $0.89 | 45d | 1 | 0.39mi |
| 4700 N Locust St North Little Rock, AR | 3.0 | 2.0 | 1549 | $1,450 | $0.94 | 21d | 1 | 0.40mi |
| 4417 Hazelwood Rd North Little Rock, AR | 3.0 | 2.0 | 1568 | $1,425 | $0.91 | 45d | 1 | 0.46mi |
| 5109 N Cedar St North Little Rock, AR | 4.0 | 2.0 | 2185 | $1,595 | $0.73 | 45d | 1 | 0.68mi |
| 4207 Lochridge Rd North Little Rock, AR | 3.0 | 1.5 | 1297 | $1,500 | $1.16 | 45d | 1 | 0.69mi |
| 1313 Garland Ave North Little Rock, AR | 3.0 | 2.0 | 1800 | $1,500 | $0.83 | 45d | 1 | 0.71mi |
| 3737 Lakeshore Dr North Little Rock, AR | 3.0 | 1.5 | 1308 | $2,200 | $1.68 | 45d | 1 | 0.71mi |
| 407 W 33rd St North Little Rock, AR | 3.0 | 2.0 | 1472 | $1,025 | $0.70 | 45d | 1 | 0.74mi |
| 117 Link Rd North Little Rock, AR | 3.0 | 2.0 | 1407 | $1,600 | $1.14 | 45d | 1 | 0.75mi |
| 407 W 51st St North Little Rock, AR | 3.0 | 2.0 | 1368 | $1,300 | $0.95 | 45d | 1 | 0.84mi |
| 1822 McCain Blvd North Little Rock, AR | 3.0 | 2.0 | 1429 | $1,595 | $1.12 | 45d | 1 | 0.90mi |
| 5501 N Walnut Rd North Little Rock, AR | 3.0 | 2.0 | 1669 | $1,450 | $0.87 | 45d | 1 | 0.94mi |
| 4907 Arlington Dr North Little Rock, AR | 3.0 | 2.5 | 1906 | $1,800 | $0.94 | 45d | 1 | 1.03mi |
| 5704 Belle Point Rd North Little Rock, AR | 4.0 | 3.0 | 2552 | $1,995 | $0.78 | 16d | 1 | 1.08mi |
| 134 Sheridan Rd North Little Rock, AR | 3.0 | 2.0 | 1312 | $1,600 | $1.22 | 21d | 1 | 1.11mi |
| 5612 Crescent Dr North Little Rock, AR | 3.0 | 2.0 | 1275 | $1,150 | $0.90 | 21d | 1 | 1.12mi |
| 2400 McCain Blvd North Little Rock, AR | 3.0 | 1.0–2.0 | 785 | $1,239 | $1.58 | 16d | 23 | 1.16mi |
| 5813 N Walnut Rd North Little Rock, AR | 3.0 | 2.0 | 1886 | $1,800 | $0.95 | 25d | 1 | 1.18mi |
| 1429 Skyline Dr North Little Rock, AR | 4.0 | 2.0 | 1539 | $3,200 | $2.08 | 45d | 1 | 1.28mi |
| 5423 Pike Ave North Little Rock, AR | 3.0 | 2.0 | 1296 | $1,100 | $0.85 | 25d | 1 | 1.29mi |
| 4801 N Hills Blvd North Little Rock, AR | 1.0–3.0 | 1.0–2.0 | 977 | $1,500 | $1.53 | 16d | 5 | 1.30mi |
| 808 Silver Hill Rd Unit NA North Little Rock, AR | 3.0 | 2.0 | 1850 | $1,600 | $0.86 | 21d | 1 | 1.32mi |
| 508 Westfield Dr North Little Rock, AR | 4.0 | 2.0 | 1434 | $1,595 | $1.11 | 23d | 1 | 1.35mi |
| 5 Cliffwood Cir North Little Rock, AR | 3.0 | 2.0 | 1662 | $1,195 | $0.72 | 25d | 1 | 1.37mi |
| 1920 N Poplar St North Little Rock, AR | 4.0 | 2.0 | 1422 | $1,595 | $1.12 | 16d | 1 | 1.40mi |
Listing history 14 events
-
2026-06-21days on market $179,900 Active 19 DOM
-
2026-06-18days on market $179,900 Active 16 DOM
-
2026-06-17days on market $179,900 Active 15 DOM
-
2026-06-16days on market $179,900 Active 14 DOM
-
2026-06-15days on market $179,900 Active 13 DOM
-
2026-06-14days on market $179,900 Active 11 DOM
-
2026-06-13days on market $179,900 Active 10 DOM
-
2026-06-10days on market $179,900 Active 8 DOM
-
2026-06-09statusdays on market $179,900 Active 7 DOM
-
2026-06-08days on market $179,900 New Listing 6 DOM
-
2026-06-07days on market $179,900 New Listing 5 DOM
-
2026-06-05days on market $179,900 New Listing 2 DOM
-
2026-06-03remarks 699-char remark
-
2026-06-03$179,900 New Listing 1 DOM
ⓘ Source: listings_history table (triggers on properties + properties_extension) + one-shot
backfill from property_details.listing_events for pre-trigger history.
Tax reassessment forecast AR · Resets to sale price
- Current annual tax
- $1,634 · $136/mo
- Projected year-2 tax
- $1,634 · $136/mo
- Expected delta
- $0/yr ($0/mo · 0.0%)
ⓘ Screening estimate from a state-policy table — verify with the county assessor before closing.
Climate risk First Street
- Flood 1/10 Low FEMA zone X (unshaded) · 0% chance over 30 yrs
- Wildfire 1/10 Low
- Heat 7/10 Severe 7 d/yr ≥112°F today · 18 d/yr by 30 yrs out
- Wind 4/10 Moderate 9% chance of damaging wind over 30 yrs
- Air quality 2/10 Low 1 unhealthy d/yr today · 1 by 30 yrs out
Nearby sold comps map
Loading sold comps map…
Walkable amenities ~0.75 mi
Loading nearby amenities…
Taxation est. · year 1
- Rental income
- $18,572
- − Mortgage interest
- −$10,077
- − Property taxes
- −$1,634
- − Insurance
- −$900
- − Repairs & maintenance
- −$1,486
- − Management
- −$1,486
- − Depreciation
- −$5,233
- Taxable loss
- −$2,245
- Est. tax savings @ 24.0%
- +$539
- After-tax cash flow
- $1,355/yr
For passive investors: Depreciation is non-cash, so a rental often shows a tax loss while cash-flowing — sheltering income. Rental losses are passive: they offset passive income freely, and up to $25,000/yr can offset ordinary (W-2) income if you actively participate and your MAGI is under $100k (phasing out to $0 by $150k); unused losses carry forward. On sale, claimed depreciation is recaptured at up to 25%, and gains may owe capital-gains tax (a 1031 exchange can defer both). Figures are a year-1 estimate at your 24.0% rate — not tax advice; consult a CPA.
Schools (NCES district)
- District
- N. Little Rock School District
- NCES district ID
- 0510680
- Math proficiency
- 21% ▼ -11.00%
- Reading proficiency
- 26% ▼ -9.00%
- Median HH income
- $38,325
- Composite
- 19.69/100
- National rank
- #8728
- State rank
- #191 of 238 in AR
Livability — North Little Rock
- Score
- 73/100
- State rank
- #24
- US rank
- #5452
Category grades
Schools grade is shown separately in the Schools card above.
Census & demographics
- Census place
- North Little Rock, AR
- County
- Pulaski County · 372,764 people
- City population
- 55,470
- Metro
- Little Rock-North Little Rock-Conway, AR
- Population (ZIP)
- 22,464
- Household income
- $79,010
- Rent vs Own
- Severe rent burden
- 960.0
Population outlook (Pulaski County) Hauer SSP2
- Today (2025)
- 415,378 people
- By 2030
- 423,720 · +2.0%
- By 2040
- 435,182 · +4.8%
- By 2050
- 440,904 · +6.1%
- By 2075
- 445,521 · +7.3%
- By 2100
- 419,173 · +0.9%
Race, ethnicity, and origin ACS 2023
- Neighborhood character
- Predominantly White (74%)
- Race & ethnicity
- White 74% Black 16% Two or more races 5% Hispanic / Latino 3% Asian 1%
- Common ancestry
- Italian 3% Slovak 3% Lithuanian 3%
- Foreign-born
- 3% · Canada
- Languages at home
- 96% English-only · Spanish 2%
Political lean MEDSL · Pulaski
- 2024 margin
- Strong D (+22.1) · D 59.8% · R 37.7% · Other 2.5%
- 2008→2024 swing
- +10.6pp toward D · 2008: 11.6pp · 2024: 22.1pp
- All cycles
- 2024: D+22.1 2020: D+22.5 2016: D+17.9 2012: D+11.4 2008: D+11.6
Not yet ingested
- Civics
- —
Market trends
- HPI YoY
- ▼ -204.77%
- Current HPI
- 201.5459
- Rent YoY
- ▲ 4.21%
- Metro
- Little Rock-North Little Rock-Conway, AR
- State GDP YoY
- ▲ 3.80%
- F500 in state
- 10
Industry mix (Fortune 500 HQ in AR)
| Industry | F500 HQs | Revenue |
|---|---|---|
| Retail | 1 | $681B |
|
||
| Food / Agriculture | 1 | $53B |
|
||
| Retail / Energy | 1 | $22B |
|
||
| Transportation / Logistics | 1 | $12B |
|
||
| Energy | 1 | $4B |
|
||
Price history
+71.3% since first listed8 events — show timeline
- 2026-06-02 Listed $179,900 CARMLS
- 2017-06-21 Pending — CARMLS
- 2017-06-16 Sold (MLS) $71,280 CARMLS
- 2017-05-11 Contingent — CARMLS
- 2017-03-21 Relisted — CARMLS
- 2017-03-14 Contingent — CARMLS
- 2017-03-03 Listed $105,000 CARMLS
- 2006-07-14 Sold (Public Records) $105,000 Public Records
Property tax history
+0.0%/yrLatest (2025): $1,634 · +6.0% YoY. Source: county tax records.
Cash-flow waterfall
monthlySold comps — $/sqft
last 12 mo · ≤1 miLoading sold comps…