8227 Chadwick St · Houston, TX
Flood risk 7/10 · Major
- FEMA flood zone
- X (unshaded)
- Chance of flooding over 30 yrs
- 0.99%
- Est. flood insurance / yr
- $507 – $1,088
Fire risk 2/10 · Minimal
- Est. fire insurance / yr
- $1,222 – $2,270
Heat risk 9/10 · Severe
- Hot days now (above 110°F)
- 7 days/yr
- Hot days in 30 yrs
- 24 days/yr
Wind risk 9/10 · Severe
- Chance of severe wind over 30 yrs
- 99.0%
Air-quality risk 3/10 · Minor
- Unhealthy air days now
- 2 days/yr
- Unhealthy air days in 30 yrs
- 3 days/yr
Risk factors via First Street. Map © Google.
Why this score? — see what drove the F grade
The composite is a weighted blend of 9 inputs, each scored 0–100. Each bar is that input's sub-score; the figure is the points it added to the 100-point composite (weight × sub-score).
- Appreciation +10.0/10.0
- ARV discount +5.5/15.0
- Cash flow +4.7/30.0
- Livability +3.7/5.0
- Schools +2.7/10.0
- Rent growth +2.5/5.0
- Condition / age +2.5/5.0
- 1% rule +0.6/10.0
- DSCR +0.0/10.0
$260,000
🖨 Deal sheet 📄 Offer letter ✓ Due diligence
Listing remarks
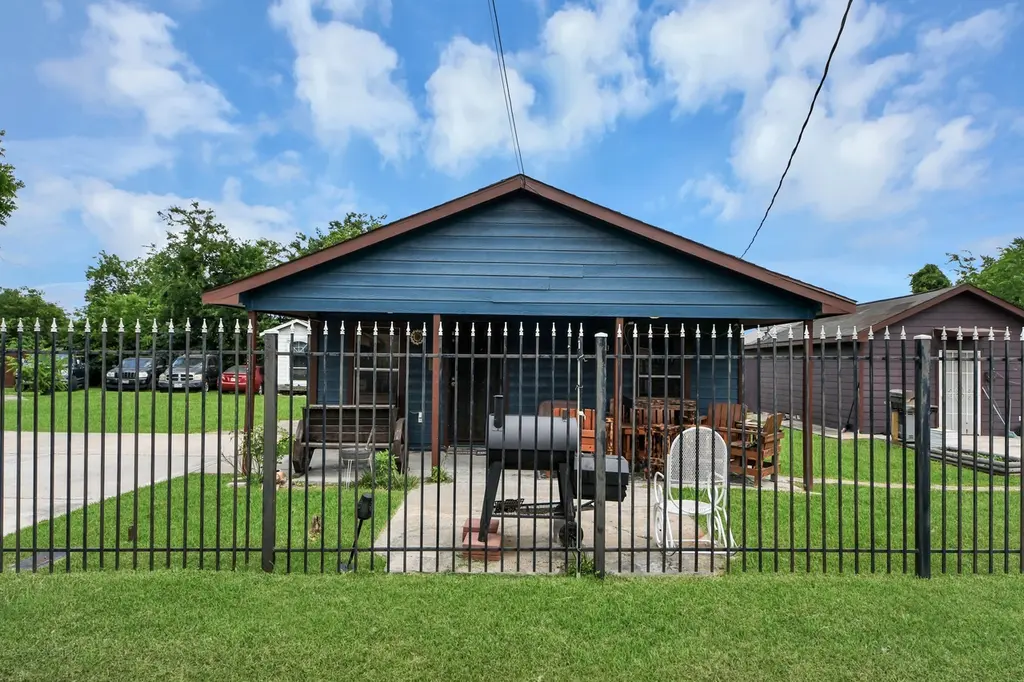
Unique property with incredible potential in a centrally located area near I-10. Ideal for investors, small business owners, or buyers seeking flexible living and workspace options. Situated in a residential/commercial/industrial area with no HOA and no restrictions. The main home features 3 bedrooms and 2 bathrooms, along with a separate accessory dwelling unit (mother-in-law quarters) offering 2 bedrooms and 2 bathrooms. A third building on the property already has electricity and sewer connections, per the owner, and could easily be finished out and converted into additional living space, office space, or a workshop. Situated on approximately 12,500 square feet, the property includes Lot
Key facts
- No restrictions
- No hoa
- 0.4 acre lot
Tags
Property features AI
Finance
- Financial info: Lease not considered
Exterior
- Utilities: Public water; Public sewer
- Home design: Residential property; Built in 1940; Pillar/post/pier foundation
- Construction: Cement siding; Wood siding; Composition roof
- Exterior features: Located in a subdivision
Interior
- Kitchen: Electric oven; Electric range; Microwave
- Bedrooms: Primary bedroom on the first floor (9x10); Primary bedroom on the first floor (11x12); Bedroom on the first floor (10x10); Bedroom on the first floor (10x11); Bedroom on the first floor (9x9); Total of 5 rooms
- Bathrooms: Four full bathrooms
- Heating & cooling: Central heating; Electric heating; Window unit heating; Central air conditioning; Electric cooling; Window unit cooling
- Interior features: Seller disclosure available
- Laundry & utility: Electric dryer hookup
Neighborhood map
What this means for you Summary
Snapshot
- This is a 2-bed/2.0-bath single-family listed at $260k.
Deal economics
- At list price, monthly cash flow is $-710 ($-9k/yr) — negative.
- To cash-flow at today's rent, offer at most $135k (48.2% below list).
- To meet the 1% rule (rent ≥ 1% of price), the offer needs to be $145k (44.2% below list).
- Recommended offer: $135k (48.2% below list) — sets the bar for cash-flow.
Location & tenants
- Location reads 74/100 on livability (#184 in TX, #4,771 nationally) — a middle-class / working-renter tenant base. Strengths: amenities A+, cost of living A+, housing A+; Watch: crime F.
- Houston ISD (urban): math 27% / reading 35% proficiency, ranked #593 of 826 in TX (top 72%) — families likely to look elsewhere, expect single-tenant / working-renter base with shorter leases; 71% free/reduced lunch — lower-income household profile, screen leases tightly.
- Zoned schools: Port Houston El (math 22% / reading 22%, grade F, #3,333 of 4,322 statewide, top 80%, 278 students, 99% FRL); Holland Middle (math 10% / reading 16%, grade F, #1,609 of 1,662 statewide, top 97%, 644 students, 98% FRL) — zoned schools average 99% FRL vs 71% district-wide (27 pts higher); higher-poverty schools than district average — tighter screening recommended.
- Zoned-school proficiency averages 18% at this address vs 31% district-wide (-14 pts) — the specific schools serving this property underperform the Houston ISD average; the district grade overstates school quality for this exact location.
- Market conditions: 153 active listings in the ZIP; 5 comparable units currently listed for rent nearby; rentals lingering (median 44d on market — plan ~5-8 weeks vacancy on turnover, expect pricing pressure); 80% of comp listings sitting > 30 days — soft ceiling on asking rent; 29,883 units permitted in Harris County in 2024 (8,621 in 5+ unit buildings).
- This rent runs 36% of the median local income ($48k/yr) — at the standard rent-burdened threshold; future hikes will face affordability resistance.
Forward outlook
- In year one you build about $28k of equity ($2k loan paydown + $26k appreciation (10.0% local appreciation)).
- Harris County population projected at +47% by 2050 — long-run rental-demand tailwind backs the buy-and-hold thesis.
- By year 2, paydown + projected appreciation supports a ~$45k cash-out refi (75% LTV) — recoverable capital for the next deal without selling this one.
Negotiation context
- It's been on market 27 days — a 2% lower offer ($256k) is reasonable based on typical stale-listing flexibility.
Risks & watch-outs
- Watch-outs: flood insurance adds $66/mo; built in 1940 — expect roof / HVAC / electrical / plumbing capex.
- Climate carrying-cost: major flood risk; severe wind risk, 99% chance of damaging wind over 30y; extreme-heat days projected 7→24/yr by 2055 (HVAC capex compounding) — expect insurance premiums to compound above CPI over the hold.
Questions for the listing agent
- What do current leases actually rent for vs. the listed asking? Can we see a recent rent roll and the last 12 months of T-12 income?
- Built in 1940 — when were the roof, HVAC, electrical panel, plumbing, and water heater last replaced?
- What's the actual annual flood-insurance premium (NFIP or private), and is the property in a SFHA with mandatory coverage?
- Is there a deadline driving the sale (1031 exchange, divorce, estate, relocation)? That informs how much negotiation room exists.
- Schools are D-rated, which usually means shorter tenancies and higher turnover. Who's the typical renter profile here, and what's been the actual vacancy rate?
- Crime grade is F in this area — have there been break-ins, vandalism, or insurance claims at this property in the last 3 years? What carrier currently insures it and at what premium?
- The area grade is low — what's the realistic commute time and amenity access for the typical tenant pool here? Any planned neighborhood developments (good or bad) we should know about?
- What's the average days-on-market for RENTAL listings here right now (not sales)? A rising rental-DOM trend means longer vacancies and softer asking-rent achievability than the comps imply.
- What's the recent tenant-quality profile in this submarket — average credit score on applications, eviction rate, late-payment / NSF rate, and stable-employment percentage? A property-management company in the area should have these aggregated.
- How much new for-sale + rental construction is in the pipeline within 1–3 miles? Heavy new supply typically softens prices + rents 12–24 months out; constrained supply supports both.
Investment metrics
- 1% rule
- 0.56% ✗
- Cap rate
- 3.32%
- Cash-on-cash
- -10.60%
- DSCR
- 0.53
- GRM
- 14.9
CMA / ARV
- ARV (on-the-fly)
- $248,976
- Comps found
- 5
Show comp detail 5 sales within ~0.75 mi
| Address | Dist | Beds/Ba | Sqft | Sold | Price | $/sf | Match |
|---|---|---|---|---|---|---|---|
| 8205 Garfield St | 0.47mi | 3/2.0 (+1) | 1,302 (-5%) | 5mo | $203,900 | $157 | 61 |
| 8606 Guinevere St | 0.54mi | 3/1.5 (+1) | 1,238 (-10%) | 2mo | $225,000 | $182 | 51 |
| 1427 Teanaway Ln | 0.40mi | 3/2.0 (+1) | 1,232 (-10%) | 11mo | $239,750 | $195 | 50 |
| 8519 Fillmore St | 0.45mi | 3/1.0 (+1) | 1,278 (-7%) | 22mo | $210,000 | $164 | 41 |
| 8711 Othello St | 0.71mi | 3/2.0 (+1) | 1,180 (-14%) | 8mo | $215,000 | $182 | 32 |
Match score weights: distance 35% · size 25% · config 20% · recency 20%. Top-matched comps best support the ARV.
Projected returns pro-forma
10.0% appreciation · 3.0% rent growth · sell at horizon
- IRR
- 16.1%
- Equity multiple
- 2.32×
- Total profit
- $96,457
- Equity at exit
- $234,229
- IRR
- 15.5%
- Equity multiple
- 5.39×
- Total profit
- $319,715
- Equity at exit
- $505,123
Cash invested: $72,800 (down + closing). Projections, not guarantees.
Landlord ↔ Tenant lean methodology
- Overall (STATE)
- 87 Strongly Landlord-Friendly
- State Texas
- 87 Strongly Landlord-Friendly · R+5
- County
- — inherits STATE
- City
- — inherits STATE
ZIP-level market 77029
- Home prices YoY
- 7.2%
- Active inventory
- 153
- Price-to-rent
- 14.9×
Monthly cashflow live
- Estimated rent
- $1,452 high interval (Pro) →
- Mortgage (P&I)
- −$1,363
- Tax from tax record
- −$318 /mo · $3,822/yr
- Insurance
- −$108
- Flood insurance flood zone
- −$66 /mo · $798/yr
- HOA
- −$0
- Vacancy / Maint / Mgmt
- −$305
- Net cashflow
- $-710
Break-even live
UW: 25.0% down · 7.5% · 30yr · 1.5% tax · 5.0% vac · 8.0% maint · 8.0% mgmt
Financing live
Cash to close
- Down payment
- $65,000
- Closing costs
- $7,800
- Reserves months
- —
- Total cash needed
- —
Loan-product check · same deal, 3 products live
Conventional
25% down · 7.5% · 30yr
- Down + closing
- —
- Monthly P&I
- —
- Monthly cashflow
- —
- DSCR
- —
- Eligible?
- —
Personal DTI + credit; lowest rate.
DSCR
20% down · 8.5% · 30yr
- Down + closing
- —
- Monthly P&I
- —
- Monthly cashflow
- —
- DSCR
- —
- Eligible?
- —
No personal income docs; deal must DSCR.
Hard money
10% down · 12.0% · 12mo
- Down + closing
- —
- Monthly P&I
- —
- Monthly cashflow
- —
- DSCR
- —
- Eligible?
- —
Short-term bridge; refi at stabilization.
Rent comps 5 comps
| Address | Beds | Baths | Sqft | Rent | $/sqft | DOM | Units | Dist |
|---|---|---|---|---|---|---|---|---|
| 2203 Pearl St Houston, TX | 3.0 | 2.0 | 1298 | $1,570 | $1.21 | 14d | 1 | 0.48mi |
| 8534 Fillmore St Houston, TX | 3.0 | 1.0 | 965 | $1,600 | $1.66 | 43d | 1 | 0.50mi |
| 8726 Josie St Houston, TX | 3.0 | 1.0 | 950 | $1,000 | $1.05 | 43d | 1 | 0.75mi |
| 8735 Cowart St Houston, TX | 3.0 | 1.0 | 1136 | $1,000 | $0.88 | 43d | 1 | 0.81mi |
| 9709 Cargill St Houston, TX | 3.0 | 2.0 | 1184 | $2,300 | $1.94 | 43d | 1 | 1.45mi |
Listing history 16 events
-
2026-06-18days on market $260,000 Active 27 DOM
-
2026-06-17days on market $260,000 Active 26 DOM
-
2026-06-16days on market $260,000 Active 25 DOM
-
2026-06-15days on market $260,000 Active 24 DOM
-
2026-06-13days on market $260,000 Active 22 DOM
-
2026-06-09days on market $260,000 Active 18 DOM
-
2026-06-08days on market $260,000 Active 17 DOM
-
2026-06-07days on market $260,000 Active 16 DOM
-
2026-06-04days on market $260,000 Active 13 DOM
-
2026-06-02days on market $260,000 Active 11 DOM
-
2026-06-01days on market $260,000 Active 10 DOM
-
2026-05-31days on market $260,000 Active 9 DOM
-
2026-05-12$260,000 Active
-
2019-04-16soldstatus
-
2013-04-03soldstatus
-
1988-01-02soldstatus
ⓘ Source: listings_history table (triggers on properties + properties_extension) + one-shot
backfill from property_details.listing_events for pre-trigger history.
Tax reassessment forecast TX · Resets to sale price
- Current annual tax
- $3,822 · $318/mo
- Projected year-2 tax
- $4,758 · $396/mo
- Expected delta
- +$936/yr (+$78/mo · 24.5%)
ⓘ Screening estimate from a state-policy table — verify with the county assessor before closing.
Climate risk First Street
- Flood 7/10 Severe FEMA zone X (unshaded) · 99% chance over 30 yrs
- Wildfire 2/10 Low
- Heat 9/10 Extreme 7 d/yr ≥110°F today · 24 d/yr by 30 yrs out
- Wind 9/10 Extreme 99% chance of damaging wind over 30 yrs
- Air quality 3/10 Moderate 2 unhealthy d/yr today · 3 by 30 yrs out
Nearby sold comps map
Loading sold comps map…
Walkable amenities ~0.75 mi
Loading nearby amenities…
Taxation est. · year 1
- Rental income
- $17,423
- − Mortgage interest
- −$14,564
- − Property taxes
- −$3,822
- − Insurance
- −$2,098
- − Repairs & maintenance
- −$1,394
- − Management
- −$1,394
- − Depreciation
- −$7,564
- Taxable loss
- −$13,412
- Est. tax savings @ 24.0%
- +$3,219
- After-tax cash flow
- $-5,298/yr
For passive investors: Depreciation is non-cash, so a rental often shows a tax loss while cash-flowing — sheltering income. Rental losses are passive: they offset passive income freely, and up to $25,000/yr can offset ordinary (W-2) income if you actively participate and your MAGI is under $100k (phasing out to $0 by $150k); unused losses carry forward. On sale, claimed depreciation is recaptured at up to 25%, and gains may owe capital-gains tax (a 1031 exchange can defer both). Figures are a year-1 estimate at your 24.0% rate — not tax advice; consult a CPA.
Schools (NCES district)
- District
- Houston ISD
- NCES district ID
- 4823640
- Math proficiency
- 27% ▼ -18.00%
- Reading proficiency
- 35% ▼ -6.00%
- Median HH income
- $46,054
- Composite
- 26.63/100
- National rank
- #7173
- State rank
- #593 of 826 in TX
Livability — Houston
- Score
- 74/100
- State rank
- #184
- US rank
- #4771
Category grades
Schools grade is shown separately in the Schools card above.
Census & demographics
- Census place
- Houston, TX
- County
- Harris County · 4,702,590 people
- City population
- 3,226,434
- Metro
- Houston-The Woodlands-Sugar Land, TX
- Population (ZIP)
- 16,154
- Household income
- $48,279
- Rent vs Own
- Severe rent burden
- 457.0
Population outlook (Harris County) Hauer SSP2
- Today (2025)
- 5,571,493 people
- By 2030
- 6,089,821 · +9.3%
- By 2040
- 7,142,806 · +28.2%
- By 2050
- 8,185,864 · +46.9%
- By 2075
- 10,574,329 · +89.8%
- By 2100
- 12,109,958 · +117.4%
Race, ethnicity, and origin ACS 2023
- Neighborhood character
- Predominantly Hispanic (72%)
- Race & ethnicity
- Hispanic / Latino 72% Two or more races 32% Black 22% White 5%
- Hispanic origin (detail)
- Mexican 66%
- Foreign-born
- 31% · Canada
- Languages at home
- 39% English-only · Spanish 61%
Political lean MEDSL · Harris
- 2024 margin
- Lean D (+5.5) · D 52.0% · R 46.4% · Other 1.6%
- 2008→2024 swing
- +3.9pp toward D · 2008: 1.6pp · 2024: 5.5pp
- All cycles
- 2024: D+5.5 2020: D+13.3 2016: D+12.4 2012: D+0.1 2008: D+1.6
Not yet ingested
- Civics
- —
Market trends
- HPI YoY
- ▲ 18.53%
- Current HPI
- 276.1811
- Rent YoY
- —
- Metro
- Houston-The Woodlands-Sugar Land, TX
- State GDP YoY
- ▲ 3.95%
- F500 in state
- 110
Industry mix (Fortune 500 HQ in TX)
| Industry | F500 HQs | Revenue |
|---|---|---|
| Energy | 16 | $1,198B |
|
||
| Technology | 5 | $198B |
|
||
| Engineering / Construction | 4 | $72B |
|
||
| Energy Services | 3 | $60B |
|
||
| Utilities | 3 | $41B |
|
||
| Healthcare | 2 | $330B |
|
||
Price history
4 events — show timeline
- 2026-05-12 Listed $260,000 HARMLS
- 2019-04-16 Sold (Public Records) — Public Records
- 2013-04-03 Sold (Public Records) — Public Records
- 1988-01-02 Sold (Public Records) — Public Records
Property tax history
+18.8%/yrLatest (2025): $3,822 · +11.7% YoY. Source: county tax records.
Cash-flow waterfall
monthlySold comps — $/sqft
last 12 mo · ≤1 miLoading sold comps…