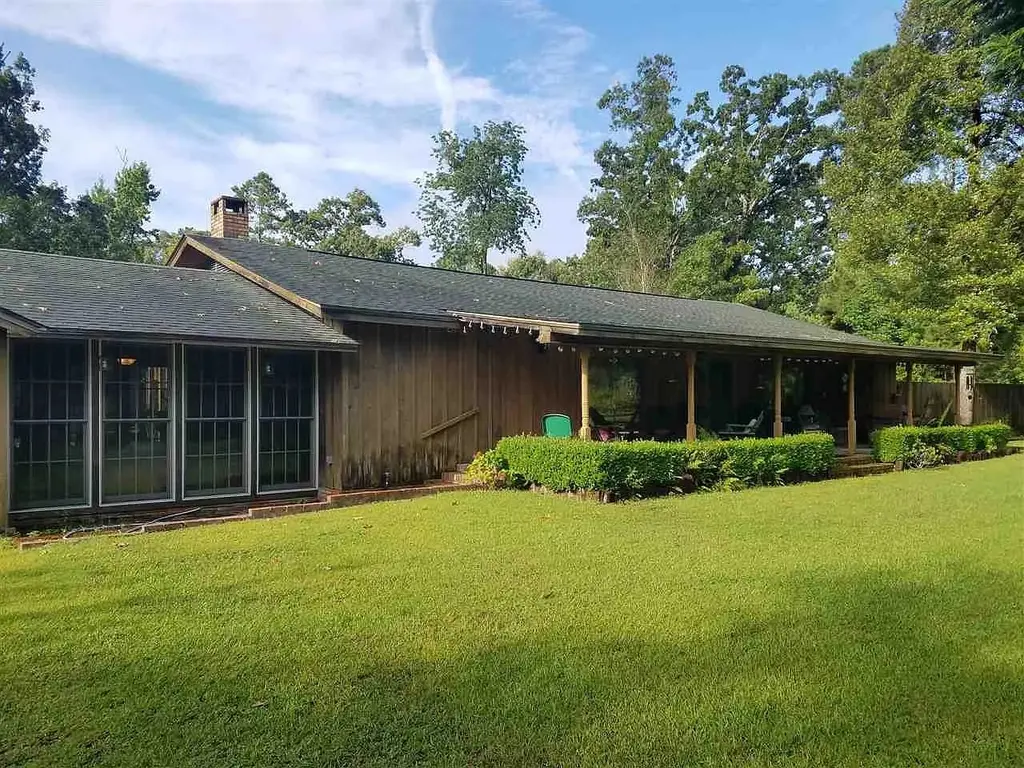
933 Cr 2131 · South Toledo Bend, TX
Flood risk 1/10 · Minimal
- FEMA flood zone
- X (unshaded)
- Chance of flooding over 30 yrs
- 0.0%
- Est. flood insurance / yr
- $507 – $1,088
Fire risk 5/10 · Moderate
- Est. fire insurance / yr
- $1,222 – $2,270
Heat risk 8/10 · Major
- Hot days now (above 110°F)
- 7 days/yr
- Hot days in 30 yrs
- 22 days/yr
Wind risk 8/10 · Major
- Chance of severe wind over 30 yrs
- 98.0%
Air-quality risk 1/10 · Minimal
- Unhealthy air days now
- 0 days/yr
- Unhealthy air days in 30 yrs
- 0 days/yr
Risk factors via First Street. Map © Google.
Why this score? — see what drove the C- grade
The composite is a weighted blend of 9 inputs, each scored 0–100. Each bar is that input's sub-score; the figure is the points it added to the 100-point composite (weight × sub-score).
- Cash flow +14.2/30.0
- Appreciation +9.2/10.0
- ARV discount +7.5/15.0
- 1% rule +4.5/10.0
- DSCR +4.3/10.0
- Schools +3.0/10.0
- Livability +2.7/5.0
- Rent growth +2.5/5.0
- Condition / age +2.5/5.0
$139,900
🖨 Deal sheet (PDF) 📄 Offer letter ✓ Due diligence
Listing remarks
Peaceful Country Living with Room to Make It Your Own Welcome to quiet East Texas living! This property offers the perfect opportunity for a homeowner looking for space, privacy, and the ability to personalize a home to fit their lifestyle. Nestled in a serene rural setting, you’ll enjoy the calm surroundings, open space, and slower pace that Burkeville has to offer. The home sits on a generous lot with plenty of room for outdoor activities, gardening, or simply relaxing and enjoying the fresh air. With a little vision and personal touch, this property can truly become your ideal home or weekend retreat. Whether you're looking to escape the city, settle into a peaceful environment,
Key facts
- Generous lot
- Great potential
- Serene rural setting
Tags
Property features AI
Exterior
- Parking: Detached garage; 2-car garage
- Utilities: Private well water
- Home design: Residential property; Built in 1980; Slab foundation
- Construction: Wood siding construction; Composition roof
- Exterior features: Concrete road access; Lot includes other features
Interior
- Bedrooms: Primary bedroom on the first floor; Two additional bedrooms on the first floor
- Flooring: Carpet; Tile; Wood
- Bathrooms: 2 full bathrooms
- Heating & cooling: Central heating (electric); Central air conditioning (electric)
- Interior features: One fireplace; Total of 3 rooms
Neighborhood map
What this means for you Summary
Snapshot
- This is a 3-bed/2.0-bath single-family listed at $140k.
Deal economics
- At list price, monthly cash flow is $24 ($291/yr) — positive.
- The deal already cash-flows at list — no discount required.
- To meet the 1% rule (rent ≥ 1% of price), the offer needs to be $133k (4.9% below list).
- Recommended offer: $133k (4.9% below list) — sets the bar for 1% rule.
- Cap rate 6.5% vs local median 2.4% in South Toledo Bend — top-decile yield for the area; either an underpriced asset or a hidden risk that comps aren't pricing in. Stress-test before assuming the spread holds.
Location & tenants
- Location reads 53/100 on livability (#1,431 in TX) — a working-class tenant base; expect higher turnover. Strengths: cost of living A+, crime A; Watch: health & safety C-, housing D, schools F.
- Burkeville ISD (rural): math 30% / reading 35% proficiency, ranked #966 of 1,141 in TX (top 85%) — families likely to look elsewhere, expect single-tenant / working-renter base with shorter leases; 65% free/reduced lunch — lower-income household profile, screen leases tightly.
- Market conditions: 62 active listings in the ZIP.
Forward outlook
- In year one you build about $13k of equity ($967 loan paydown + $12k appreciation (8.5% local appreciation)).
- Newton County population projected at -21% by 2050 — secular population decline; favor cash flow + early exit over multi-decade hold.
- At projected returns (8.5% appreciation + 3.0% rent growth), your $39k cash investment doubles in ~3 years — after that, you're playing with house money.
- By year 3, paydown + projected appreciation supports a ~$32k cash-out refi (75% LTV) — recoverable capital for the next deal without selling this one.
Negotiation context
- It's been on market 41 days — a 3% lower offer ($136k) is reasonable based on typical stale-listing flexibility.
Risks & watch-outs
- Climate carrying-cost: severe wind risk, 98% chance of damaging wind over 30y; moderate wildfire risk; extreme-heat days projected 7→22/yr by 2055 (HVAC capex compounding) — expect insurance premiums to compound above CPI over the hold.
Questions for the listing agent
- It's been on market 41 days. Have you received any prior offers? Is the seller open to a 5% concession, seller financing, or rate buy-down credit?
- Is there a deadline driving the sale (1031 exchange, divorce, estate, relocation)? That informs how much negotiation room exists.
- Schools are F-rated, which usually means shorter tenancies and higher turnover. Who's the typical renter profile here, and what's been the actual vacancy rate?
- What's the average days-on-market for RENTAL listings here right now (not sales)? A rising rental-DOM trend means longer vacancies and softer asking-rent achievability than the comps imply.
- What's the recent tenant-quality profile in this submarket — average credit score on applications, eviction rate, late-payment / NSF rate, and stable-employment percentage? A property-management company in the area should have these aggregated.
- How much new for-sale + rental construction is in the pipeline within 1–3 miles? Heavy new supply typically softens prices + rents 12–24 months out; constrained supply supports both.
Investment metrics
- 1% rule
- 0.95% ✗
- Cap rate
- 6.50%
- Cash-on-cash
- 0.74%
- DSCR
- 1.03
- GRM
- 8.8
CMA / ARV
No comps found within radius.
Projected returns pro-forma
8.49% appreciation · 3.0% rent growth · sell at horizon
- IRR
- 21.6%
- Equity multiple
- 2.63×
- Total profit
- $63,671
- Equity at exit
- $111,009
- IRR
- 19.8%
- Equity multiple
- 5.70×
- Total profit
- $184,015
- Equity at exit
- $225,015
Cash invested: $39,172 (down + closing). Projections, not guarantees.
Landlord ↔ Tenant lean methodology
- Overall (STATE)
- 87 Strongly Landlord-Friendly
- State Texas
- 87 Strongly Landlord-Friendly · R+5
- County
- — inherits STATE
- City
- — inherits STATE
ZIP-level market 75932
- Home prices YoY
- 4.1%
- Active inventory
- 62
- Price-to-rent
- 8.8×
Monthly cashflow live
- Estimated rent
- $1,330 medium interval (Pro) →
- Mortgage (P&I)
- −$734
- Tax from tax record
- −$235 /mo · $2,818/yr
- Insurance
- −$58
- HOA
- −$0
- Vacancy / Maint / Mgmt
- −$279
- Net cashflow
- $24
Break-even live
Sensitivity live
| Price | -10% $103 | -5% $64 | +0% $24 | +5% $-15 | +10% $-55 |
|---|---|---|---|---|---|
| Rent | -10% $-81 | -5% $-28 | +0% $24 | +5% $77 | +10% $129 |
| Rate | -1.0pp $95 | -0.5pp $60 | base $24 | +0.5pp $-12 | +1.0pp $-49 |
UW: 25.0% down · 7.5% · 30yr · 1.5% tax · 5.0% vac · 8.0% maint · 8.0% mgmt
Financing live
Cash to close
- Down payment
- $34,975
- Closing costs
- $4,197
- Reserves months
- —
- Total cash needed
- —
Loan-product check · same deal, 3 products live
Conventional
25% down · 7.5% · 30yr
- Down + closing
- —
- Monthly P&I
- —
- Monthly cashflow
- —
- DSCR
- —
- Eligible?
- —
Personal DTI + credit; lowest rate.
DSCR
20% down · 8.5% · 30yr
- Down + closing
- —
- Monthly P&I
- —
- Monthly cashflow
- —
- DSCR
- —
- Eligible?
- —
No personal income docs; deal must DSCR.
Hard money
10% down · 12.0% · 12mo
- Down + closing
- —
- Monthly P&I
- —
- Monthly cashflow
- —
- DSCR
- —
- Eligible?
- —
Short-term bridge; refi at stabilization.
Listing history 20 events
-
2026-06-21days on market $139,900 Active 41 DOM
-
2026-06-19pricedays on market $139,900 Active 39 DOM
-
2026-06-18days on market $149,900 Active 38 DOM
-
2026-06-17days on market $149,900 Active 37 DOM
-
2026-06-16days on market $149,900 Active 36 DOM
-
2026-06-15days on market $149,900 Active 35 DOM
-
2026-06-14days on market $149,900 Active 33 DOM
-
2026-06-12days on market $149,900 Active 32 DOM
-
2026-06-09days on market $149,900 Active 29 DOM
-
2026-06-08days on market $149,900 Active 28 DOM
-
2026-06-07days on market $149,900 Active 27 DOM
-
2026-06-05days on market $149,900 Active 25 DOM
-
2026-06-04days on market $149,900 Active 23 DOM
-
2026-06-02days on market $149,900 Active 22 DOM
-
2026-06-01days on market $149,900 Active 21 DOM
-
2026-05-31days on market $149,900 Active 20 DOM
-
2026-05-31days on market $149,900 Active 19 DOM
-
2026-05-14price $159,900 849-char remark
-
2026-05-11$179,900 Active 849-char remark
-
2021-09-10soldstatus
ⓘ Source: listings_history table (triggers on properties + properties_extension) + one-shot
backfill from property_details.listing_events for pre-trigger history.
Tax reassessment forecast TX · Resets to sale price
- Current annual tax
- $2,818 · $235/mo
- Projected year-2 tax
- $2,818 · $235/mo
- Expected delta
- $0/yr ($0/mo · 0.0%)
ⓘ Screening estimate from a state-policy table — verify with the county assessor before closing.
Climate risk First Street
- Flood 1/10 Low FEMA zone X (unshaded) · 0% chance over 30 yrs
- Wildfire 5/10 Major
- Heat 8/10 Severe 7 d/yr ≥110°F today · 22 d/yr by 30 yrs out
- Wind 8/10 Severe 98% chance of damaging wind over 30 yrs
- Air quality 1/10 Low 0 unhealthy d/yr today · 0 by 30 yrs out
Nearby sold comps map
Loading sold comps map…
Walkable amenities ~0.75 mi
Loading nearby amenities…
Taxation est. · year 1
- Rental income
- $15,965
- − Mortgage interest
- −$7,837
- − Property taxes
- −$2,818
- − Insurance
- −$700
- − Repairs & maintenance
- −$1,277
- − Management
- −$1,277
- − Depreciation
- −$4,070
- Taxable loss
- −$2,014
- Est. tax savings @ 24.0%
- +$483
- After-tax cash flow
- $774/yr
For passive investors: Depreciation is non-cash, so a rental often shows a tax loss while cash-flowing — sheltering income. Rental losses are passive: they offset passive income freely, and up to $25,000/yr can offset ordinary (W-2) income if you actively participate and your MAGI is under $100k (phasing out to $0 by $150k); unused losses carry forward. On sale, claimed depreciation is recaptured at up to 25%, and gains may owe capital-gains tax (a 1031 exchange can defer both). Figures are a year-1 estimate at your 24.0% rate — not tax advice; consult a CPA.
Schools (NCES district)
- District
- Burkeville ISD
- NCES district ID
- 4812150
- Math proficiency
- 30% ▲ 5.00%
- Reading proficiency
- 35% ▬ 0.00%
- Median HH income
- $38,753
- Composite
- 29.92/100
- National rank
- #11672
- State rank
- #966 of 1141 in TX
Livability — South Toledo Bend
- Score
- 53/100
- State rank
- #1431
- US rank
- #24460
Category grades
Schools grade is shown separately in the Schools card above.
Census & demographics
- Population (ZIP)
- 1,339
Population outlook (Newton County) Hauer SSP2
- Today (2025)
- 13,123 people
- By 2030
- 12,567 · -4.2%
- By 2040
- 11,431 · -12.9%
- By 2050
- 10,393 · -20.8%
- By 2075
- 8,230 · -37.3%
- By 2100
- 6,038 · -54.0%
Race, ethnicity, and origin ACS 2023
- Neighborhood character
- Predominantly White (82%)
- Race & ethnicity
- White 82% Black 10% Two or more races 4% Hispanic / Latino 2%
- Common ancestry
- Lithuanian 3% Slovak 2% Hungarian 1%
Political lean MEDSL · Newton
- 2024 margin
- Solid R (+66.6) · D 16.6% · R 83.2%
- 2008→2024 swing
- -34.4pp toward R · 2008: -32.2pp · 2024: -66.6pp
- All cycles
- 2024: R+66.6 2020: R+60.9 2016: R+49.5 2012: R+43.3 2008: R+32.2
Not yet ingested
- Civics
- —
Market trends
- HPI YoY
- ▲ 8.49%
- Current HPI
- 214.4428
- Rent YoY
- —
- Metro
- —
- State GDP YoY
- ▲ 3.95%
- F500 in state
- 110
Industry mix (Fortune 500 HQ in TX)
| Industry | F500 HQs | Revenue |
|---|---|---|
| Energy | 16 | $1,198B |
|
||
| Technology | 5 | $198B |
|
||
| Engineering / Construction | 4 | $72B |
|
||
| Energy Services | 3 | $60B |
|
||
| Utilities | 3 | $41B |
|
||
| Healthcare | 2 | $330B |
|
||
Price history
-16.7% since first listed5 events — show timeline
- 2026-05-28 Price Changed $149,900 HARMLS
- 2026-05-21 Price Changed $154,900 HARMLS
- 2026-05-14 Price Changed $159,900 HARMLS
- 2026-05-11 Listed $179,900 HARMLS
- 2021-09-10 Sold (Public Records) — Public Records
Property tax history
+5.2%/yrLatest (2025): $2,818 · -0.2% YoY. Source: county tax records.
Cash-flow waterfall
monthlySold comps — $/sqft
last 12 mo · ≤1 miLoading sold comps…